Anomaly detection involves training a probability model on non-anomalous training examples to determine if new examples are anomalous. A Gaussian distribution can be used as a probability model where the center represents the highest probability and examples outside the learned regions have the lowest probability. To detect anomalies, a Gaussian distribution is fit to each feature and the probabilities are multiplied to get an overall probability. Anything below a threshold probability epsilon is considered an anomaly. Anomaly detection can also be framed as a supervised learning problem by labeling all training examples as non-anomalous.
This presentation educates you about R - Nonlinear Least Square with Following the description of parameters using syntax and example program with the chart.
For more topics stay tuned with Learnbay.
Regression Analysis and model comparison on the Boston Housing DataShivaram Prakash
Creation of regression models to predict the median housing price using the Boston Housing dataset. Models used: Generalized linear model, generalized additive model, artificial neural networks, regression tree
Random Number Generation techniques, Pseudo Random Number generation techniques. How Random numbers are generated? Linear Congruential Generator.
My References : https://www.youtube.com/watch?v=fEWigU1dcp8 .
Short Summary : https://www.slideshare.net/VinitDantkale/summary-of-random-number-generation
Used in Information Theory and Coding, Cryptography, Information network and Security, mathematics.
Introduction to linear regression and the maths behind it like line of best fit, regression matrics. Other concepts include cost function, gradient descent, overfitting and underfitting, r squared.
Unsupervised learning involves using unlabeled data. It is used for specific problematic like : clustering, dimensionality reduction and association rule learning.
In the first section we will talk about some of the clustering methods: k-mean, mean shift, Gaussian mixture and affinity propagation model . We will also define and use silhouette scores that will help to select the most appropriate number of clusters that the data may have.
[Notebook](https://colab.research.google.com/drive/1g4hcSfiO-TW35JbiQ_kGQAsgMZDPkp7L)
해당 자료는 풀잎스쿨 18기 중 "설명가능한 인공지능 기획!" 진행 중 Counterfactual Explanation 세션에 대해서 정리한 자료입니다.
논문, Youtube 및 하기 자료를 바탕으로 정리되었습니다.
https://christophm.github.io/interpretable-ml-book/
MM - KBAC: Using mixed models to adjust for population structure in a rare-va...Golden Helix Inc
Confounding from population structure, extended families and inbreeding can be a significant issue for burden and kernel association tests on rare variants from next generation DNA sequencing. An obvious solution is to combine the power of a mixed model regression analysis with the ability to assess the rare variant burden using methods such as KBAC or CMC. Recent approaches have adjusted burden and kernel tests using linear regression models; this method adjusts for the relatedness of samples and includes that directly into a logistic regression model.
This webcast will focus on the details of bringing Mixed Model Regression and KBAC together, including: deriving an optimal logistic mixed model algorithm for calculating the reduced model score, how the kinship or random effects matrix should be specified, and how it all comes together into one algorithm. Results from applying the method to variants from the 1000 Genomes project will also be presented and compared to famSKAT.
Software Delivery At the Speed of AI: Inflectra Invests In AI-Powered QualityInflectra
In this insightful webinar, Inflectra explores how artificial intelligence (AI) is transforming software development and testing. Discover how AI-powered tools are revolutionizing every stage of the software development lifecycle (SDLC), from design and prototyping to testing, deployment, and monitoring.
Learn about:
• The Future of Testing: How AI is shifting testing towards verification, analysis, and higher-level skills, while reducing repetitive tasks.
• Test Automation: How AI-powered test case generation, optimization, and self-healing tests are making testing more efficient and effective.
• Visual Testing: Explore the emerging capabilities of AI in visual testing and how it's set to revolutionize UI verification.
• Inflectra's AI Solutions: See demonstrations of Inflectra's cutting-edge AI tools like the ChatGPT plugin and Azure Open AI platform, designed to streamline your testing process.
Whether you're a developer, tester, or QA professional, this webinar will give you valuable insights into how AI is shaping the future of software delivery.
Smart TV Buyer Insights Survey 2024 by 91mobiles.pdf91mobiles
91mobiles recently conducted a Smart TV Buyer Insights Survey in which we asked over 3,000 respondents about the TV they own, aspects they look at on a new TV, and their TV buying preferences.
The Art of the Pitch: WordPress Relationships and SalesLaura Byrne
Clients don’t know what they don’t know. What web solutions are right for them? How does WordPress come into the picture? How do you make sure you understand scope and timeline? What do you do if sometime changes?
All these questions and more will be explored as we talk about matching clients’ needs with what your agency offers without pulling teeth or pulling your hair out. Practical tips, and strategies for successful relationship building that leads to closing the deal.
Accelerate your Kubernetes clusters with Varnish CachingThijs Feryn
A presentation about the usage and availability of Varnish on Kubernetes. This talk explores the capabilities of Varnish caching and shows how to use the Varnish Helm chart to deploy it to Kubernetes.
This presentation was delivered at K8SUG Singapore. See https://feryn.eu/presentations/accelerate-your-kubernetes-clusters-with-varnish-caching-k8sug-singapore-28-2024 for more details.
"Impact of front-end architecture on development cost", Viktor TurskyiFwdays
I have heard many times that architecture is not important for the front-end. Also, many times I have seen how developers implement features on the front-end just following the standard rules for a framework and think that this is enough to successfully launch the project, and then the project fails. How to prevent this and what approach to choose? I have launched dozens of complex projects and during the talk we will analyze which approaches have worked for me and which have not.
Kubernetes & AI - Beauty and the Beast !?! @KCD Istanbul 2024Tobias Schneck
As AI technology is pushing into IT I was wondering myself, as an “infrastructure container kubernetes guy”, how get this fancy AI technology get managed from an infrastructure operational view? Is it possible to apply our lovely cloud native principals as well? What benefit’s both technologies could bring to each other?
Let me take this questions and provide you a short journey through existing deployment models and use cases for AI software. On practical examples, we discuss what cloud/on-premise strategy we may need for applying it to our own infrastructure to get it to work from an enterprise perspective. I want to give an overview about infrastructure requirements and technologies, what could be beneficial or limiting your AI use cases in an enterprise environment. An interactive Demo will give you some insides, what approaches I got already working for real.
DevOps and Testing slides at DASA ConnectKari Kakkonen
My and Rik Marselis slides at 30.5.2024 DASA Connect conference. We discuss about what is testing, then what is agile testing and finally what is Testing in DevOps. Finally we had lovely workshop with the participants trying to find out different ways to think about quality and testing in different parts of the DevOps infinity loop.
Connector Corner: Automate dynamic content and events by pushing a buttonDianaGray10
Here is something new! In our next Connector Corner webinar, we will demonstrate how you can use a single workflow to:
Create a campaign using Mailchimp with merge tags/fields
Send an interactive Slack channel message (using buttons)
Have the message received by managers and peers along with a test email for review
But there’s more:
In a second workflow supporting the same use case, you’ll see:
Your campaign sent to target colleagues for approval
If the “Approve” button is clicked, a Jira/Zendesk ticket is created for the marketing design team
But—if the “Reject” button is pushed, colleagues will be alerted via Slack message
Join us to learn more about this new, human-in-the-loop capability, brought to you by Integration Service connectors.
And...
Speakers:
Akshay Agnihotri, Product Manager
Charlie Greenberg, Host
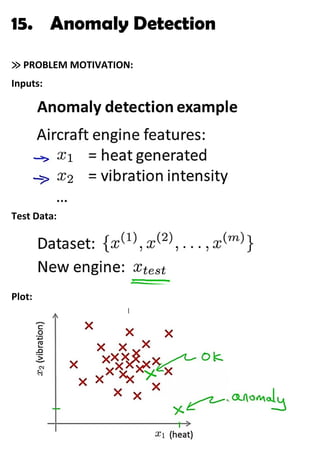
2. Problem: we are given some training examples. We assume them
to be NON-ANOMALOUS. So, we need to find if a new example is
anomalous or not.
We train a PROBABILITY MODEL:
It divides the plot into various regions, such that each region
corresponds to a level of provability.
Centre → highest probability
Outside → lowest P
4. Examples:
σ → controls the width and height of curve
µ → mean of all values of x: controls the center..
Area below the curve is always = 1
So, the curve is either taller or wider.
5. Estimation of µ and σ :
≫ ALGORITHM FOR ANOMALY DETECTION:
Each feature can be individually distributred using
Normal(Gaussian) distribution:
6. P( x ) = product of probabilities of individual features
Note:
Steps of algorithm:
8. P( x ) → height of curve == P(x1 ; µ1 , σ2
2) x P(x2 ; µ2 , σ2
2)
For a new example:
9. This means that anything below a particular height in the plot,
given by ϵ : is an anomaly
OR
Anything outside the learned region is an anomaly:
i.e., everything outside the magenta curve:
≫ DEVELOPING ANOMALY DETECTION SYSTEM:
Anomaly detection system problem can be converted to a likes of
Supervised Learning problem.
Therefore:
10. Thus we can take:
Meaning all the training set examples are non-anomalous
In Cross validation set and test set, we can have some examples of
anomalous (y=1) and some of non-anomalous (y=0) type:
Example:
11. ≫ How to evaluate the algorithm:
≫ How to choose ϵ :
We can choose the value of ϵ which gives the best value of F1 score.
Anomaly detection vs Supervised Learning:
In anomaly detection, it’s better to model anomalies based on
negative examples, rather than positive examples… as future
anomalies may be totally different.
12. Applications of Anomaly detection vs Supervised Learning:
Fraud detection can be a supervised learning application but only if
there are a lot of people on the website who are doing fraudulent
activity, i.e., most of the examples are positive, otherwise, it’s an
anomaly detection problem only
≫ Choosing what features to use:
We plot the data and the histogram looks like :
We’d be happy to see this as this means that the feature x is a
gaussian feature
13. But: if the histogram looks like:
This is a non gaussian distribution
So, we use different transforms on our data to make it as close as
possible to a gaussian distribution:
➔ These are feature v/s P( x )
We can use different transforms for different features to make
them gaussian features:
We may have to try out different transforms for the same feature
to find the best (which gives the best gaussian look to the data).
14. These parameters in the red are parameters we can vary to make
the data look more and more Gaussian.
≫ Coming up with features:
Error analysis method:
15. If there is an anomalous example in middle of some non-anomalous
examples, then the algo will fail.
➢So, we can look at that particular example and try to come up
with a new feature that can tell what went wrong with that
example
Example:
16. It may occur that if one of the computers is stuck in an infinite loop,
the CPU load grows but the network traffic doesn’t:
Then we can come up with a new feature:
OR
≫ MULTIVARIATE GAUSSIAN DISTRIBUTION:
17. Here, red points are training data
Green point is our test data
➢Lets look at both features individually:
The algo will not predict the right o/p … since the i/p data is
distributed on the whole axis, so all the points have some
probability of being correct.
25. ≫ Relationship of multivariate Gaussian Model with
Original Gaussian Model:
Original gaussian model is actually a special case of multivariate
model, in which, the contours have their axes aligned with the
features axes, i.e., the contours are not at nay angles:
Original model is mathematically the multivariate model with a
constraint, that is:
26. ≫ WHEN TO USE ORIGINAL MODEL vs MULTIVARIATE MODEL:
➢In some cases, in original model, we may require to manually
create extra features, so that the model can work fine.
➢In case of multivariate model, its important to get rid of
redundant features, o/w the algo is very expensive, and Σ may
even be non-invertible
…………………………………………………………………………………………………………
…………………………………………………………………………………………………………