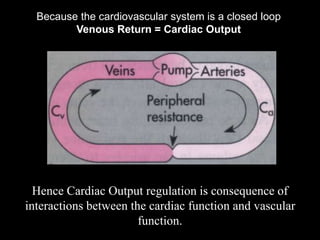
Downloaded 23 times
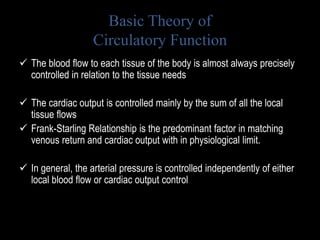
![Venous Return
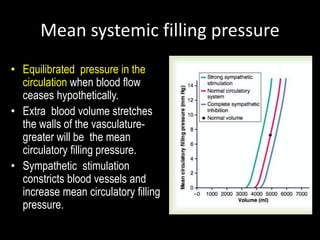
• Amount of blood returning to the heart per unit of time
through the great veins and coronary sinus. [equal to
Cardiac Output]
• Principal determinants of venous return
• 1. Right atrial pressure, backward force to impede
flow of blood from veins into the right atrium.
2. Degree of filling of the systemic circulation [mean
systemic filling pressure]), which forces the systemic
blood toward the heart
• 3. Resistance to blood flow between the peripheral
vessels and the right atrium.](https://image.slidesharecdn.com/12-221221041705-04b20b40/85/12-Cardiac-Output-Venous-Return-ppt-8-320.jpg)
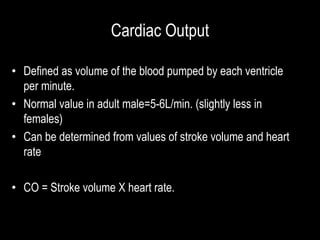
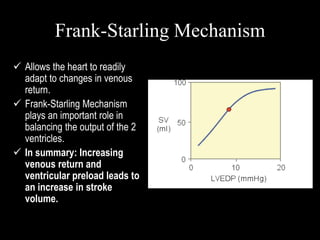
![Frank-Starling Mechanism
• Frank starling law: within physiological limit force of contraction
is directly proportional to initial length of muscle fiber.
• Ventricular muscle is complaint -130 ml but in cardiomyopathies.
Pericardial effusion , cardiac tampnode…?
• Simply stated: Heart pumps the blood that is returned to it
• Increased venous return causes
– increase in ventricular filling increases [Increased preload]
– Stretching of the myocytes causes an increase in force generation,
– heart to eject the additional venous return
• increase stroke volume.](https://image.slidesharecdn.com/12-221221041705-04b20b40/85/12-Cardiac-Output-Venous-Return-ppt-25-320.jpg)
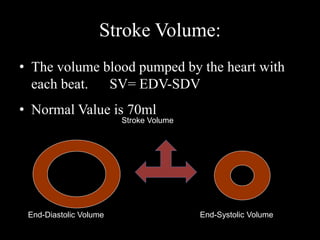
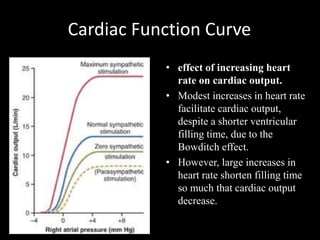
![Contractility
• Also called as Inotropy.
• Inherent property of the
myocardium to contract
independently of changes
in afterload or preload.
• Decrease in contractility
causes decrease in SV but
increase LVEDP [B]
• Increase in contractility
results in increase SV and
decrease in LVEDP [C]](https://image.slidesharecdn.com/12-221221041705-04b20b40/85/12-Cardiac-Output-Venous-Return-ppt-31-320.jpg)

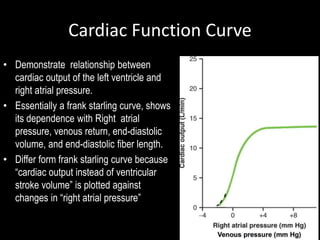
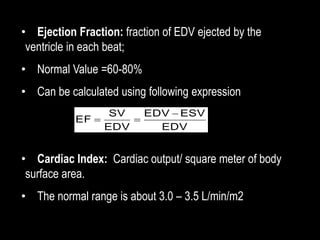
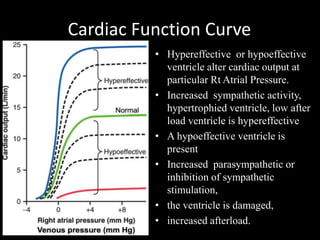
![Cardiac Function Curve
• When right atrial pressure is
below 0, cardiac output is 0, [too
little blood in the cardiac
chambers to generate pressure
during systole].
• When right atrial pressure
increases above +4 mm Hg,
cardiac output is maximum.
[maximal filling of the ventricle].](https://image.slidesharecdn.com/12-221221041705-04b20b40/85/12-Cardiac-Output-Venous-Return-ppt-42-320.jpg)
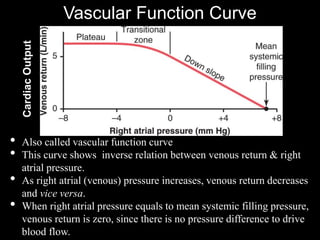
![Vascular Function Curve
• Take home message: This relationship is determined by vascular
properties:
R (peripheral resistance), arterial compliance[Ca ] and Venous
Compliance [Cv] and and Mean systemic filling Pressure [Psf.]
Cardiac
Output](https://image.slidesharecdn.com/12-221221041705-04b20b40/85/12-Cardiac-Output-Venous-Return-ppt-47-320.jpg)
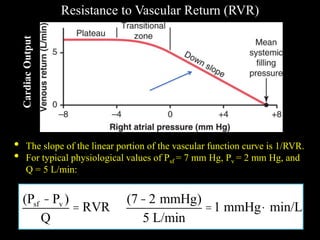
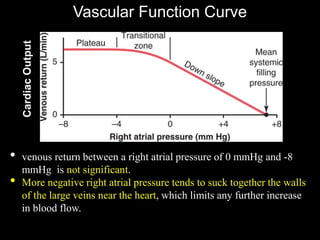
![Vascular Function Curve
Effects of Changes in Resistance to Vascular Return (RVR)
• As the resistance in vascular
bed increases, the slope
decreases.
• This means that a given
change in [right atrial] venous
pressure causes a change in
venous return.
• Maximal venous return is
when resistance is low.
Cardiac
Output](https://image.slidesharecdn.com/12-221221041705-04b20b40/85/12-Cardiac-Output-Venous-Return-ppt-49-320.jpg)
![• intercept at 0 mmHg right atrial
pressure [point A ] shows the
“normal” cardiac output and
venous return [near 5 L/min].
• If blood volume by increased by
20%, only vascular function
curve shifts to right and causes
• Psf increases to about 16 mm
Hg,
• right atrial pressure is at 7
mm Hg, and cardiac output is
~13 L/min.
Normal Cardiac Output & effect of increased
Blood Volume](https://image.slidesharecdn.com/12-221221041705-04b20b40/85/12-Cardiac-Output-Venous-Return-ppt-50-320.jpg)
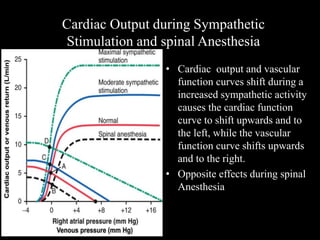
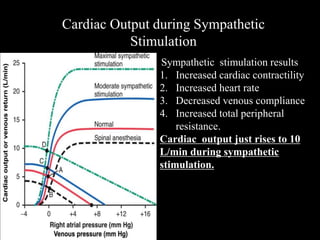
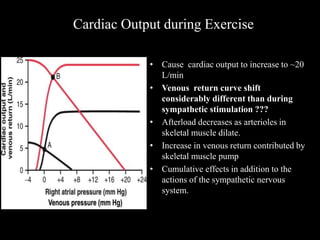

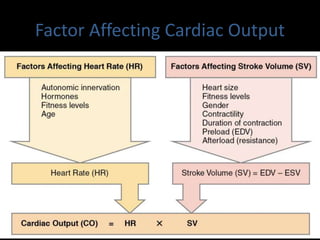
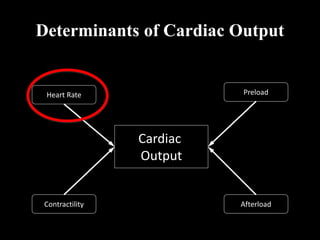
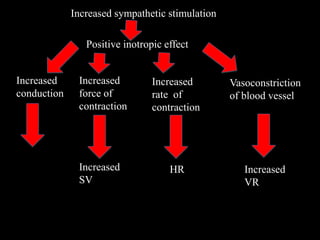
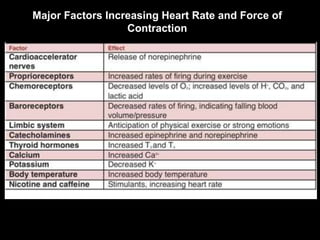
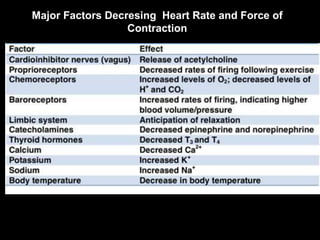
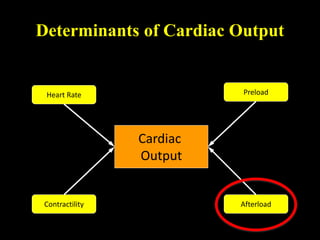
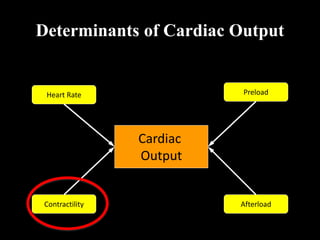
This document discusses cardiac output and its regulation. It defines key terms like stroke volume, heart rate, venous return, and cardiac index. It describes how cardiac output is determined by stroke volume and heart rate. It explains factors that affect preload, afterload, contractility, and the Frank-Starling mechanism. It discusses the cardiac function curve and vascular function curve in regulating cardiac output through interactions between the heart and vasculature. It also addresses how cardiac output changes with exercise, sympathetic stimulation, and other physiological conditions.


