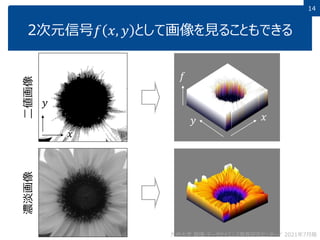
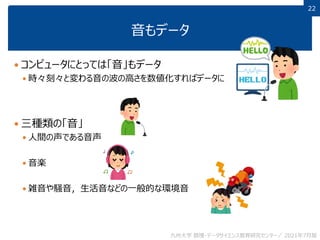
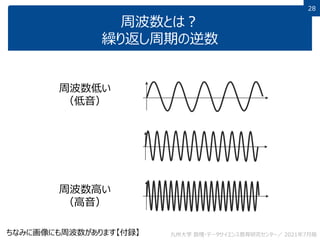
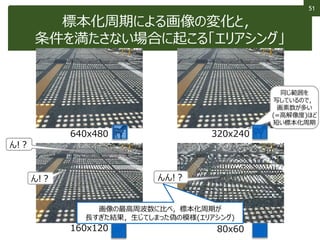
This document discusses non-structured data analysis, focusing on image data. It defines structured and non-structured data, with images, text, and audio given as examples of non-structured data. Images are described as high-dimensional vectors that are generated from analog to digital conversion via sampling and quantization. Various types of image data and analysis tasks are introduced, including image recognition, computer vision, feature extraction and image compression. Image processing techniques like filtering and binarization are also briefly covered.


![17
17
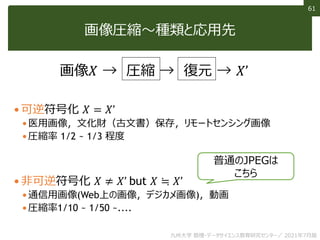
画像認識
そこに写っているものは何かを当てる
[He+ Delving Deep into Rectifiers: Surpassing Human-Level Performance on ImageNet Classification, ArXiv, 2015]
正解→
認識結果
(上位5位)](https://image.slidesharecdn.com/12-210821073950/85/12-17-320.jpg)


![107
107
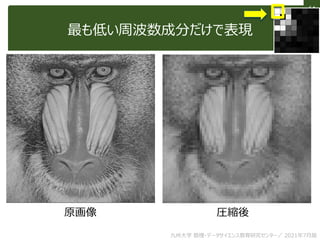
非線形フィルタ:バイラテラルフィルタ
エッジは保存しながら細かい変化を平滑化
小じわが見えにくく?
[Tomasi+, ICCV1998]
九州大学 数理・データサイエンス教育研究センター/ 2021年7月版](https://image.slidesharecdn.com/12-210821073950/85/12-107-320.jpg)


![120
120
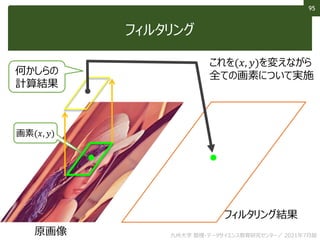
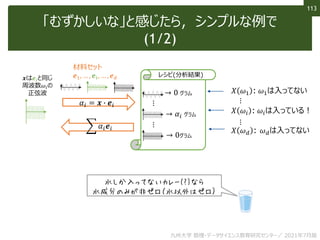
単語のデータ化 (1/2)
これを最近は「単語埋め込み」により意味ベクトル化する
𝑋apple ~𝑋orange (似てるものは似た特徴ベクトルに!)
• 基本アイディア(分散仮説)=文章の同じ位置に入りうる単語は似たベクトルに
• Ex. “I like [ ] for breakfast.” のように,appleやorangeを
入れることができる文章が多い → appleとorangeは似た意味ベクトルに
𝑋king − 𝑋man +𝑋woman = 𝑋queen なんて計算もできる
𝑋apple = 𝑓 𝑥apple
1-hotを意味に変換する関数𝑓
この𝑓はたくさんの文章例と
機械学習で創り出す
九州大学 数理・データサイエンス教育研究センター/ 2021年7月版](https://image.slidesharecdn.com/12-210821073950/85/12-120-320.jpg)


![SSII2020 [OS2-02] 教師あり事前学習を凌駕する「弱」教師あり事前学習](https://cdn.slidesharecdn.com/ss_thumbnails/200611ssii2020os2weaksupervision-200609142553-thumbnail.jpg?width=640&height=640&fit=bounds)


![[DL輪読会]End-to-End Object Detection with Transformers](https://cdn.slidesharecdn.com/ss_thumbnails/200529dlseminardetr-200529061512-thumbnail.jpg?width=640&height=640&fit=bounds)


