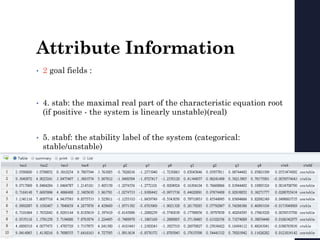
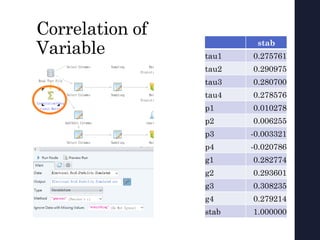
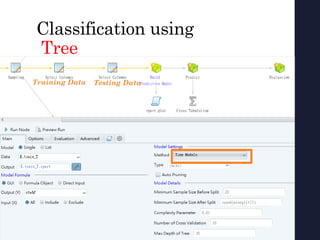
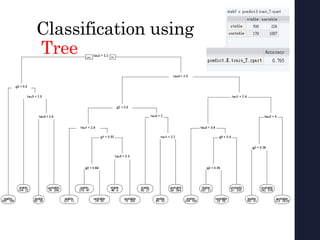
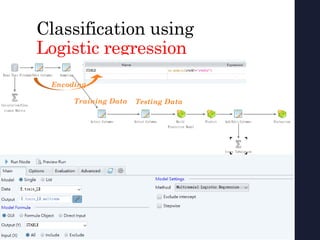
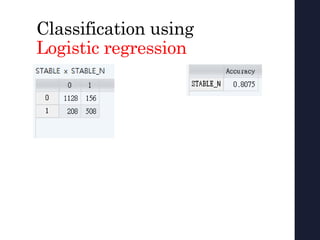
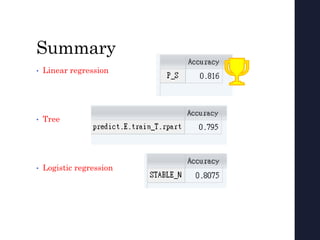
This document summarizes an electrical grid stability dataset from UCI. It describes 11 predictive attributes like reaction time and power consumed/produced for electricity producers and participants. The goals are stability, a value measuring system instability, and a stability label (stable/unstable). Correlations between attributes and stability are provided. The document also references a related paper on decentralized smart grid control that aims to stabilize the power system through distributed generation and price-based incentives for consumers.


![Data Set Information
• From UCI
• http://archive.ics.uci.edu/ml/datasets/Electrical+Grid+Stability+
Simulated+Data+#
• The analysis is performed for different sets of input values
using the methodology similar to that described in
• [Schà ¤fer, Benjamin, et al. 'Taming instabilities in power grid
networks by decentralized control.' The European Physical
Journal Special Topics 225.3 (2016): 569-582.].](https://image.slidesharecdn.com/10766012ranalitics-190530183918/85/10766012-ranalitics-2-320.jpg)
![Attribute Information
• 11 predictive attributes, 1 non-predictive(p1) :
• 1. tau[x]: reaction time of
Tau1 - the value for electricity producer.
• 2. p[x]: nominal power consumed(negative)/produced(positive)
p1 = abs(p2 + p3 + p4)
• 3. g[x]: coefficient (gamma) proportional to price elasticity
g1 - the value for electricity producer.](https://image.slidesharecdn.com/10766012ranalitics-190530183918/85/10766012-ranalitics-3-320.jpg)