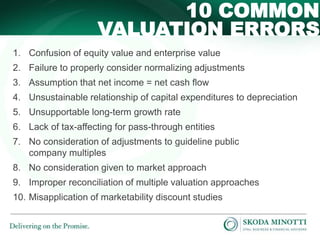
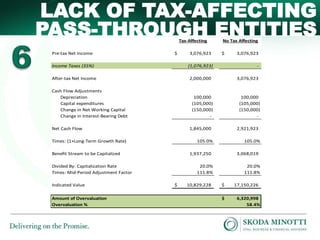
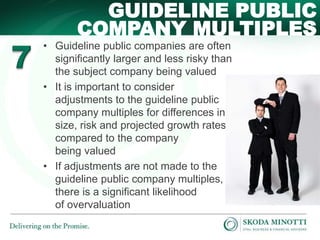
10 Common Errors in Valuations 
And How to Effectively Cross-Examine These Issues 
Sean Saari, CPA/ABV, CVA, MBA 
Robert A. Ranallo, CPA/ABV, CVA, CFF, JD 
October 16, 2014
LEARNING OBJECTIVES 
After completing the session, participants 
will be able to… 
• Identify 10 common errors in valuations 
• Understand how to correctly approach 
the 10 common errors in valuations 
• Effectively cross-examine opposing 
experts on 10 common errors in 
valuations 
“In the long run, men hit only what they aim at.” – Henry David Thoreau
QUOTE OF THE DAY 
“There is no such thing as an absolute 
value in this world. You can only estimate 
what a thing is worth to you.” 
Charles Dudley Warner 1829-1900, American Writer
A QUICK PRIMER 
ON VALUATION 
There are three valuation approaches that are required to 
be considered in every valuation analysis, each with its own 
commonly-used valuation methodologies 
• Asset approach 
 Adjusted Net Asset Method 
• Income approach 
 Capitalization of Cash 
Flow/Earnings Method 
 Discounted Cash Flow Method 
• Market approach 
 Guideline Transaction Method 
 Guideline Public Company Method
10 COMMON 
VALUATION ERRORS 
1. Confusion of equity value and enterprise value 
2. Failure to properly consider normalizing adjustments 
3. Assumption that net income = net cash flow 
4. Unsustainable relationship of capital expenditures to depreciation 
5. Unsupportable long-term growth rate 
6. Lack of tax-affecting for pass-through entities 
7. No consideration of adjustments to guideline public 
company multiples 
8. No consideration given to market approach 
9. Improper reconciliation of multiple valuation approaches 
10. Misapplication of marketability discount studies
CONFUSING EQUITY VALUE 
WITH ENTERPRISE VALUE 
Equity Value = Value of Equity Ownership 
Enterprise Value = Equity Value + Debt – Cash 
Equity Value = Enterprise Value – Debt + Cash 
• If the income or market approach applied uses a 
benefit stream to determine value that is before 
interest expense (EBIT, EBITDA, Revenue, etc.), it will 
result in an enterprise value, not an equity value 
• The market approach is often based on enterprise 
values expressed as a multiple of EBITDA or revenue, 
so adjustments to the enterprise value to reach an 
equity value are required 
• Misinterpreting an enterprise value as an equity value 
will result in an inflated value
CONFUSING EQUITY VALUE 
WITH ENTERPRISE VALUE 
How the Value of Your Home is an 
Furnishings 
House 
Value 
Debt 
Value 
Equity 
Value 
Total Value 
of Home 
and 
Furnishings 
Enterprise Value
CONFUSING EQUITY VALUE 
WITH ENTERPRISE VALUE 
Reconciling Equity Value to Enterprise Value 
Cash 
Enterprise 
Value 
Debt 
Value 
Equity 
Value 
Market 
Value of 
Invested 
Capital
NOT CONSIDERING 
NORMALIZING ADJUSTMENTS 
• Normalizing adjustments are made to a company’s 
historical income statements for non-recurring or 
discretionary items in order to reflect the true 
underlying economics of the business 
• Common normalizing adjustments include 
 Officer compensation (over or undercompensation) 
 Personal/discretionary expenses 
 Related-party transactions at amounts other than FMV 
 Non-operating income or expenses 
 Non-recurring income or expenses 
• Determining normalizing adjustments requires 
professional judgment. Failure to properly consider 
normalizing adjustments can lead to the over or 
undervaluation of a company
NET INCOME =/= 
NET CASH FLOW 
• Capitalization/discounting of net income instead of net 
cash flow can lead to overvaluation 
• Capitalization/discount rates are for net cash flow, not 
net income 
• Net income does not consider the impact of: 
 Capital expenditures 
 Changes in net working capital 
 Changes in interest-bearing debt
NET INCOME =/= 
NET CASH FLOW 
Net Income Net Cash Flow 
After-tax Net Income $ 2,000,000 $ 2,000,000 
Cash Flow Adjustments 
Depreciation - 100,000 
Capital expenditures - (105,000) 
Change in Net Working Capital - (150,000) 
Change in Interest-Bearing Debt - - 
Net Cash Flow 2,000,000 1,845,000 
Times: (1+Long-Term Growth Rate) 105.0% 105.0% 
Benefit Stream to be Capitalized 2,100,000 1,937,250 
Divided By: Capitalization Rate 20.0% 20.0% 
Times: Mid-Period Adjustment Factor 111.8% 111.8% 
Indicated Value $ 11,739,000 $ 10,829,228 
Amount of Overvaluation $ 909,772 
Overvaluation % 8.4%
CAPITAL EXPENDITURES & 
DEPRECIATION 
• In a capitalization of cash flow analysis, or in the 
terminal year of a discounted cash flow analysis, 
projected capital expenditures and depreciation 
expense should directly correlate 
• In many cases, capital expenditures are projected to 
exceed depreciation by the long-term growth rate 
• When there is not a supportable relationship between 
capital expenditures and depreciation expense, it will 
result in overvaluation or undervaluation
CAPITAL EXPENDITURES & 
DEPRECIATION 
Reasonable Excess Excess 
Relationship Depreciation CapEx 
After-tax Net Income $ 2,000,000 $ 2,000,000 $ 2,000,000 
Cash Flow Adjustments 
Depreciation 100,000 300,000 100,000 
Capital expenditures (105,000) (105,000) (300,000) 
Change in Net Working Capital (150,000) (150,000) (150,000) 
Change in Interest-Bearing Debt - - - 
Net Cash Flow 1,845,000 2,045,000 1,650,000 
Times: (1+Long-Term Growth Rate) 105.0% 105.0% 105.0% 
Benefit Stream to be Capitalized 1,937,250 2,147,250 1,732,500 
Divided By: Capitalization Rate 20.0% 20.0% 20.0% 
Times: Mid-Period Adjustment Factor 111.8% 111.8% 111.8% 
Indicated Value $ 10,829,228 $ 12,003,128 $ 9,684,675 
Amount of Overvaluation (Undervaluation) $ 1,173,900 $ (1,144,553) 
Overvaluation (Undervaluation) % 10.8% (10.6%)
UNSUPPORTABLE 
LONG-TERM GROWTH RATE 
• The long-term growth rate used in the 
income approach can have a material 
impact on value 
• Long-term growth rates typically 
should not exceed 5%-6% 
 2%-3% Inflation 
 2%-3% Real GDP growth 
• Long-term growth rates in excess of 
5%-6% imply that the company will 
actually grow to be larger than the 
economy as a whole into perpetuity, 
which is not supportable and results 
in overvaluation
UNSUPPORTABLE 
LONG-TERM GROWTH RATE 
Reasonable Inflated 
Growth Rate Growth Rate 
After-tax Net Income $ 2,000,000 $ 2,000,000 
Cash Flow Adjustments 
Depreciation 100,000 100,000 
Capital expenditures (105,000) (105,000) 
Change in Net Working Capital (150,000) (150,000) 
Change in Interest-Bearing Debt - - 
Net Cash Flow 1,845,000 1,845,000 
Times: (1+Long-Term Growth Rate) 105.0% 110.0% 
Benefit Stream to be Capitalized 1,937,250 2,029,500 
Divided By: Capitalization Rate 20.0% 15.0% 
Times: Mid-Period Adjustment Factor 111.8% 111.8% 
Indicated Value $ 10,829,228 $ 15,126,540 
Amount of Overvaluation $ 4,297,312 
Overvaluation % 39.7%
LACK OF TAX-AFFECTING 
PASS-THROUGH ENTITIES 
• Although pass-through entities do not pay 
income taxes at the company level, income 
taxes are still levied on the company’s 
earnings, just at the owner level 
• The data used to support the discount rate 
utilized in the income approach is based on 
after-tax cash flow
LACK OF TAX-AFFECTING 
PASS-THROUGH ENTITIES 
• Typically, distributions are made to at least cover the 
owners’ flow-through tax liability, similar to a C 
corporation paying taxes at the entity level 
• If the impact of income taxes is not considered for 
flow-through entities, it will result in a 
significant overvaluation
LACK OF TAX-AFFECTING 
PASS-THROUGH ENTITIES 
Tax-Affecting No Tax Affecting 
Pre-tax Net Income $ 3,076,923 $ 3,076,923 
Income Taxes (35%) (1,076,923) - 
After-tax Net Income 2,000,000 3,076,923 
Cash Flow Adjustments 
Depreciation 100,000 100,000 
Capital expenditures (105,000) (105,000) 
Change in Net Working Capital (150,000) (150,000) 
Change in Interest-Bearing Debt - - 
Net Cash Flow 1,845,000 2,921,923 
Times: (1+Long-Term Growth Rate) 105.0% 105.0% 
Benefit Stream to be Capitalized 1,937,250 3,068,019 
Divided By: Capitalization Rate 20.0% 20.0% 
Times: Mid-Period Adjustment Factor 111.8% 111.8% 
Indicated Value $ 10,829,228 $ 17,150,226 
Amount of Overvaluation $ 6,320,998 
Overvaluation % 58.4%
GUIDELINE PUBLIC 
COMPANY MULTIPLES 
• Guideline public companies are often 
significantly larger and less risky than 
the subject company being valued 
• It is important to consider 
adjustments to the guideline public 
company multiples for differences in 
size, risk and projected growth rates 
compared to the company 
being valued 
• If adjustments are not made to the 
guideline public company multiples, 
there is a significant likelihood 
of overvaluation
NOT CONSIDERING 
MARKET APPROACH 
• Within the market approach there are two methods 
that are typically used 
 Guideline transaction method 
 Guideline public company method 
• Valuation analysts frequently indicate that the 
market approach is not applicable in an engagement 
for a handful of reasons 
 “Too few comparable transactions/public companies” 
 “The transactions/public companies identified in the 
industry are not comparable to the company being valued” 
‒ “The guideline public companies are too large compared to 
the company being valued”
NOT CONSIDERING 
MARKET APPROACH 
• Some valuation analysts do not use the market approach 
because they do not know how to apply the approach or 
do not have access to the requisite data (it can be 
expensive for subscriptions to the necessary databases) 
• In many cases the market approach can be applied, even 
if it is simply as a cross-check if the available data is 
not robust 
• If the market approach is not applied, there is no check 
on the income approach value, so it leaves more 
opportunity for manipulation of the concluded value 
• Sometimes the market approach really cannot be 
applied, but this should be the exception rather than 
the rule
NOT CONSIDERING 
MARKET APPROACH 
Debunking excuses for not applying the market approach: 
• “Too few comparable transactions/public companies” 
 The following data sources are often relied upon to provide the 
data necessary to apply the market approach 
‒ Pratt’s Stats 
‒ Mergerstat 
‒ Pitchbook 
‒ Capital IQ 
‒ Fetch XL 
 We have been involved in engagements in which opposing 
experts say that there are no comparable transactions, but we 
found in excess of 50 transactions to use in the market approach
NOT CONSIDERING 
MARKET APPROACH 
Debunking excuses for not applying the market approach: 
• “The transactions/public companies identified in the 
industry are not comparable to the company 
being valued.” 
 There is no “exact” comp; the market approach calls for an 
analysis of multiples for the industry in general 
• “The guideline public companies are too large compared 
to the company being valued” 
 Guideline public company multiples can be adjusted for 
differences in size and risk compared to the company being 
valued (see #7)
IMPROPERLY RECONCILING 
VALUATION APPROACHES 
• Value conclusions are typically more 
supportable when the values 
indicated by both the income and 
market approach are consistent 
• It is typically not appropriate to give 
any weight to an asset approach 
value if both the income and market 
approaches are higher 
• Giving weight to the asset approach 
when the income and market 
approach values are both higher will 
result in undervaluation 
• The reconciliation process requires 
professional judgment
IMPROPERLY RECONCILING 
VALUATION APPROACHES 
Inclusion of Asset Approach in Weighting 
Adjusted Capitalization of Guideline Guideline Public 
Net Asset Method Cash Flow Method Transaction Method Company Method 
Value of the Company's Equity $ 5,000,000 $ 55,000,000 $ 45,000,000 $ 60,000,000 
Weighting 25.0% 25.0% 25.0% 25.0% 
Weighted-Average Value of the Company's Equity $ 41,250,000 
Exclusion of Asset Approach in Weighting 
Adjusted Capitalization of Guideline Guideline Public 
Net Asset Method Cash Flow Method Transaction Method Company Method 
Value of the Company's Equity $ 5,000,000 $ 55,000,000 $ 45,000,000 $ 60,000,000 
Weighting 0.0% 50.0% 25.0% 25.0% 
Weighted-Average Value of the Company's Equity $ 53,750,000 
Inclusion vs. Exclusion of Asset Approach Value Comparison 
Indicated Value (Including Asset Approach Weighting) $ 41,250,000 
Indicated Value (Excluding Asset Approach Weighting) 53,750,000 
Amount of Undervaluation $ (12,500,000) 
Undervaluation % (23.3%)
MISAPPLIED MARKETABILITY 
DISCOUNT STUDIES 
• Restricted stock and pre-IPO studies are 
often used to support lack of marketability 
discounts for non-controlling, non-marketable 
ownership interests 
• The level of control impacts the applicable 
lack of marketability discount 
• Using the restricted stock and pre-IPO 
studies to support a marketability discount 
for a controlling ownership interest is 
inappropriate/unsupportable and will result 
in an undervaluation of the 
ownership interest 
• If a lack of marketability discount is being 
applied to a controlling ownership interest, 
it is often supported by cost of 
flotation studies
SUMMING IT UP 
After completing the session, participants 
will be able to… 
• Identify 10 common errors in valuations 
• Understand how to correctly approach 
the 10 common errors in valuations 
• Effectively cross-examine opposing 
experts on 10 common errors in 
valuations
CLOSING QUOTE 
“It’s the little details that 
are vital. Little things 
make big things happen.” 
– John Wooden
QUESTIONS? 
Bob Ranallo, CPA/ABV, CVA, CFF, JD 
Partner 
Phone: 440-449-6800 x7131 
Email: branallo@skodaminotti.com 
Sean Saari, CPA/ABV, CVA, MBA 
Partner 
Phone: 440-449-6800 x7221 
Email: ssaari@skodaminotti.com

10 Common Errors in Valuation

  • 1.
    10 Common Errorsin Valuations And How to Effectively Cross-Examine These Issues Sean Saari, CPA/ABV, CVA, MBA Robert A. Ranallo, CPA/ABV, CVA, CFF, JD October 16, 2014
  • 2.
    LEARNING OBJECTIVES Aftercompleting the session, participants will be able to… • Identify 10 common errors in valuations • Understand how to correctly approach the 10 common errors in valuations • Effectively cross-examine opposing experts on 10 common errors in valuations “In the long run, men hit only what they aim at.” – Henry David Thoreau
  • 3.
    QUOTE OF THEDAY “There is no such thing as an absolute value in this world. You can only estimate what a thing is worth to you.” Charles Dudley Warner 1829-1900, American Writer
  • 4.
    A QUICK PRIMER ON VALUATION There are three valuation approaches that are required to be considered in every valuation analysis, each with its own commonly-used valuation methodologies • Asset approach  Adjusted Net Asset Method • Income approach  Capitalization of Cash Flow/Earnings Method  Discounted Cash Flow Method • Market approach  Guideline Transaction Method  Guideline Public Company Method
  • 5.
    10 COMMON VALUATIONERRORS 1. Confusion of equity value and enterprise value 2. Failure to properly consider normalizing adjustments 3. Assumption that net income = net cash flow 4. Unsustainable relationship of capital expenditures to depreciation 5. Unsupportable long-term growth rate 6. Lack of tax-affecting for pass-through entities 7. No consideration of adjustments to guideline public company multiples 8. No consideration given to market approach 9. Improper reconciliation of multiple valuation approaches 10. Misapplication of marketability discount studies
  • 6.
    CONFUSING EQUITY VALUE WITH ENTERPRISE VALUE Equity Value = Value of Equity Ownership Enterprise Value = Equity Value + Debt – Cash Equity Value = Enterprise Value – Debt + Cash • If the income or market approach applied uses a benefit stream to determine value that is before interest expense (EBIT, EBITDA, Revenue, etc.), it will result in an enterprise value, not an equity value • The market approach is often based on enterprise values expressed as a multiple of EBITDA or revenue, so adjustments to the enterprise value to reach an equity value are required • Misinterpreting an enterprise value as an equity value will result in an inflated value
  • 7.
    CONFUSING EQUITY VALUE WITH ENTERPRISE VALUE How the Value of Your Home is an Furnishings House Value Debt Value Equity Value Total Value of Home and Furnishings Enterprise Value
  • 8.
    CONFUSING EQUITY VALUE WITH ENTERPRISE VALUE Reconciling Equity Value to Enterprise Value Cash Enterprise Value Debt Value Equity Value Market Value of Invested Capital
  • 9.
    NOT CONSIDERING NORMALIZINGADJUSTMENTS • Normalizing adjustments are made to a company’s historical income statements for non-recurring or discretionary items in order to reflect the true underlying economics of the business • Common normalizing adjustments include  Officer compensation (over or undercompensation)  Personal/discretionary expenses  Related-party transactions at amounts other than FMV  Non-operating income or expenses  Non-recurring income or expenses • Determining normalizing adjustments requires professional judgment. Failure to properly consider normalizing adjustments can lead to the over or undervaluation of a company
  • 10.
    NET INCOME =/= NET CASH FLOW • Capitalization/discounting of net income instead of net cash flow can lead to overvaluation • Capitalization/discount rates are for net cash flow, not net income • Net income does not consider the impact of:  Capital expenditures  Changes in net working capital  Changes in interest-bearing debt
  • 11.
    NET INCOME =/= NET CASH FLOW Net Income Net Cash Flow After-tax Net Income $ 2,000,000 $ 2,000,000 Cash Flow Adjustments Depreciation - 100,000 Capital expenditures - (105,000) Change in Net Working Capital - (150,000) Change in Interest-Bearing Debt - - Net Cash Flow 2,000,000 1,845,000 Times: (1+Long-Term Growth Rate) 105.0% 105.0% Benefit Stream to be Capitalized 2,100,000 1,937,250 Divided By: Capitalization Rate 20.0% 20.0% Times: Mid-Period Adjustment Factor 111.8% 111.8% Indicated Value $ 11,739,000 $ 10,829,228 Amount of Overvaluation $ 909,772 Overvaluation % 8.4%
  • 12.
    CAPITAL EXPENDITURES & DEPRECIATION • In a capitalization of cash flow analysis, or in the terminal year of a discounted cash flow analysis, projected capital expenditures and depreciation expense should directly correlate • In many cases, capital expenditures are projected to exceed depreciation by the long-term growth rate • When there is not a supportable relationship between capital expenditures and depreciation expense, it will result in overvaluation or undervaluation
  • 13.
    CAPITAL EXPENDITURES & DEPRECIATION Reasonable Excess Excess Relationship Depreciation CapEx After-tax Net Income $ 2,000,000 $ 2,000,000 $ 2,000,000 Cash Flow Adjustments Depreciation 100,000 300,000 100,000 Capital expenditures (105,000) (105,000) (300,000) Change in Net Working Capital (150,000) (150,000) (150,000) Change in Interest-Bearing Debt - - - Net Cash Flow 1,845,000 2,045,000 1,650,000 Times: (1+Long-Term Growth Rate) 105.0% 105.0% 105.0% Benefit Stream to be Capitalized 1,937,250 2,147,250 1,732,500 Divided By: Capitalization Rate 20.0% 20.0% 20.0% Times: Mid-Period Adjustment Factor 111.8% 111.8% 111.8% Indicated Value $ 10,829,228 $ 12,003,128 $ 9,684,675 Amount of Overvaluation (Undervaluation) $ 1,173,900 $ (1,144,553) Overvaluation (Undervaluation) % 10.8% (10.6%)
  • 14.
    UNSUPPORTABLE LONG-TERM GROWTHRATE • The long-term growth rate used in the income approach can have a material impact on value • Long-term growth rates typically should not exceed 5%-6%  2%-3% Inflation  2%-3% Real GDP growth • Long-term growth rates in excess of 5%-6% imply that the company will actually grow to be larger than the economy as a whole into perpetuity, which is not supportable and results in overvaluation
  • 15.
    UNSUPPORTABLE LONG-TERM GROWTHRATE Reasonable Inflated Growth Rate Growth Rate After-tax Net Income $ 2,000,000 $ 2,000,000 Cash Flow Adjustments Depreciation 100,000 100,000 Capital expenditures (105,000) (105,000) Change in Net Working Capital (150,000) (150,000) Change in Interest-Bearing Debt - - Net Cash Flow 1,845,000 1,845,000 Times: (1+Long-Term Growth Rate) 105.0% 110.0% Benefit Stream to be Capitalized 1,937,250 2,029,500 Divided By: Capitalization Rate 20.0% 15.0% Times: Mid-Period Adjustment Factor 111.8% 111.8% Indicated Value $ 10,829,228 $ 15,126,540 Amount of Overvaluation $ 4,297,312 Overvaluation % 39.7%
  • 16.
    LACK OF TAX-AFFECTING PASS-THROUGH ENTITIES • Although pass-through entities do not pay income taxes at the company level, income taxes are still levied on the company’s earnings, just at the owner level • The data used to support the discount rate utilized in the income approach is based on after-tax cash flow
  • 17.
    LACK OF TAX-AFFECTING PASS-THROUGH ENTITIES • Typically, distributions are made to at least cover the owners’ flow-through tax liability, similar to a C corporation paying taxes at the entity level • If the impact of income taxes is not considered for flow-through entities, it will result in a significant overvaluation
  • 18.
    LACK OF TAX-AFFECTING PASS-THROUGH ENTITIES Tax-Affecting No Tax Affecting Pre-tax Net Income $ 3,076,923 $ 3,076,923 Income Taxes (35%) (1,076,923) - After-tax Net Income 2,000,000 3,076,923 Cash Flow Adjustments Depreciation 100,000 100,000 Capital expenditures (105,000) (105,000) Change in Net Working Capital (150,000) (150,000) Change in Interest-Bearing Debt - - Net Cash Flow 1,845,000 2,921,923 Times: (1+Long-Term Growth Rate) 105.0% 105.0% Benefit Stream to be Capitalized 1,937,250 3,068,019 Divided By: Capitalization Rate 20.0% 20.0% Times: Mid-Period Adjustment Factor 111.8% 111.8% Indicated Value $ 10,829,228 $ 17,150,226 Amount of Overvaluation $ 6,320,998 Overvaluation % 58.4%
  • 19.
    GUIDELINE PUBLIC COMPANYMULTIPLES • Guideline public companies are often significantly larger and less risky than the subject company being valued • It is important to consider adjustments to the guideline public company multiples for differences in size, risk and projected growth rates compared to the company being valued • If adjustments are not made to the guideline public company multiples, there is a significant likelihood of overvaluation
  • 20.
    NOT CONSIDERING MARKETAPPROACH • Within the market approach there are two methods that are typically used  Guideline transaction method  Guideline public company method • Valuation analysts frequently indicate that the market approach is not applicable in an engagement for a handful of reasons  “Too few comparable transactions/public companies”  “The transactions/public companies identified in the industry are not comparable to the company being valued” ‒ “The guideline public companies are too large compared to the company being valued”
  • 21.
    NOT CONSIDERING MARKETAPPROACH • Some valuation analysts do not use the market approach because they do not know how to apply the approach or do not have access to the requisite data (it can be expensive for subscriptions to the necessary databases) • In many cases the market approach can be applied, even if it is simply as a cross-check if the available data is not robust • If the market approach is not applied, there is no check on the income approach value, so it leaves more opportunity for manipulation of the concluded value • Sometimes the market approach really cannot be applied, but this should be the exception rather than the rule
  • 22.
    NOT CONSIDERING MARKETAPPROACH Debunking excuses for not applying the market approach: • “Too few comparable transactions/public companies”  The following data sources are often relied upon to provide the data necessary to apply the market approach ‒ Pratt’s Stats ‒ Mergerstat ‒ Pitchbook ‒ Capital IQ ‒ Fetch XL  We have been involved in engagements in which opposing experts say that there are no comparable transactions, but we found in excess of 50 transactions to use in the market approach
  • 23.
    NOT CONSIDERING MARKETAPPROACH Debunking excuses for not applying the market approach: • “The transactions/public companies identified in the industry are not comparable to the company being valued.”  There is no “exact” comp; the market approach calls for an analysis of multiples for the industry in general • “The guideline public companies are too large compared to the company being valued”  Guideline public company multiples can be adjusted for differences in size and risk compared to the company being valued (see #7)
  • 24.
    IMPROPERLY RECONCILING VALUATIONAPPROACHES • Value conclusions are typically more supportable when the values indicated by both the income and market approach are consistent • It is typically not appropriate to give any weight to an asset approach value if both the income and market approaches are higher • Giving weight to the asset approach when the income and market approach values are both higher will result in undervaluation • The reconciliation process requires professional judgment
  • 25.
    IMPROPERLY RECONCILING VALUATIONAPPROACHES Inclusion of Asset Approach in Weighting Adjusted Capitalization of Guideline Guideline Public Net Asset Method Cash Flow Method Transaction Method Company Method Value of the Company's Equity $ 5,000,000 $ 55,000,000 $ 45,000,000 $ 60,000,000 Weighting 25.0% 25.0% 25.0% 25.0% Weighted-Average Value of the Company's Equity $ 41,250,000 Exclusion of Asset Approach in Weighting Adjusted Capitalization of Guideline Guideline Public Net Asset Method Cash Flow Method Transaction Method Company Method Value of the Company's Equity $ 5,000,000 $ 55,000,000 $ 45,000,000 $ 60,000,000 Weighting 0.0% 50.0% 25.0% 25.0% Weighted-Average Value of the Company's Equity $ 53,750,000 Inclusion vs. Exclusion of Asset Approach Value Comparison Indicated Value (Including Asset Approach Weighting) $ 41,250,000 Indicated Value (Excluding Asset Approach Weighting) 53,750,000 Amount of Undervaluation $ (12,500,000) Undervaluation % (23.3%)
  • 26.
    MISAPPLIED MARKETABILITY DISCOUNTSTUDIES • Restricted stock and pre-IPO studies are often used to support lack of marketability discounts for non-controlling, non-marketable ownership interests • The level of control impacts the applicable lack of marketability discount • Using the restricted stock and pre-IPO studies to support a marketability discount for a controlling ownership interest is inappropriate/unsupportable and will result in an undervaluation of the ownership interest • If a lack of marketability discount is being applied to a controlling ownership interest, it is often supported by cost of flotation studies
  • 27.
    SUMMING IT UP After completing the session, participants will be able to… • Identify 10 common errors in valuations • Understand how to correctly approach the 10 common errors in valuations • Effectively cross-examine opposing experts on 10 common errors in valuations
  • 28.
    CLOSING QUOTE “It’sthe little details that are vital. Little things make big things happen.” – John Wooden
  • 29.
    QUESTIONS? Bob Ranallo,CPA/ABV, CVA, CFF, JD Partner Phone: 440-449-6800 x7131 Email: branallo@skodaminotti.com Sean Saari, CPA/ABV, CVA, MBA Partner Phone: 440-449-6800 x7221 Email: ssaari@skodaminotti.com

Editor's Notes

  • #5 We will discuss common errors associated with these three approaches, with most of the focus on the income and market-based approaches
  • #8 Use sale of home example Equity – Your equity in the home EV – Sale price of the home MVIC – Sale price of the home plus furniture included as separate purchase
  • #9 Use sale of home example Equity – Your equity in the home EV – Sale price of the home MVIC – Sale price of the home plus furniture included as separate purchase