Download as PDF, PPTX


![13
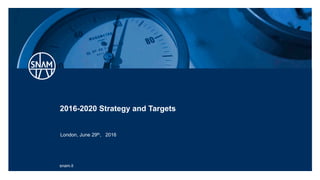
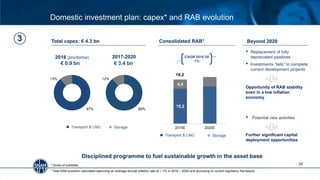
Italgas and Snam pro-forma financials
1 Net of revenues entered in accordance with IFRIC 12 (€ 321 m)
2 Gross of subsidies
3 Associates at equity RAB
Italgas (post demerger) 2015 pro-forma
consolidated key figures
[ €m]
Snam (post demerger) 2015 pro-forma
consolidated key figures
[ €m]
1 Does not include associates
2 Gross of subsidies
3 Includes international associates at acquisition cost and pro-quota Equity RAB of Italgas
RAB(€bn) 5.7
Revenues1 1,095
EBITDA 735
EBIT 462
Income from associates 29
Net profit 269
Capex2 393
Net debt 3,482
Net debt /RAB + associates3 59%
RAB1 €bn 19.2
Revenues 2,576
EBITDA 2,052
EBIT 1,476
Income from associates 142
Net profit 971
Capex2 879
Net debt 10,317
Net debt /RAB + associates3 49%](https://image.slidesharecdn.com/2016-2020strategyandtargets-160706131538/85/2016-2020-Strategy-Targets-13-320.jpg)
![14
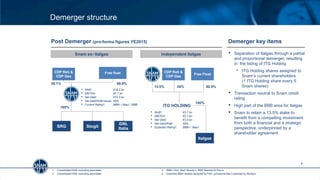
3.5 3.7
2.3
1.1
0.5
0.4
4.3
Net Debt 2015 pro-forma
(1)
Net Debt 2016E Total committed banking
facilities
Italgas expected debt structure after demerger
• Opportunity to optimize
the debt structure in
current market scenario
• Securing a very attractive
cost of debt
Increase due to distribution
of FY2015 dividends to
Snam before demerger
Italgas debt structure
1 debt at market value, including additional debt allocated to Italgas prior to the demerger (ca. €1.5 billion)
Bridge to Bond Revolving credit facilities
Bilateral term loan Institutional lenders financing
up to 2Y
3-5Y
3-5Y
~ 10Y
[ €bn, consolidated figures]](https://image.slidesharecdn.com/2016-2020strategyandtargets-160706131538/85/2016-2020-Strategy-Targets-14-320.jpg)


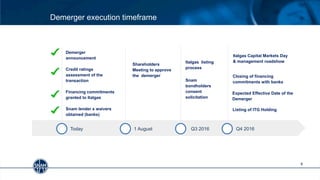
![0,00%
1,00%
2,00%
3,00%
4,00%
5,00%
6,00%
Jun-17 (1 bln € -
average 4y)
Mar-18 (1.2 bln € -
5.5y)
Jan -19 (0.85 bln € -
6.5y)
Apr-19 (0.5 bln € - 5y) Feb-20 (1.250 bln € -
averege 7y)
expiring bond potential new bond*
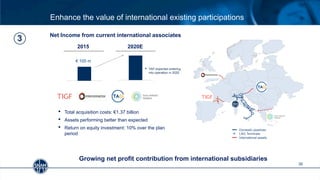
Debt structure post demerger and further costs optimization
34
Bonds Pool banking facilities
Bilateral banking facilities EIB financing
10.3
8.5
3.2
1.8
1.2
14.7
0
2
4
6
8
10
12
14
16
Net Debt 2015 (pro-forma) Total committed credit facilities
and bonds (pro-forma)
[ Coupon % ]
YE 2015 EIB financing
net of financing
transferred to Italgas
YE 2015 bonds net
of 2016 maturities
Upside from fixed rate bond roll-overSnam pro-forma 2015 Capital Structure
* Assuming a tenor in line with expiring bonds. Based on current Snam yield curve
Dynamic management of debt structure
• Financial markets with favorable interest rates and spreads
• Managing future refinancing exercises exploiting all potential
opportunities
• Treasury management optimization
• Resizing of banking lines and bond amount
5
Average >200
bps](https://image.slidesharecdn.com/2016-2020strategyandtargets-160706131538/85/2016-2020-Strategy-Targets-34-320.jpg)


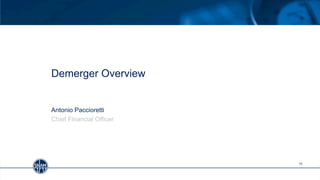
![Excellence in project execution
40
0
500
1,000
1,500
2010 2011 2012 2013 2014 2015
Budget Actual
1 Gross of subsidies
[ €m ]
Consistently delivering the budget
• More than € 8 bn invested in the last six years
• Mastering the whole value chain of complex gas
infrastructure projects (from permitting to
engineering, from construction to financing)
Proven track record and distinctive capabilities
Capex plans: first year spending¹
Top-tier competencies
2010/2015
• >1,000 active construction sites
annually
• Rights Away Permits: 18,047
obtained
• Environmental Impact
Assessments & Single
Authorization: 400 (99% obtained)
• Realization: 1,566 km of pipelines
• Environmental Restoration: 1,050
km executed without claims](https://image.slidesharecdn.com/2016-2020strategyandtargets-160706131538/85/2016-2020-Strategy-Targets-40-320.jpg)


Snam's 2016-2020 strategy document outlines plans to strengthen its leadership in the European gas market through three strategic pillars: 1) executing solid investment plans for its existing portfolio; 2) pursuing additional growth opportunities; and 3) maintaining stable and visible regulation. The document also details Italgas' strategic pillars following its demerger from Snam, which include driving consolidation in the Italian market through participation in distribution tenders and pursuing organic growth.


