Download to read offline

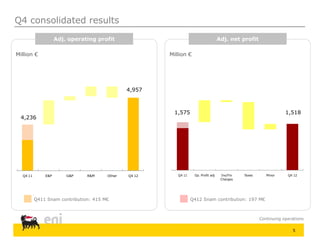
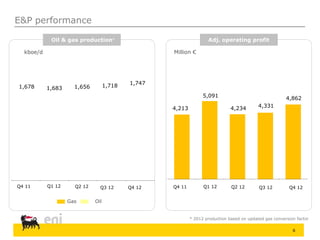
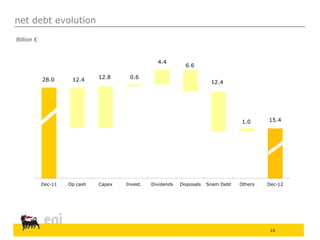
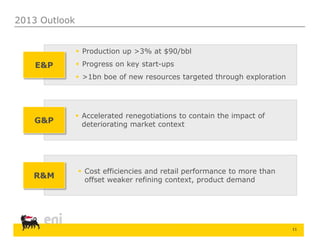

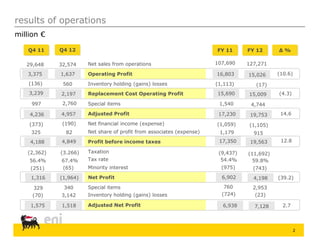
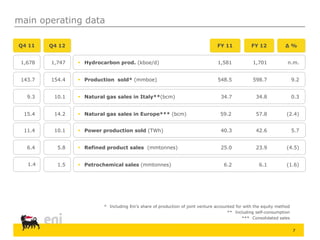
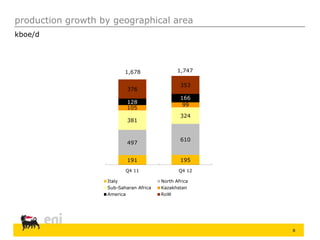
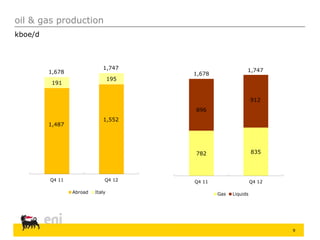
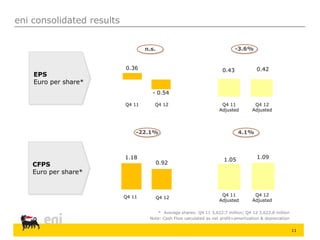

eni reported its 2012 fourth quarter and preliminary full year results. Some key points: - Production increased to 1.747 million boe/day in Q4 2012, up from 1.678 million boe/day in Q4 2011. - Adjusted net profit was €1.518 billion in Q4 2012, down slightly from €1.575 billion in Q4 2011. - Net debt was reduced by over €12 billion from end 2011 to end 2012 through asset sales and cash flow. - Production is forecast to increase over 3% in 2013 at $90 per barrel, with progress on key project start-ups.


