PART # 01
COURSEINSTRUCTOR:
DR. FARHEEN QAZI
DEPARTMENT OF SOFTWARE ENGINEERING
SIR SYED UNIVERSITY OF ENGINEERING & TECHNOLOGY
CHAPTER#04
UNSUPERVISED LEARNING & ITS ALGORITHMS
2.
TODAY’S AGENDA
UnsupervisedLearning
Cluster Analysis
Clustering Applications
What is good clustering?
Types of Clustering
K-Means Clustering Basic Algorithm
Advantages
Disadvantages
summary
3.
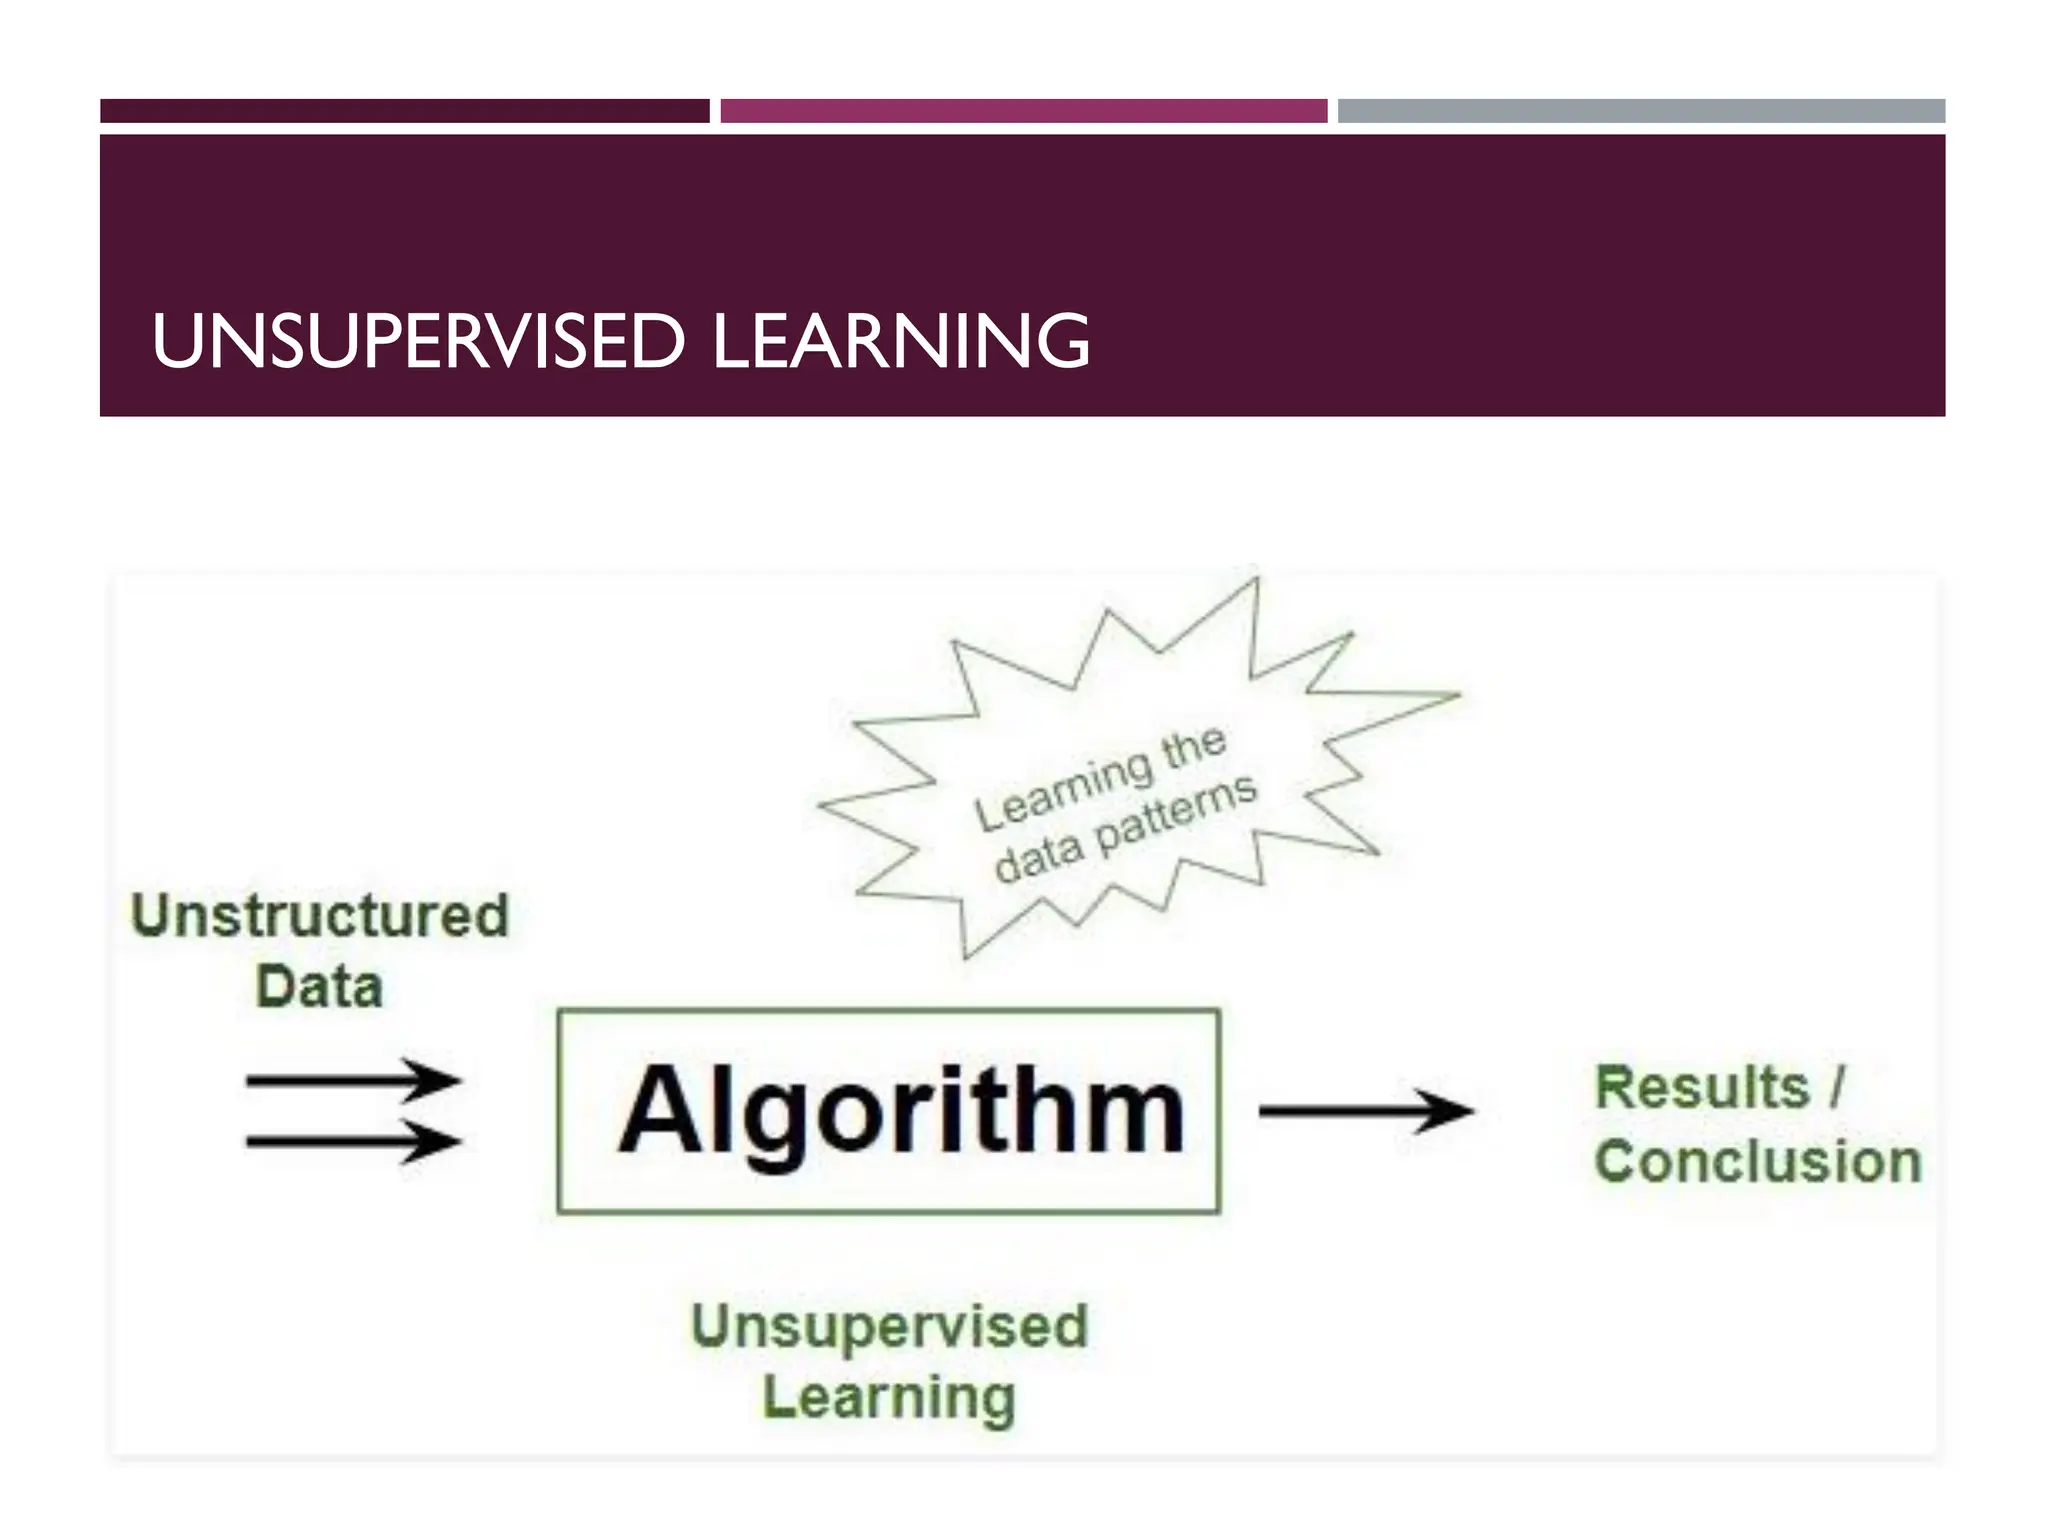
UNSUPERVISED LEARNING
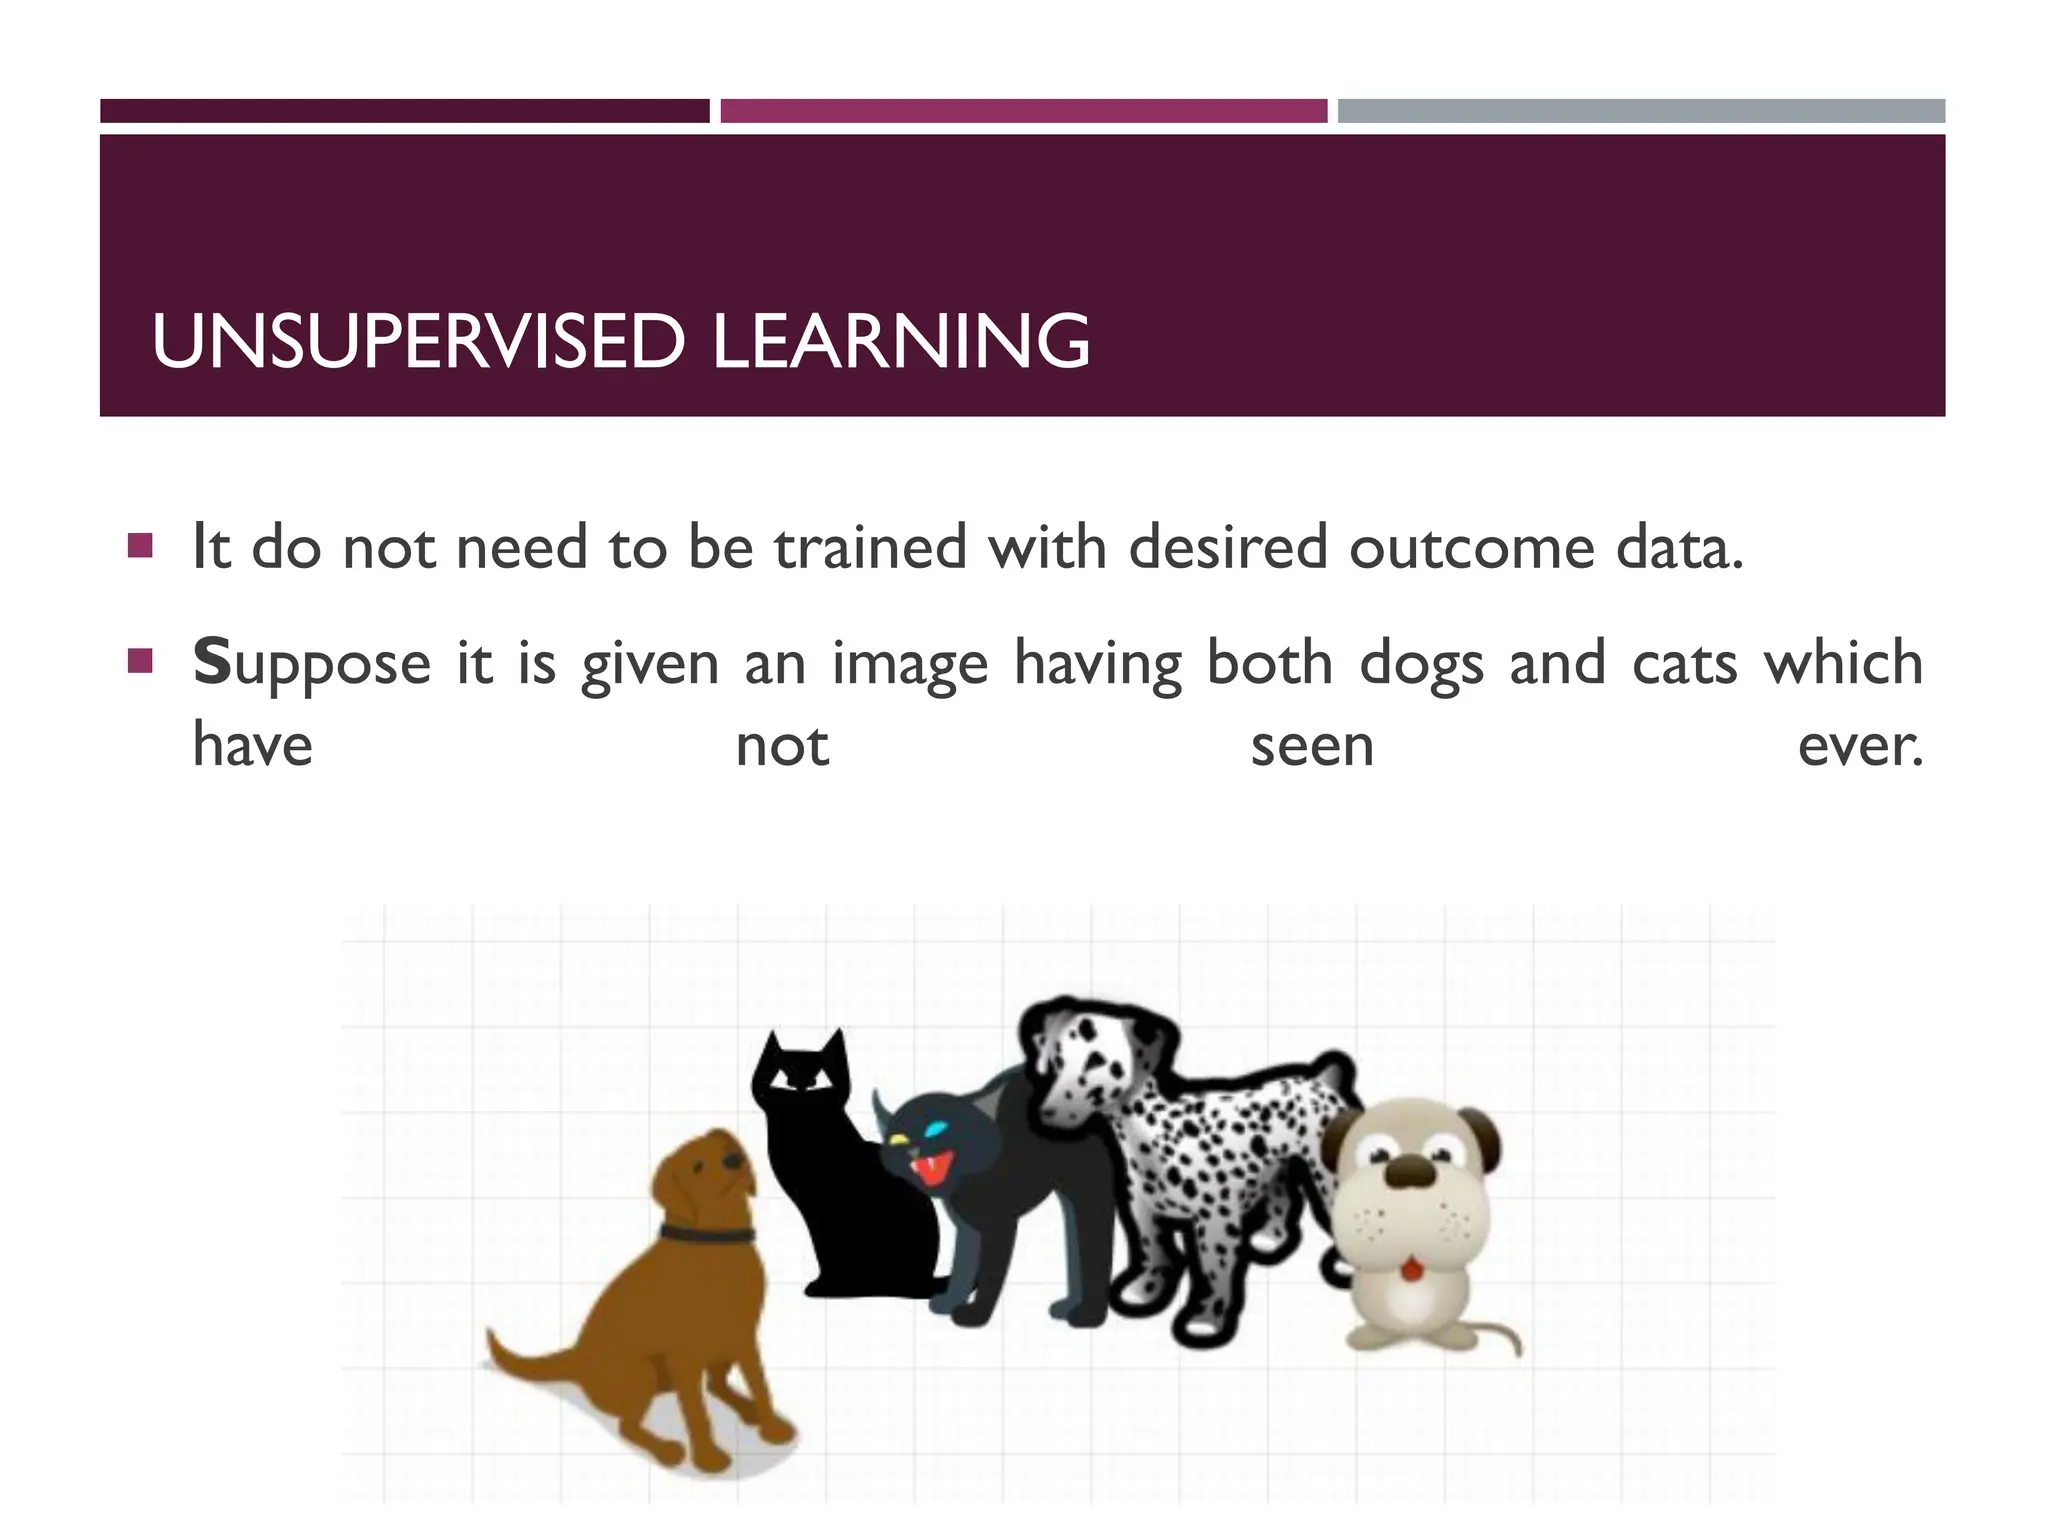
Itdo not need to be trained with desired outcome data.
Suppose it is given an image having both dogs and cats which
have not seen ever.
4.
UNSUPERVISED LEARNING
Thusmachine has no any idea about the features of dogs and
cat so we can’t categorize it in dogs and cats.
But it can categorize them according to their similarities,
patterns and differences i.e., we can easily categorize the above
picture into two parts.
First may contain all pics having dogs in it and second part may
contain all pics having cats in it.
Here you didn’t learn anything before, means no training data
or examples.
CLUSTER ANALYSIS
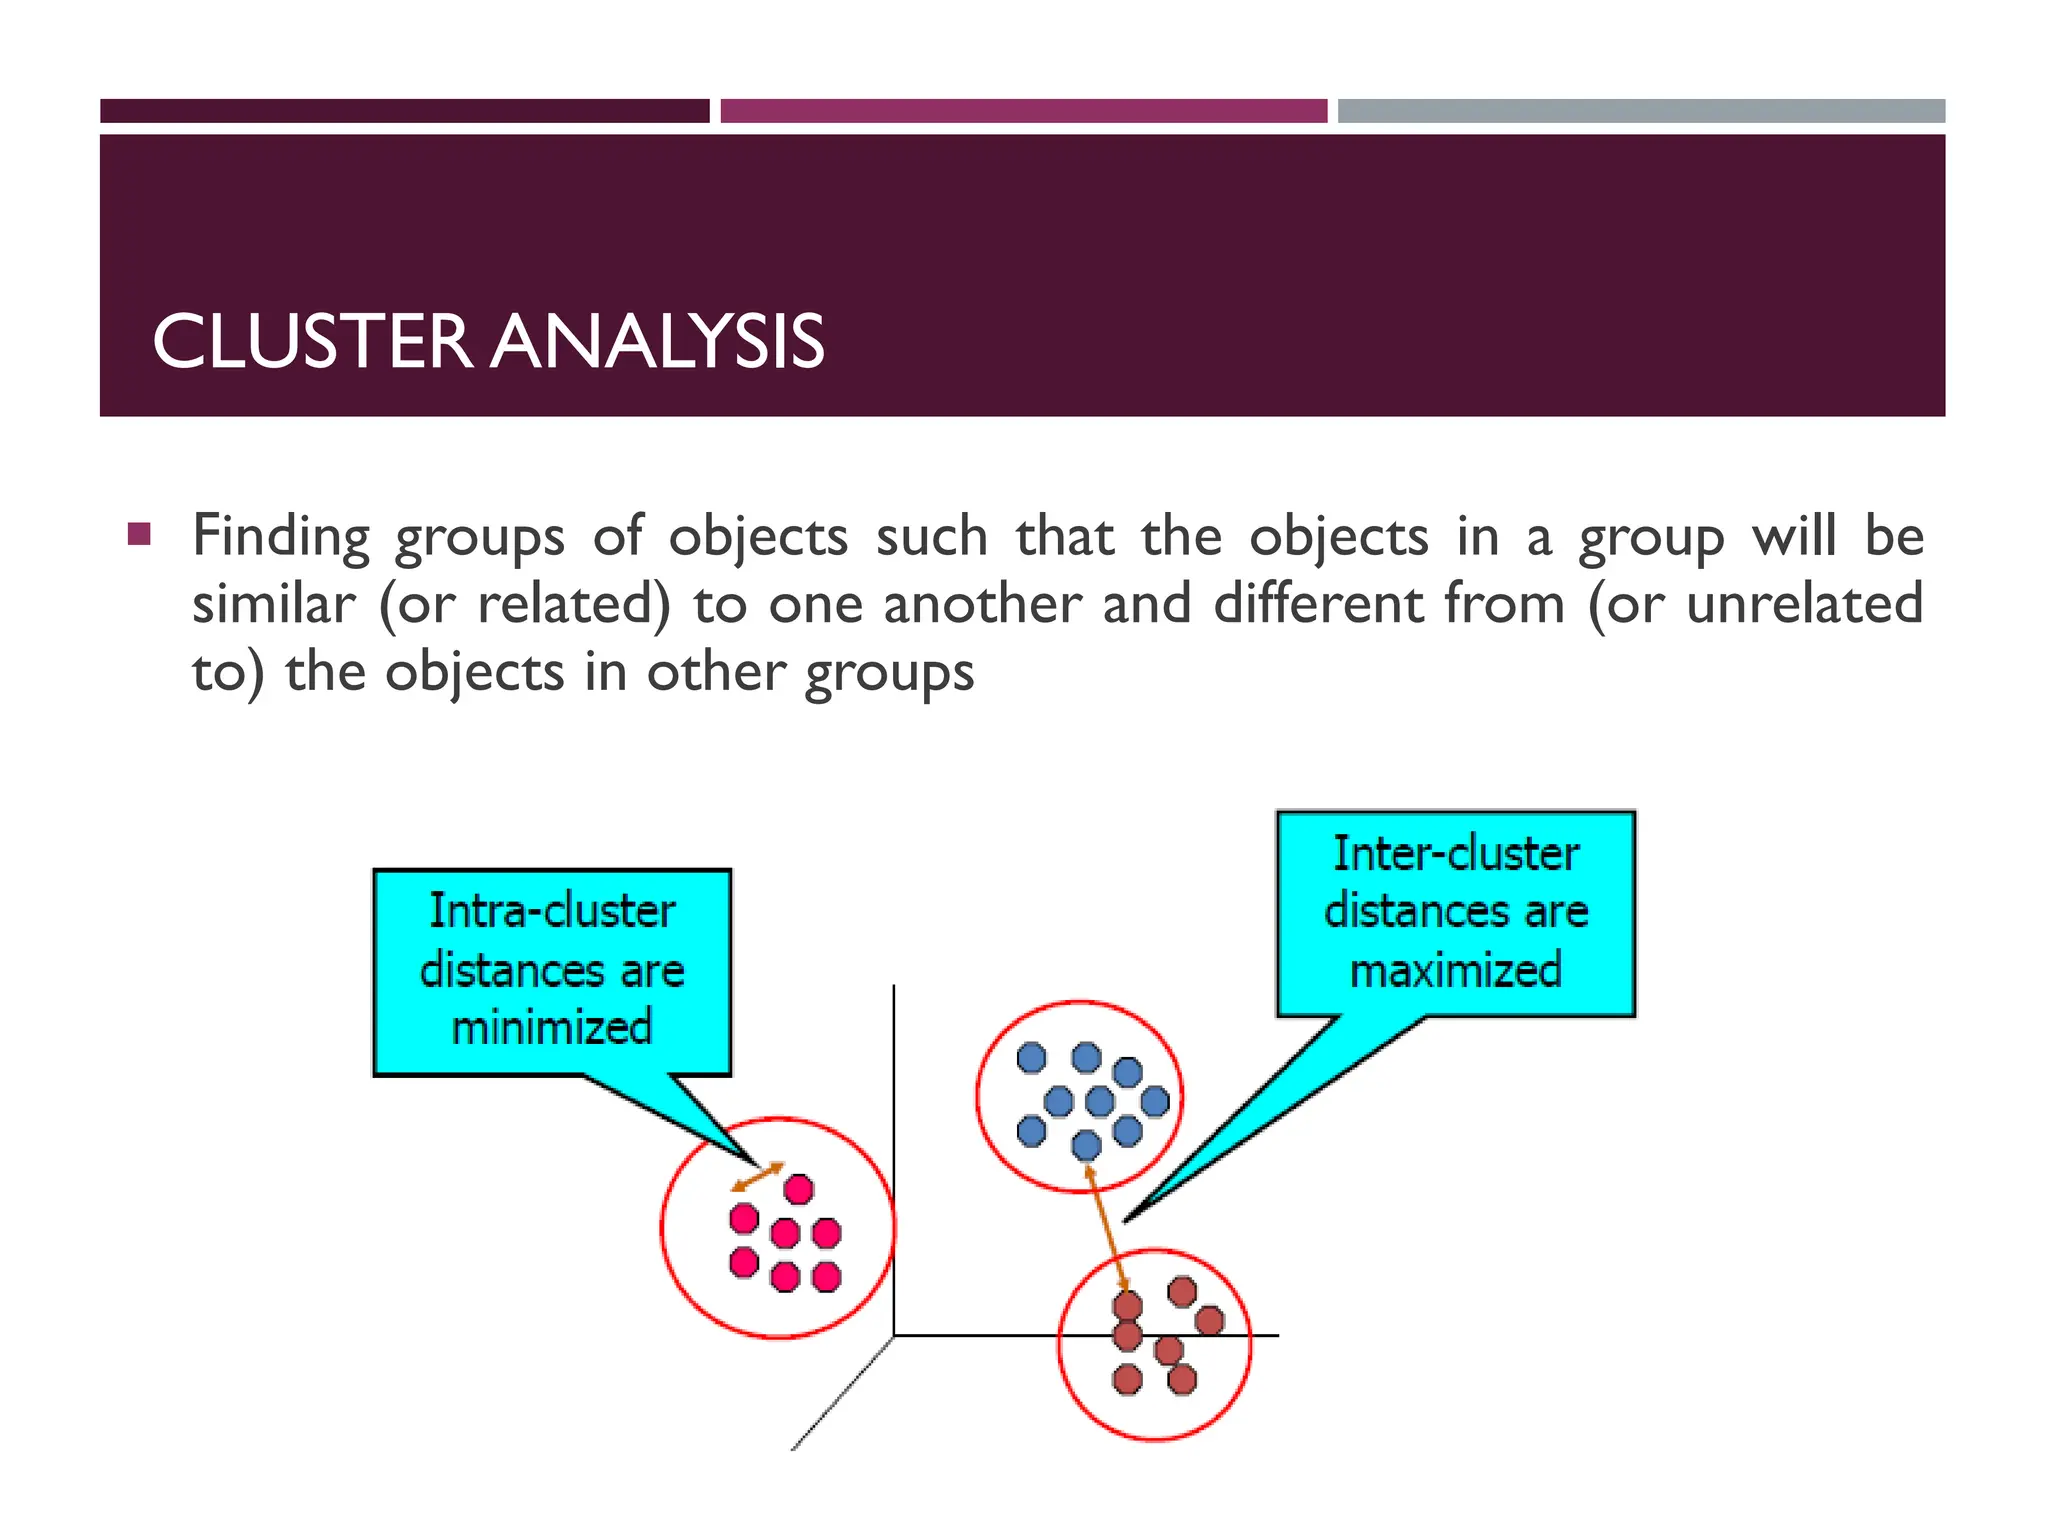
Findinggroups of objects such that the objects in a group will be
similar (or related) to one another and different from (or unrelated
to) the objects in other groups
7.
CLUSTER ANALYSIS
Cluster:a collection of data objects
o Similar to one another within the same cluster
o Dissimilar to the objects in other clusters
Cluster analysis
o Finding similarities between data according to the characteristics found
in the data and grouping similar data objects into clusters
Unsupervised learning: no predefined classes
Typical applications
o As a stand-alone tool to get insight into data distribution
o As a preprocessing step for other algorithms
QUALITY:WHAT IS GOODCLUSTERING?
A good clustering method will produce high quality clusters
with
o high intra-class similarity
o low inter-class similarity
The quality of a clustering result depends on both the
similarity measure used by the method and its implementation
The quality of a clustering method is also measured by its
ability to discover some or all of the hidden patterns
10.
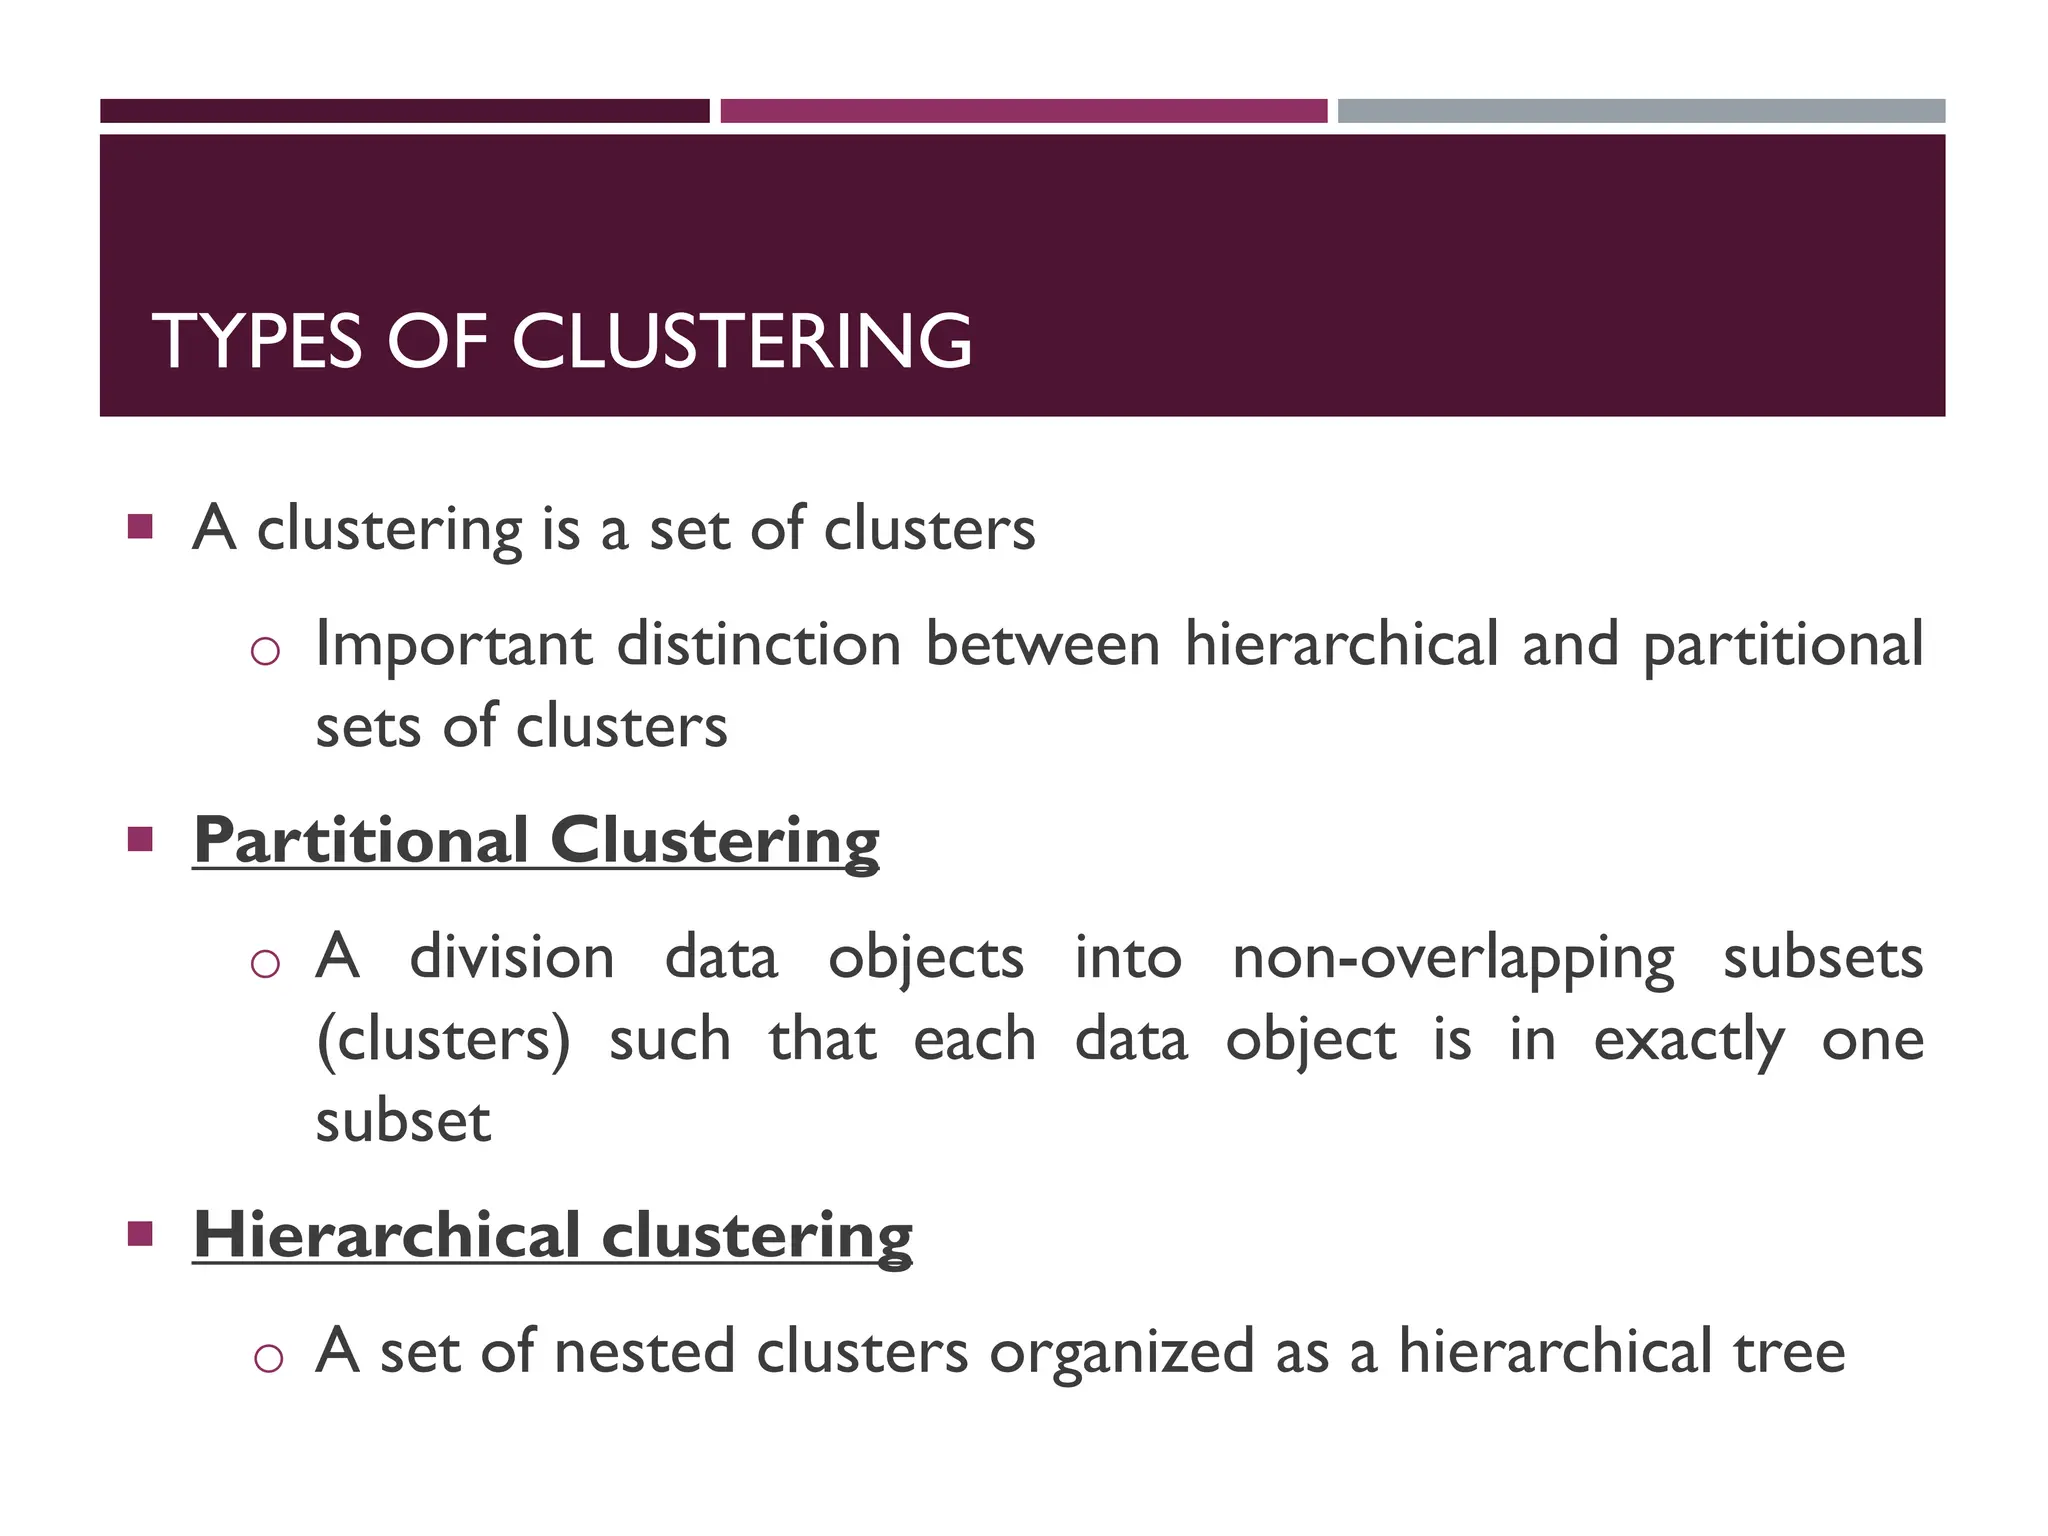
TYPES OF CLUSTERING
A clustering is a set of clusters
o Important distinction between hierarchical and partitional
sets of clusters
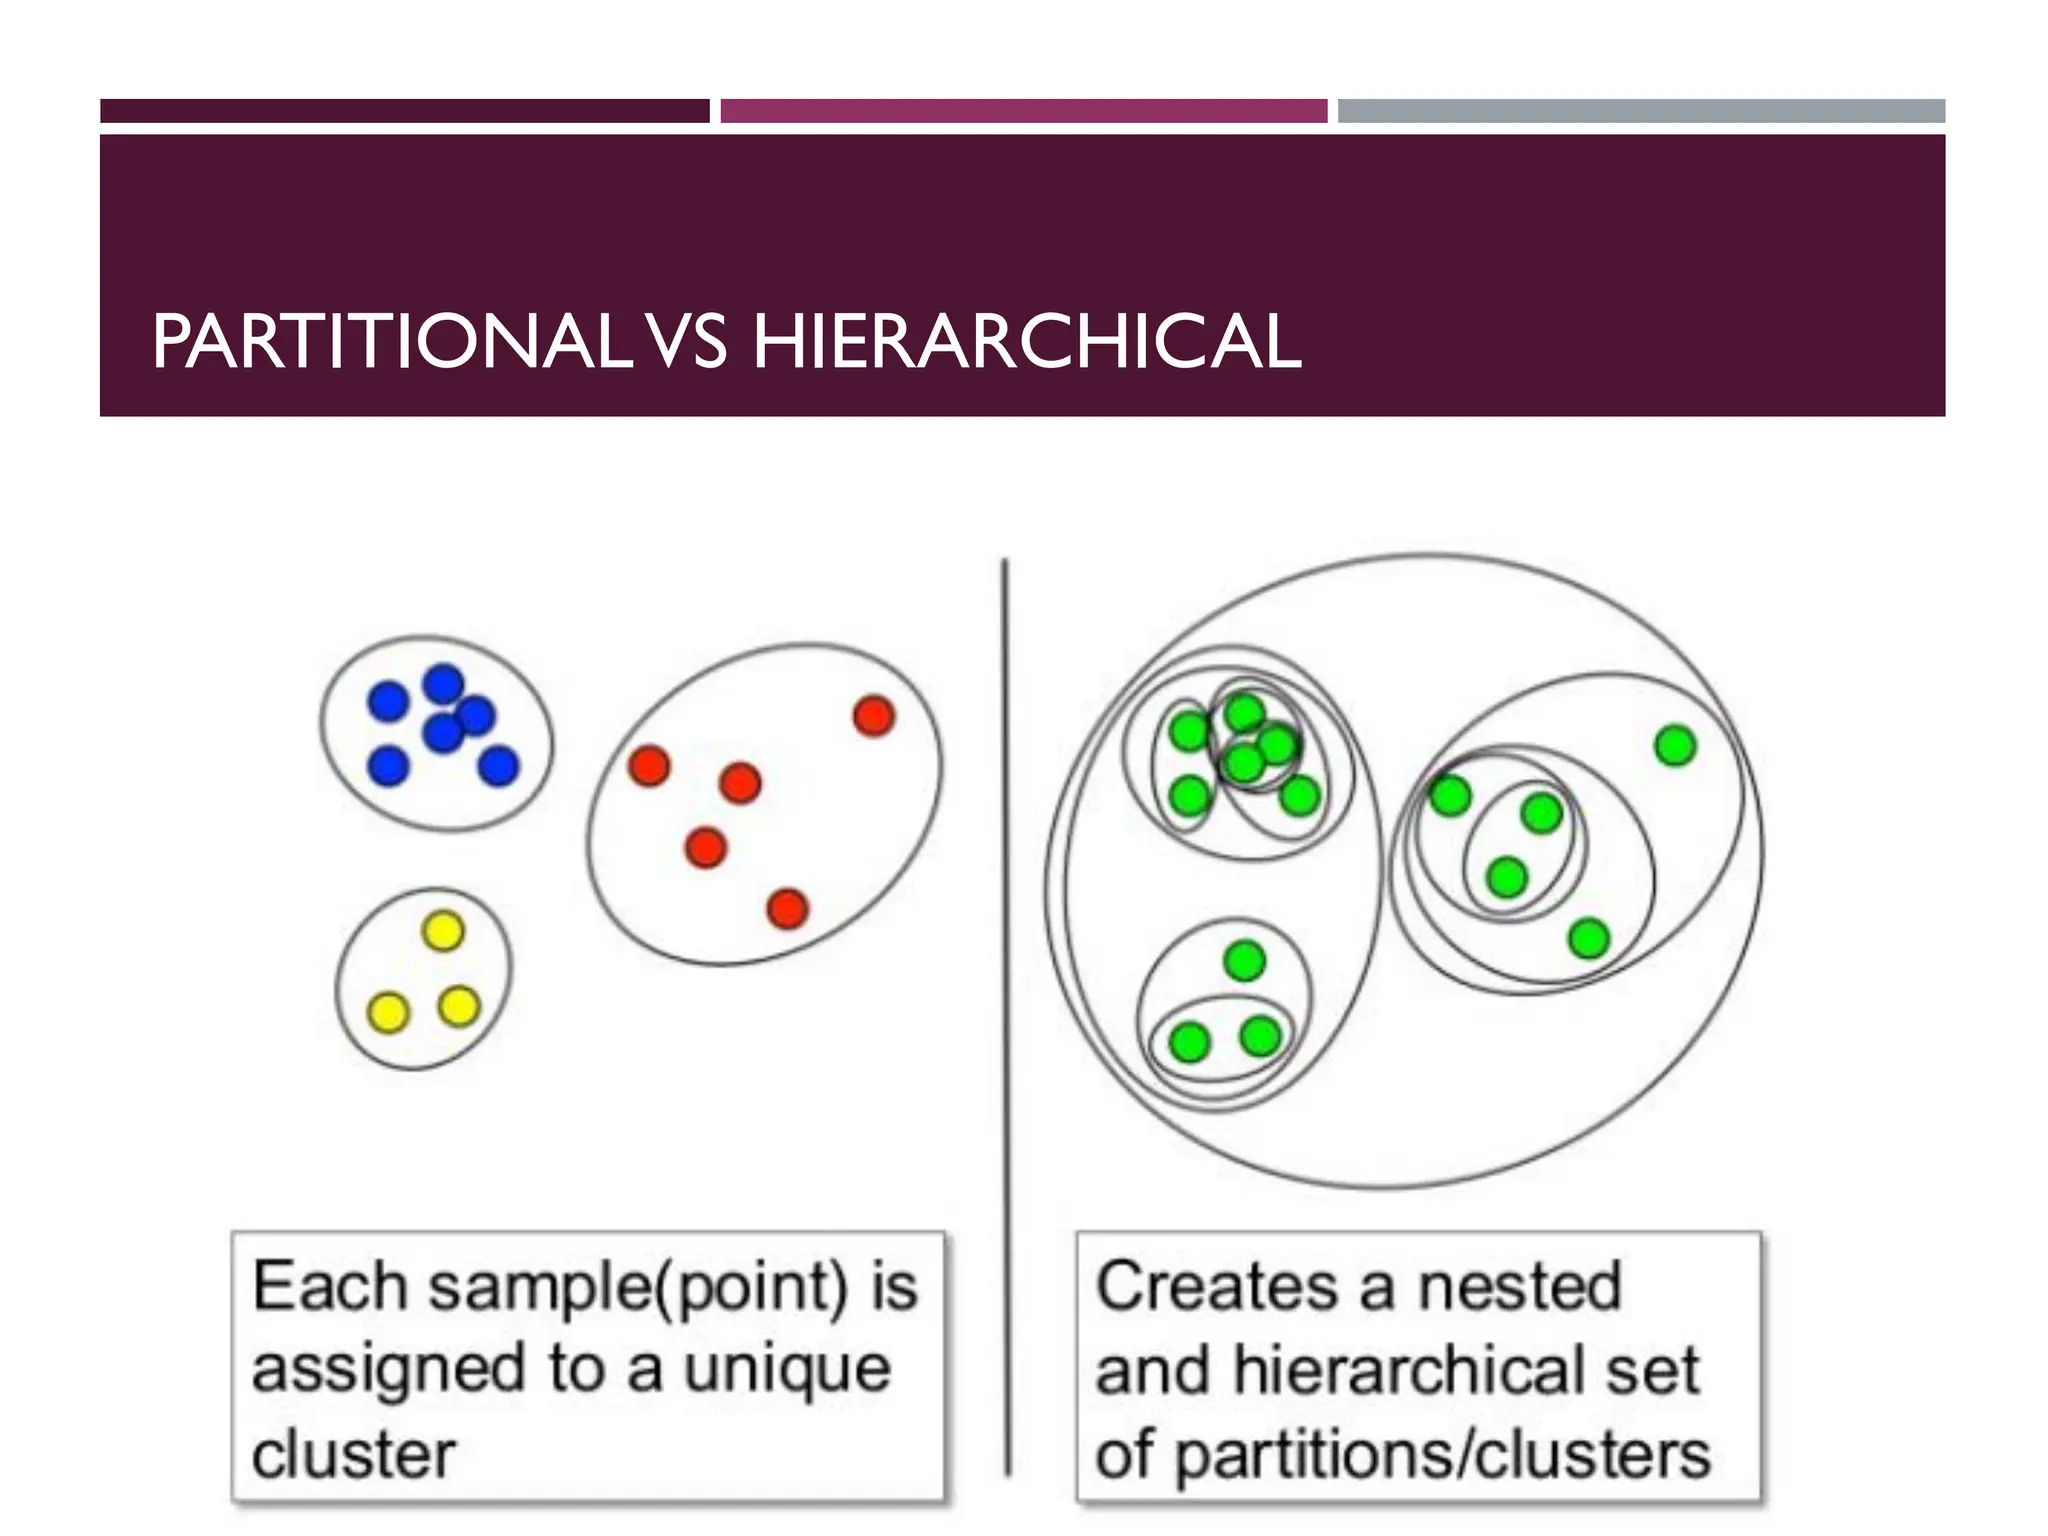
Partitional Clustering
o A division data objects into non-overlapping subsets
(clusters) such that each data object is in exactly one
subset
Hierarchical clustering
o A set of nested clusters organized as a hierarchical tree
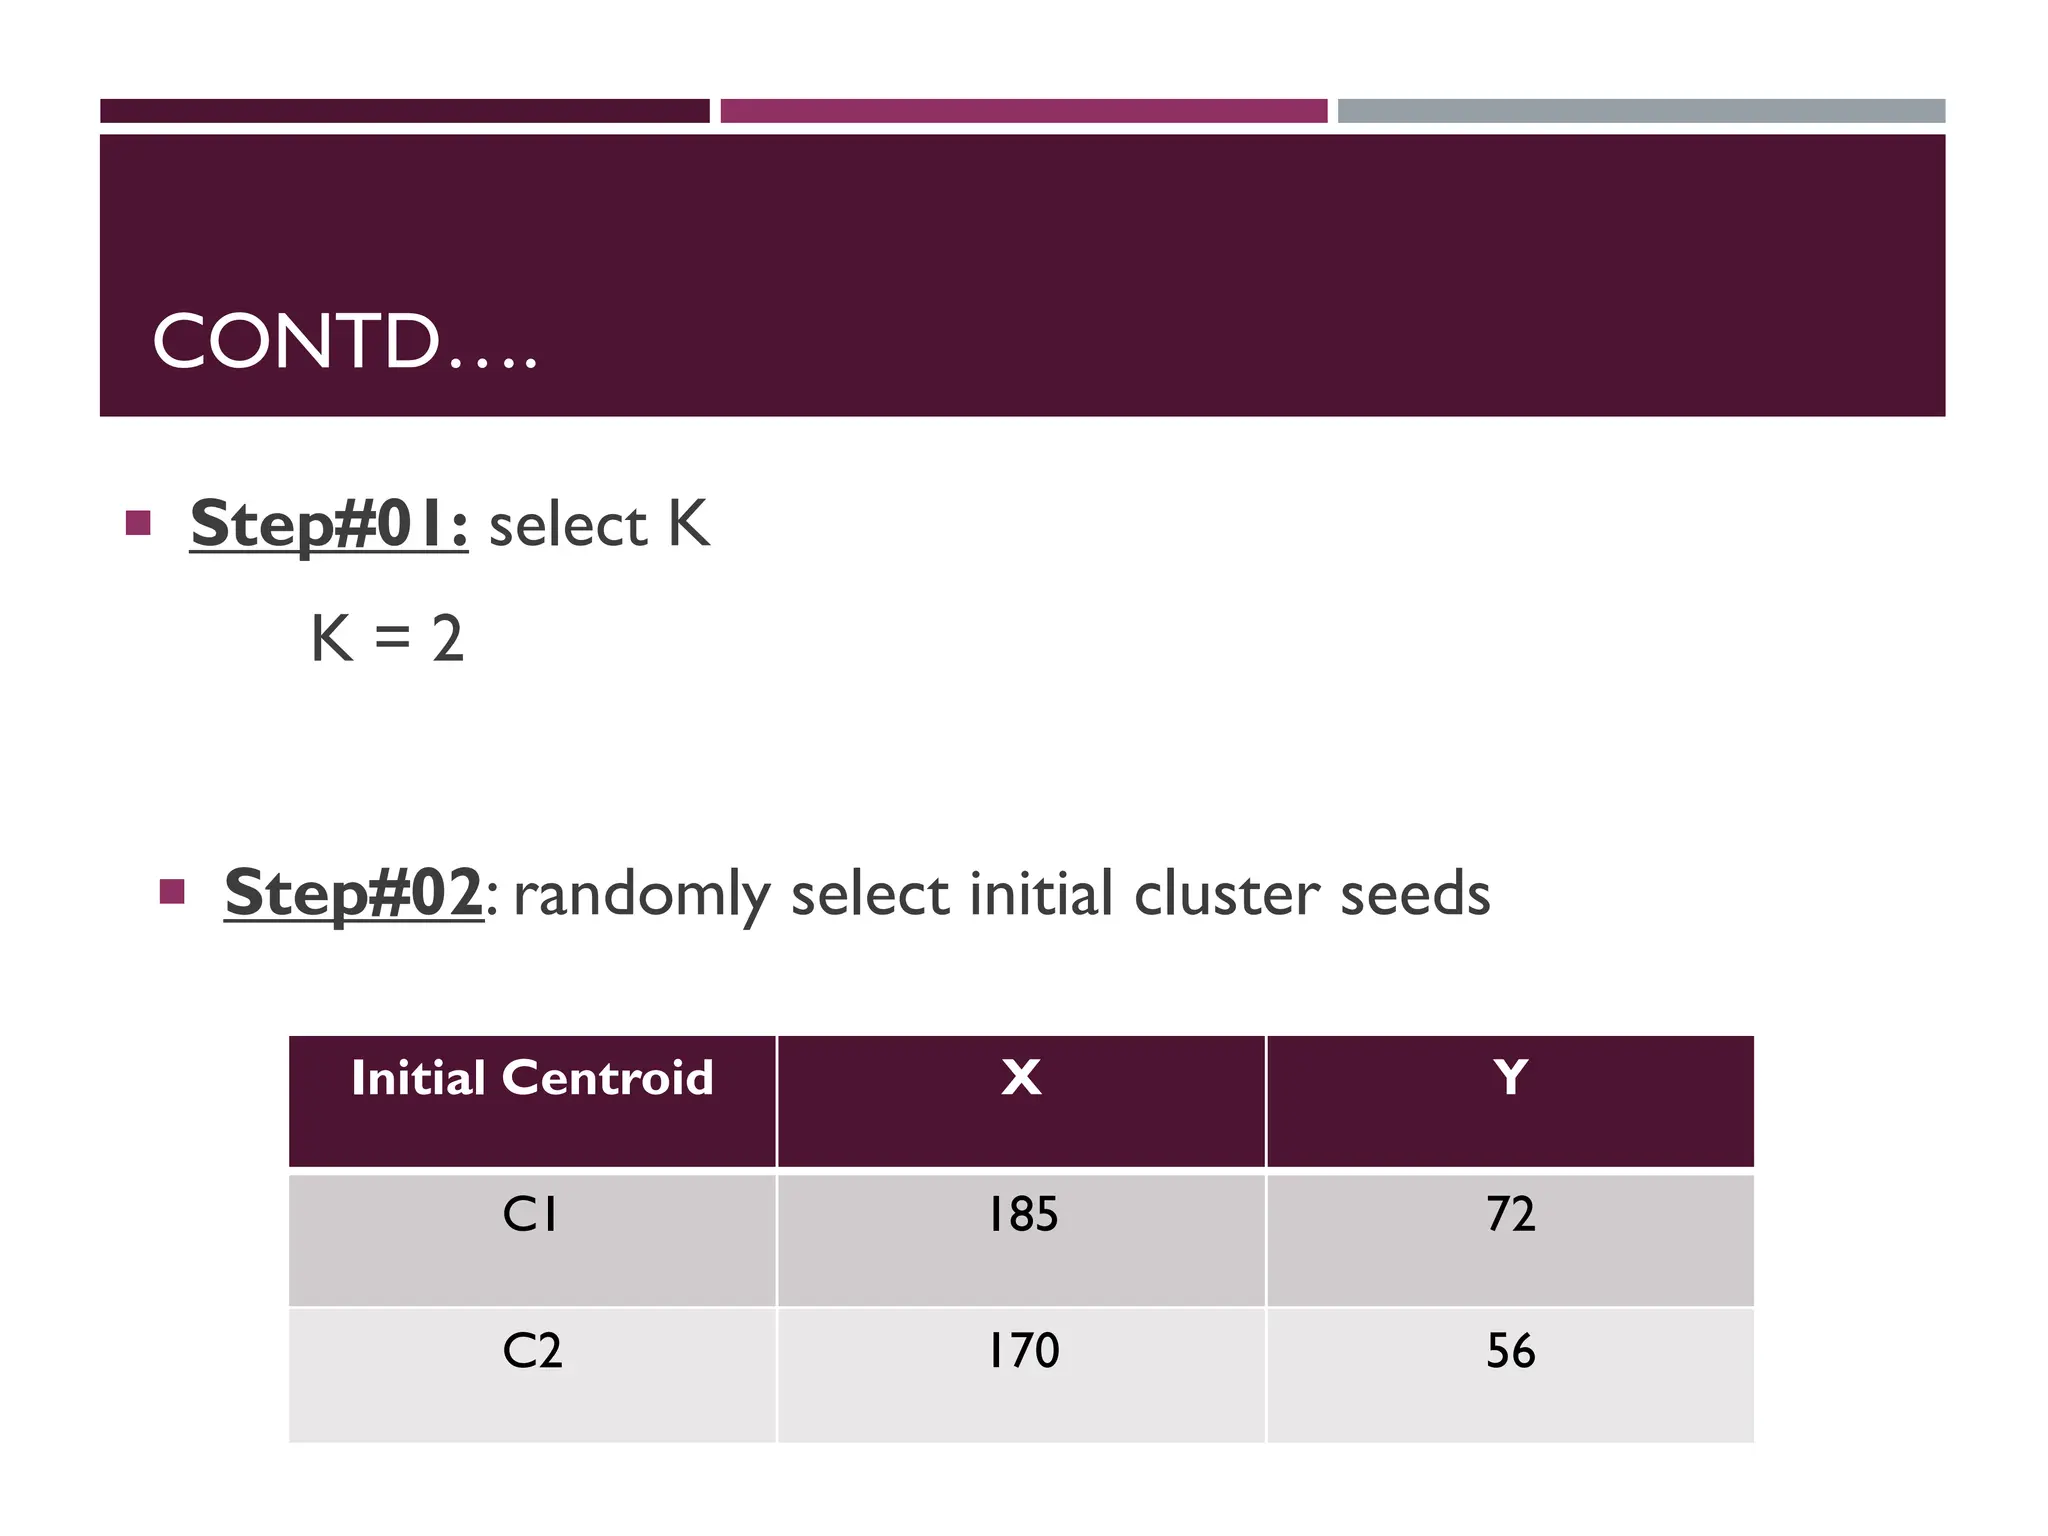
INTRODUCTION TO K-MEANSCLUSTERING
K-means clustering is a type of unsupervised learning, which is
used when you have unlabeled data (i.e., data without defined
categories or groups).
The goal of this algorithm is to find groups in the data, with
the number of groups represented by the variable K.
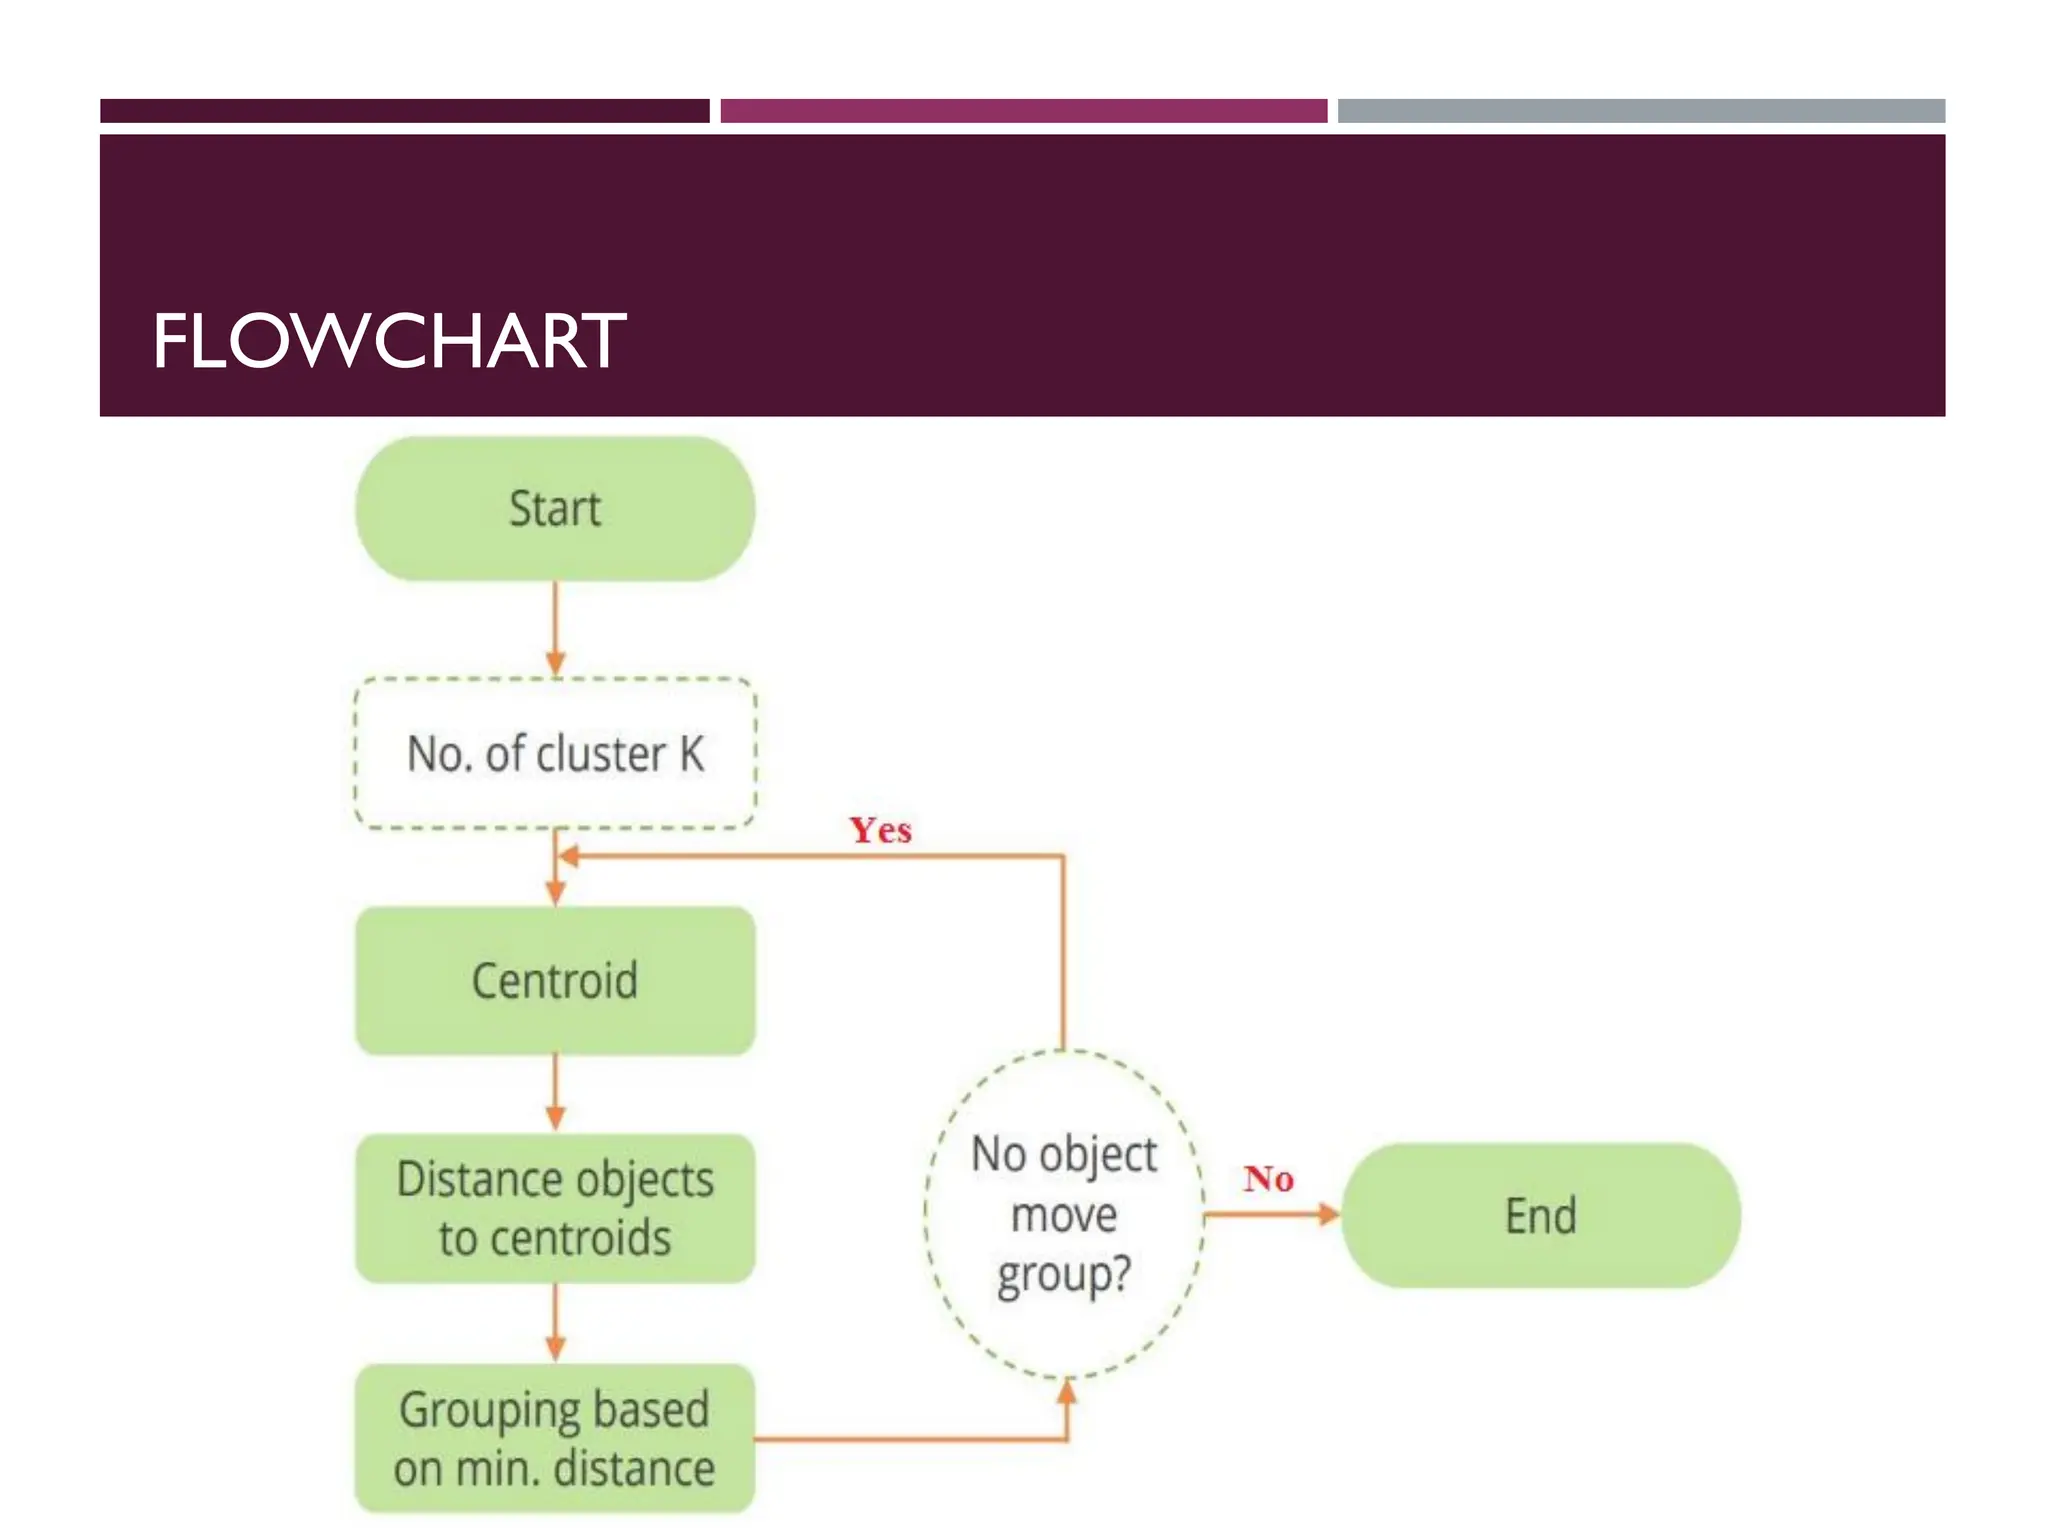
The algorithm works iteratively to assign each data point to
one of K groups based on the features that are provided. Data
points are clustered based on feature similarity.
CONTD….
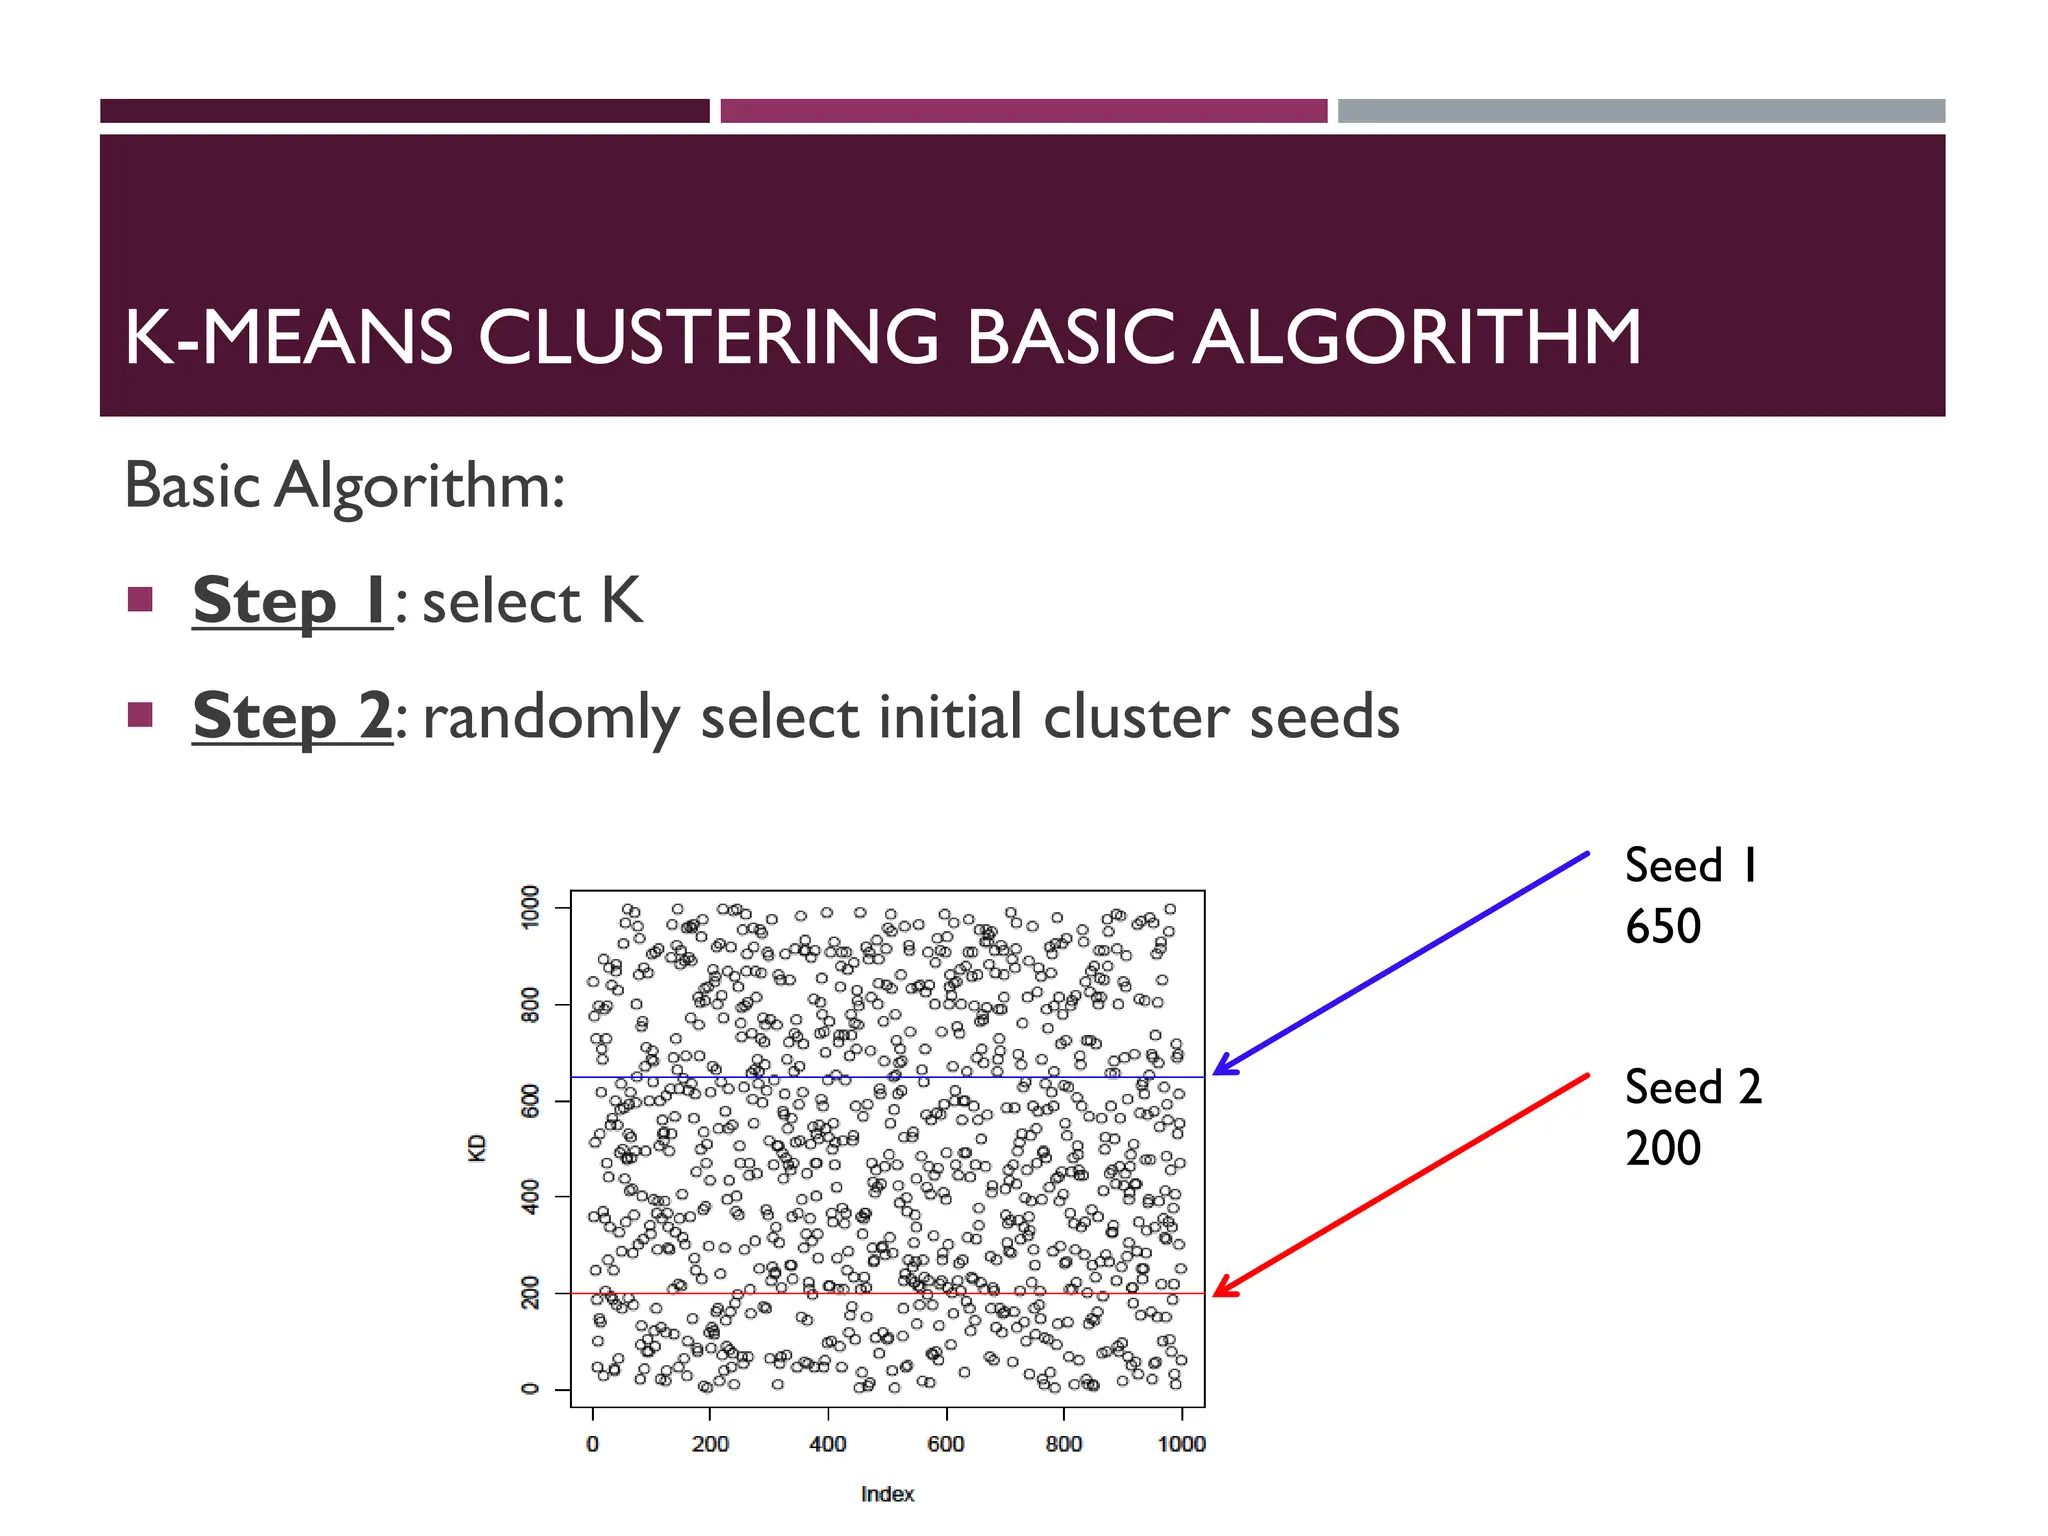
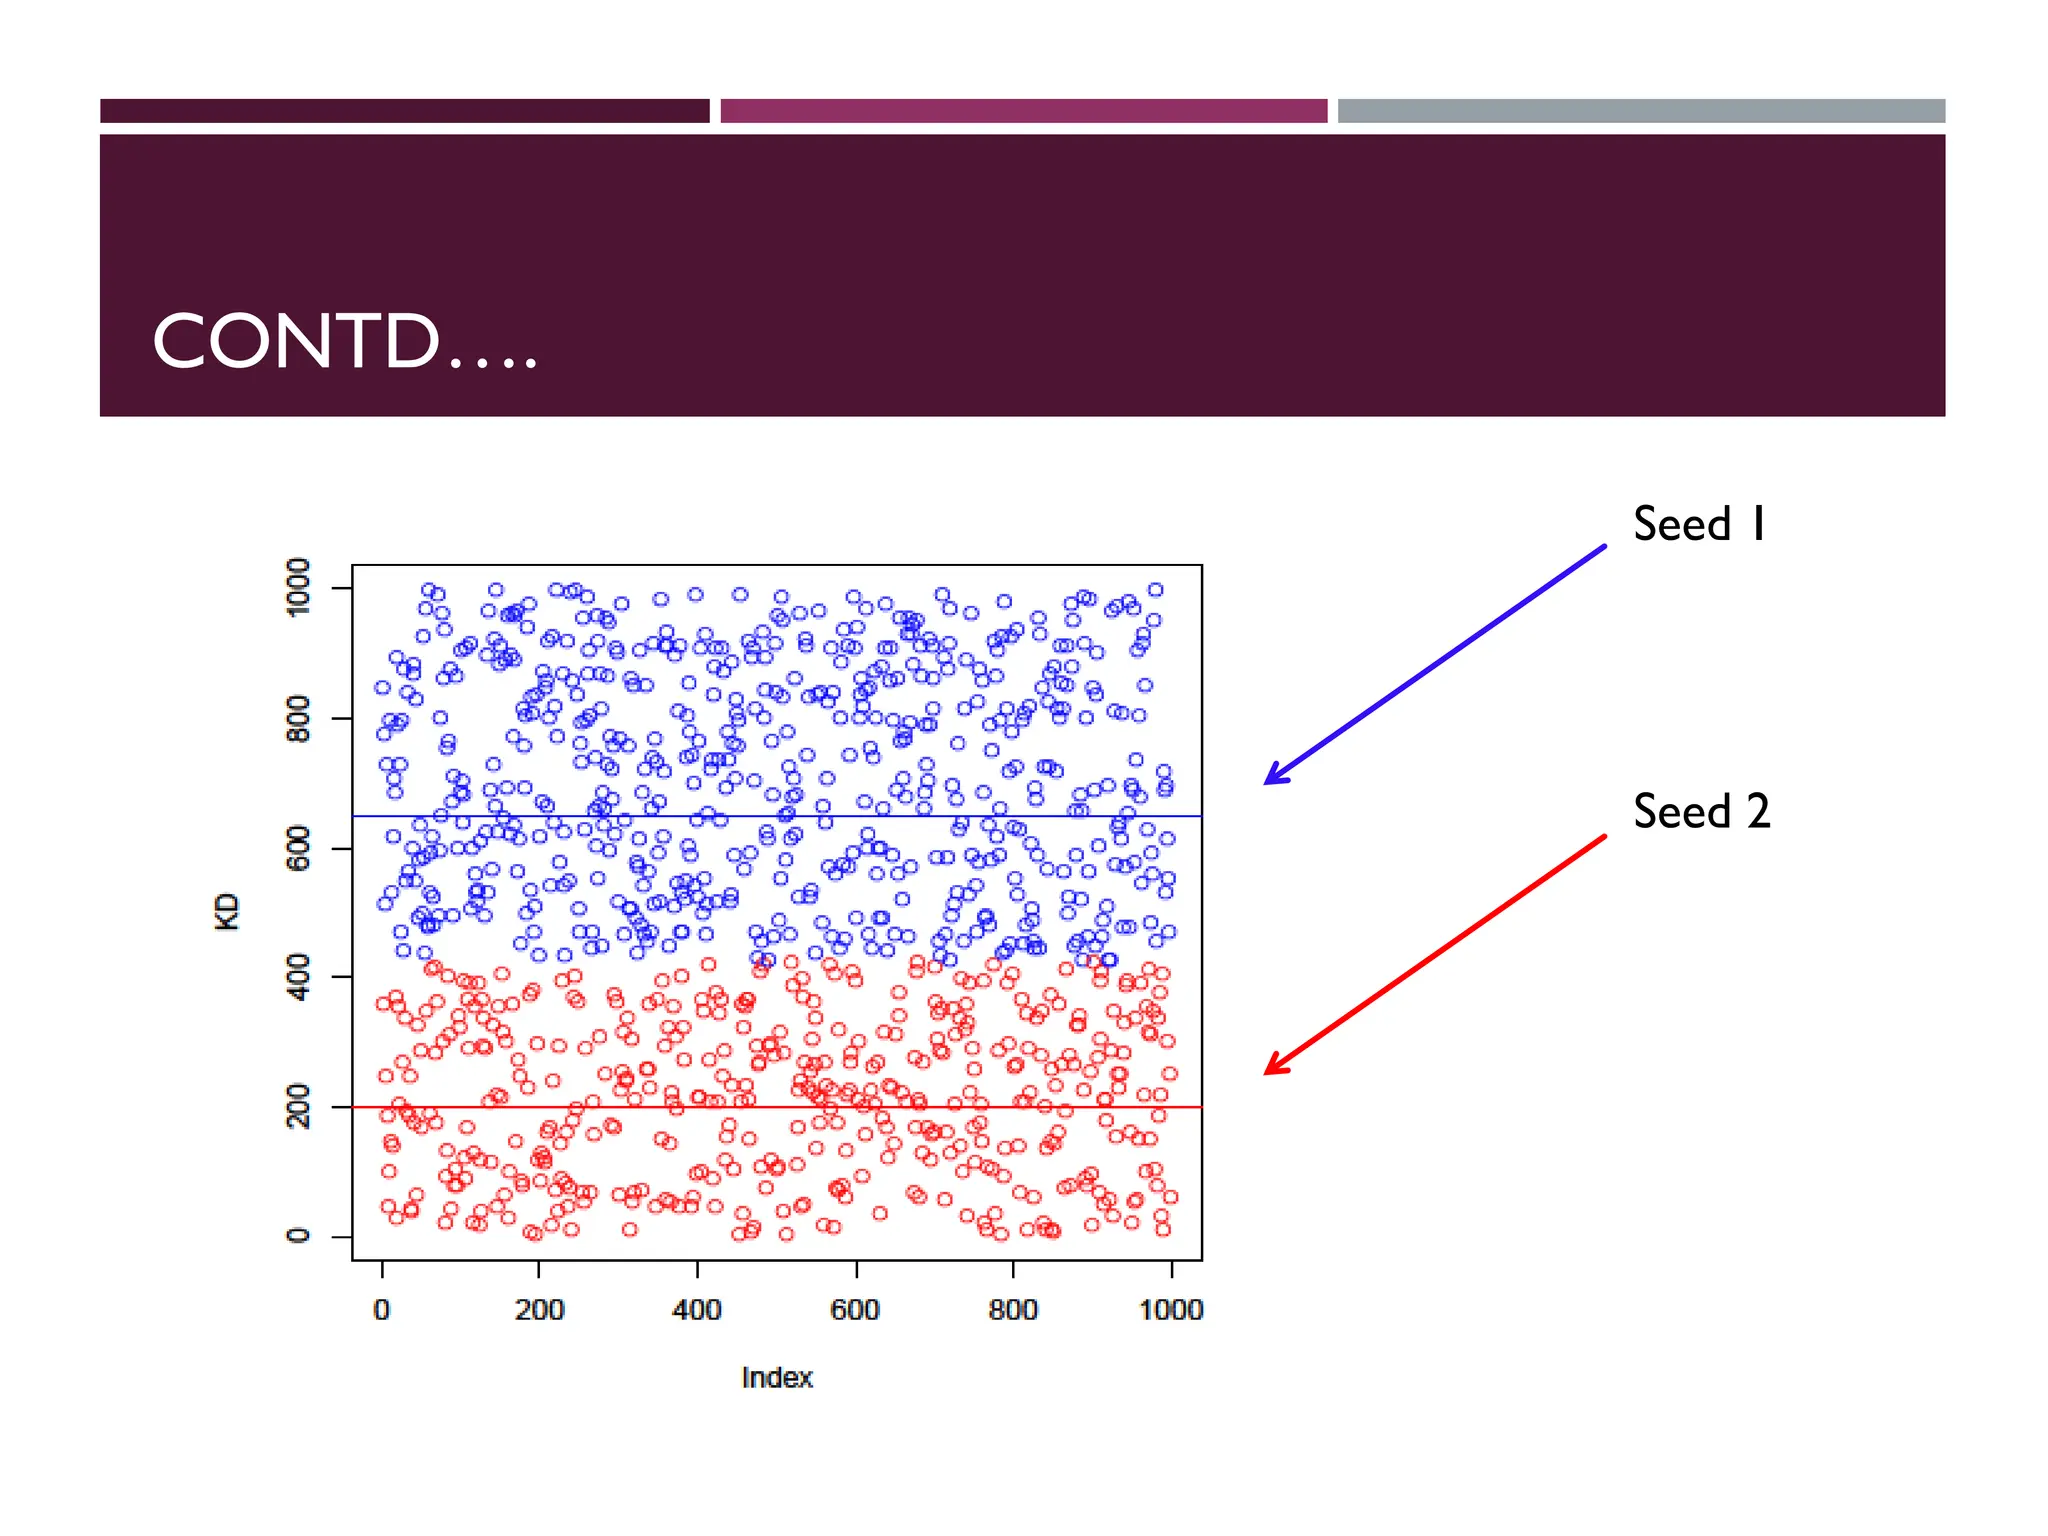
An initialcluster seed represents the “mean value” of its
cluster.
In the preceding figure:
o Cluster seed 1 = 650
o Cluster seed 2 = 200
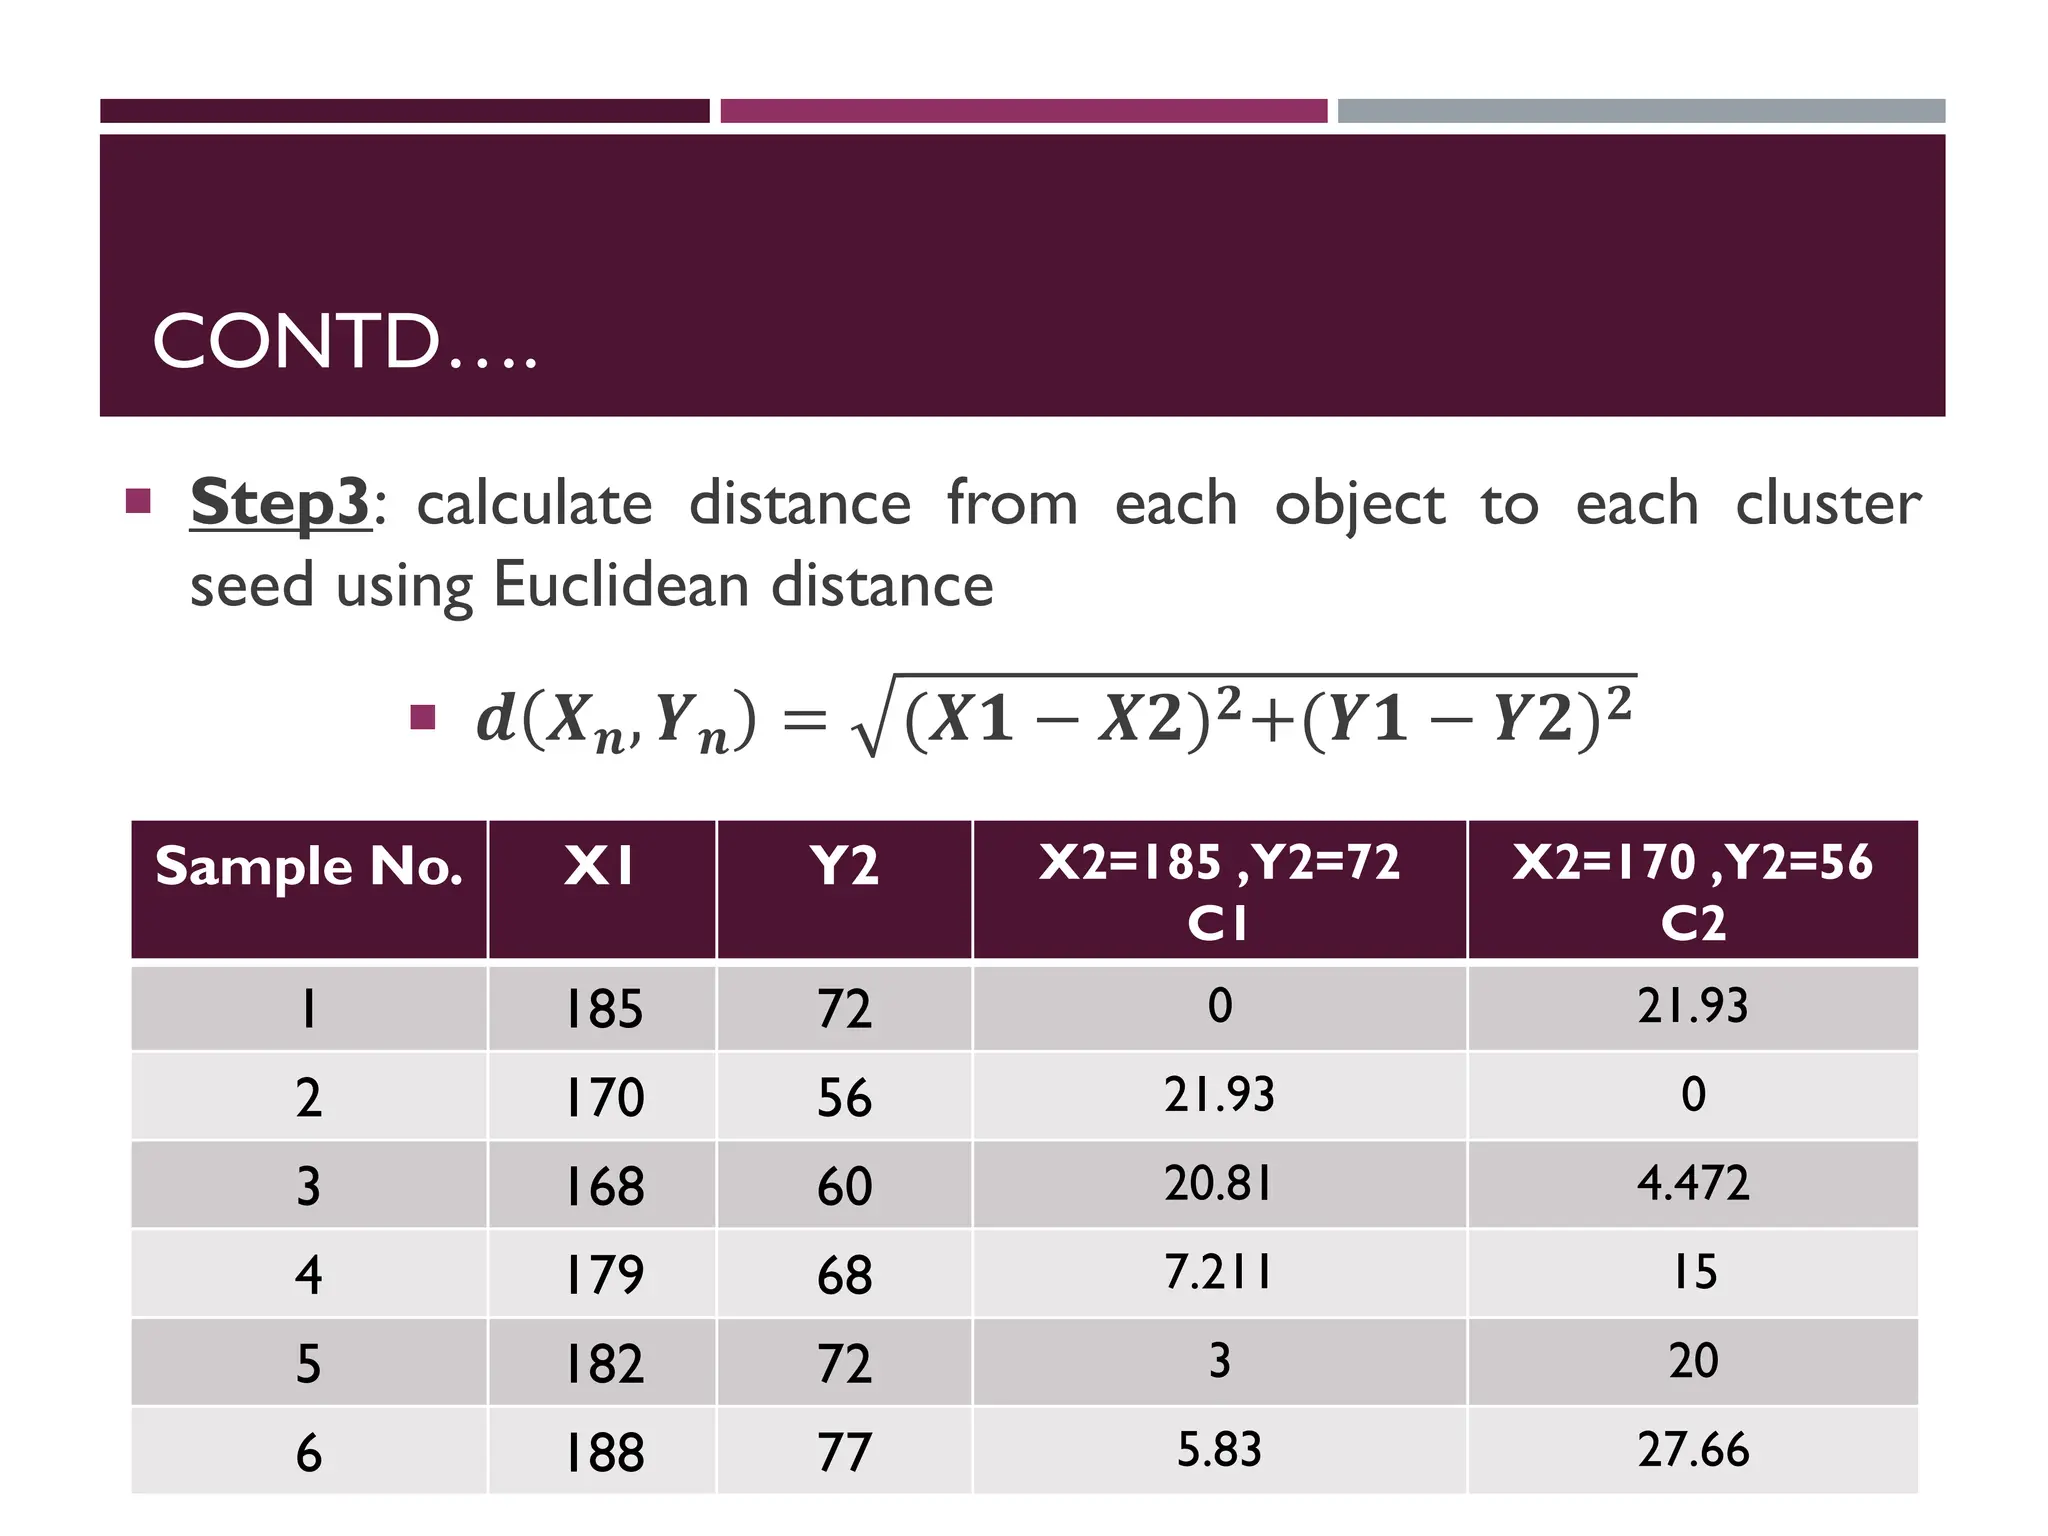
Step 3: calculate distance from each object to each cluster
seed.
What type of distance should we use?
o Squared Euclidean distance
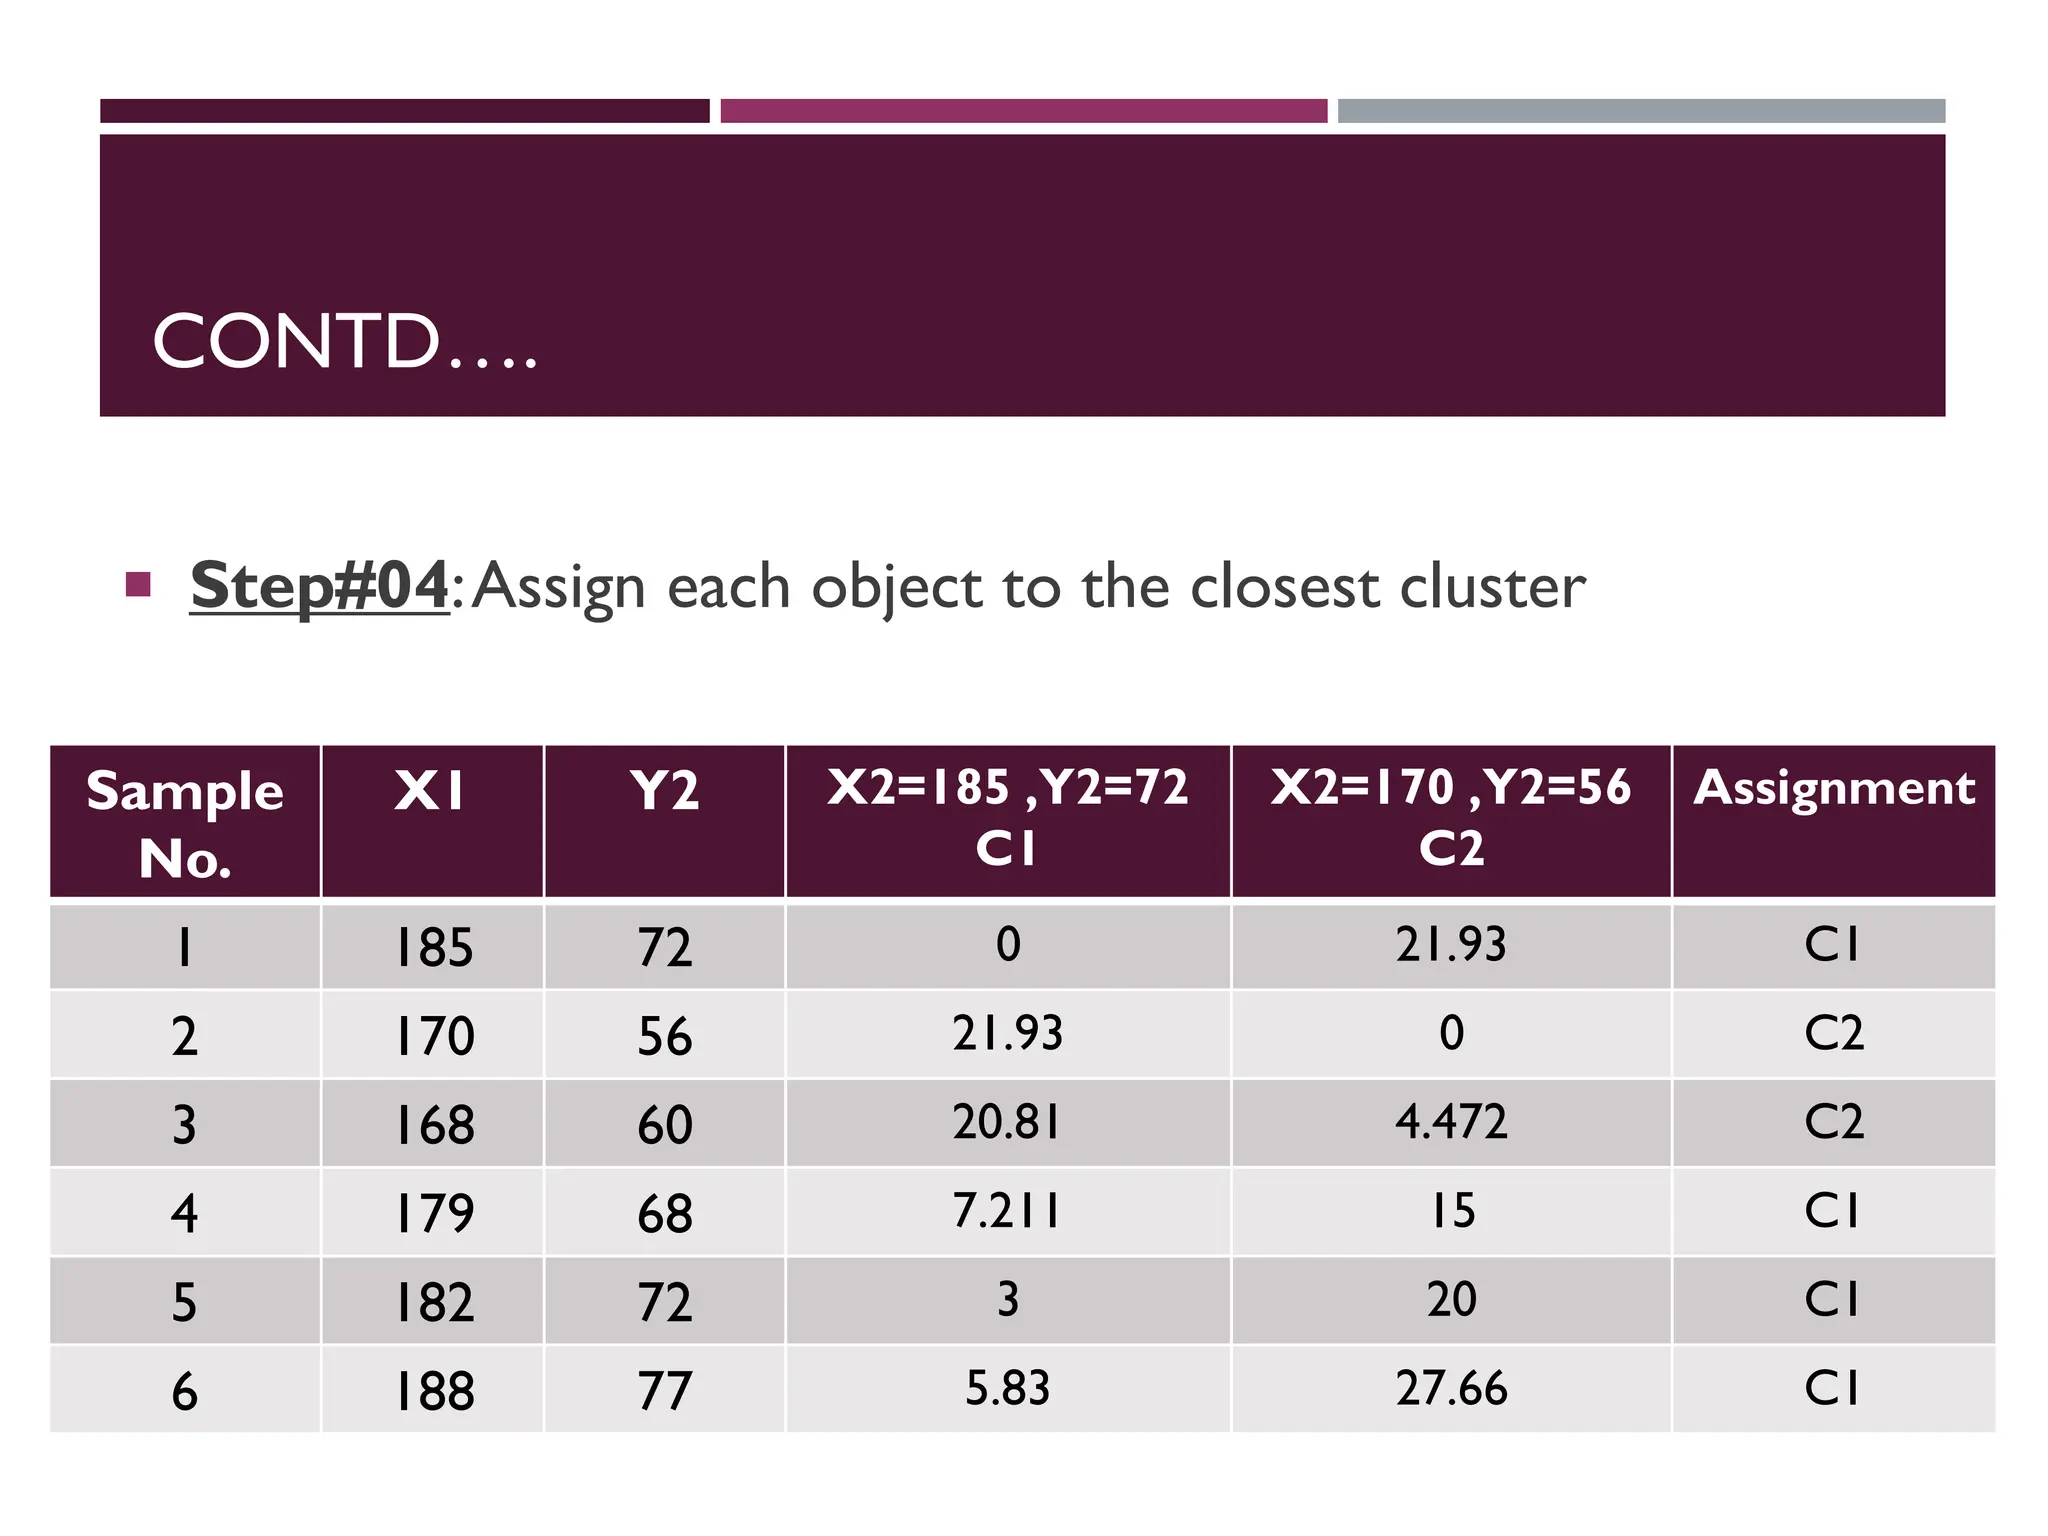
Step 4:Assign each object to the closest cluster
CONTD….
Step 5:Compute the new centroid for each cluster
Cluster Seed 1
708.9
Cluster Seed 2
214.2
17.
CONTD….
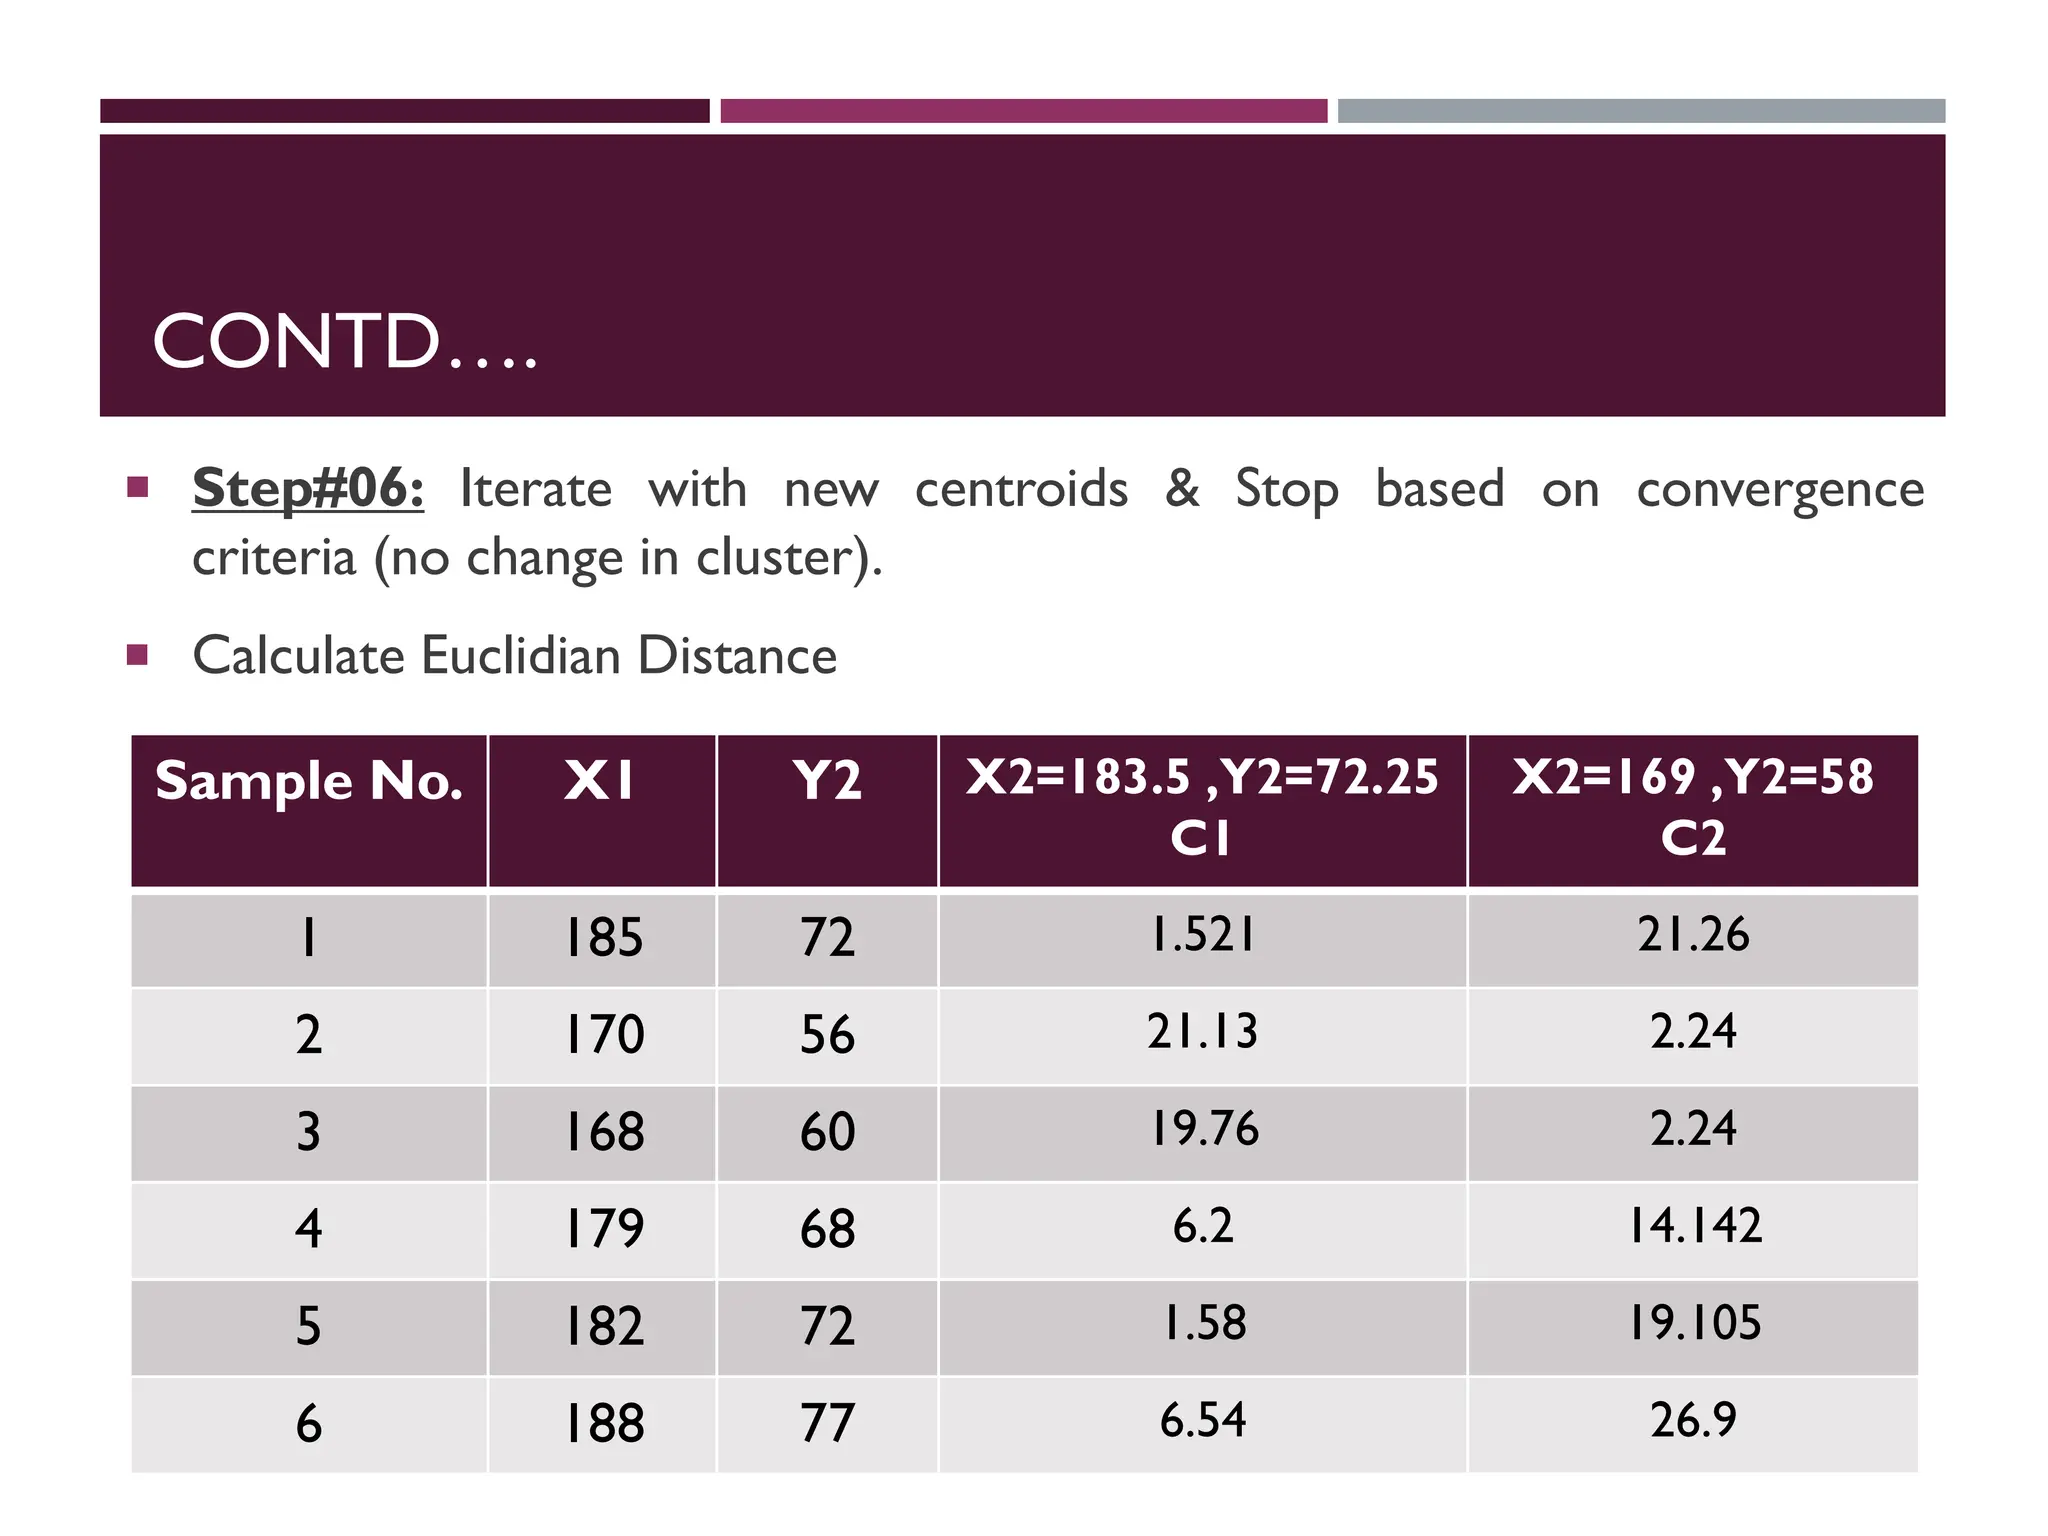
Step#06: Iterate& Stop
o Calculate distance from objects to cluster centroids.
o Assign objects to closest cluster
o Recalculate new centroids
Stop based on convergence criteria
o No change in clusters
o Max iterations
CONTD….
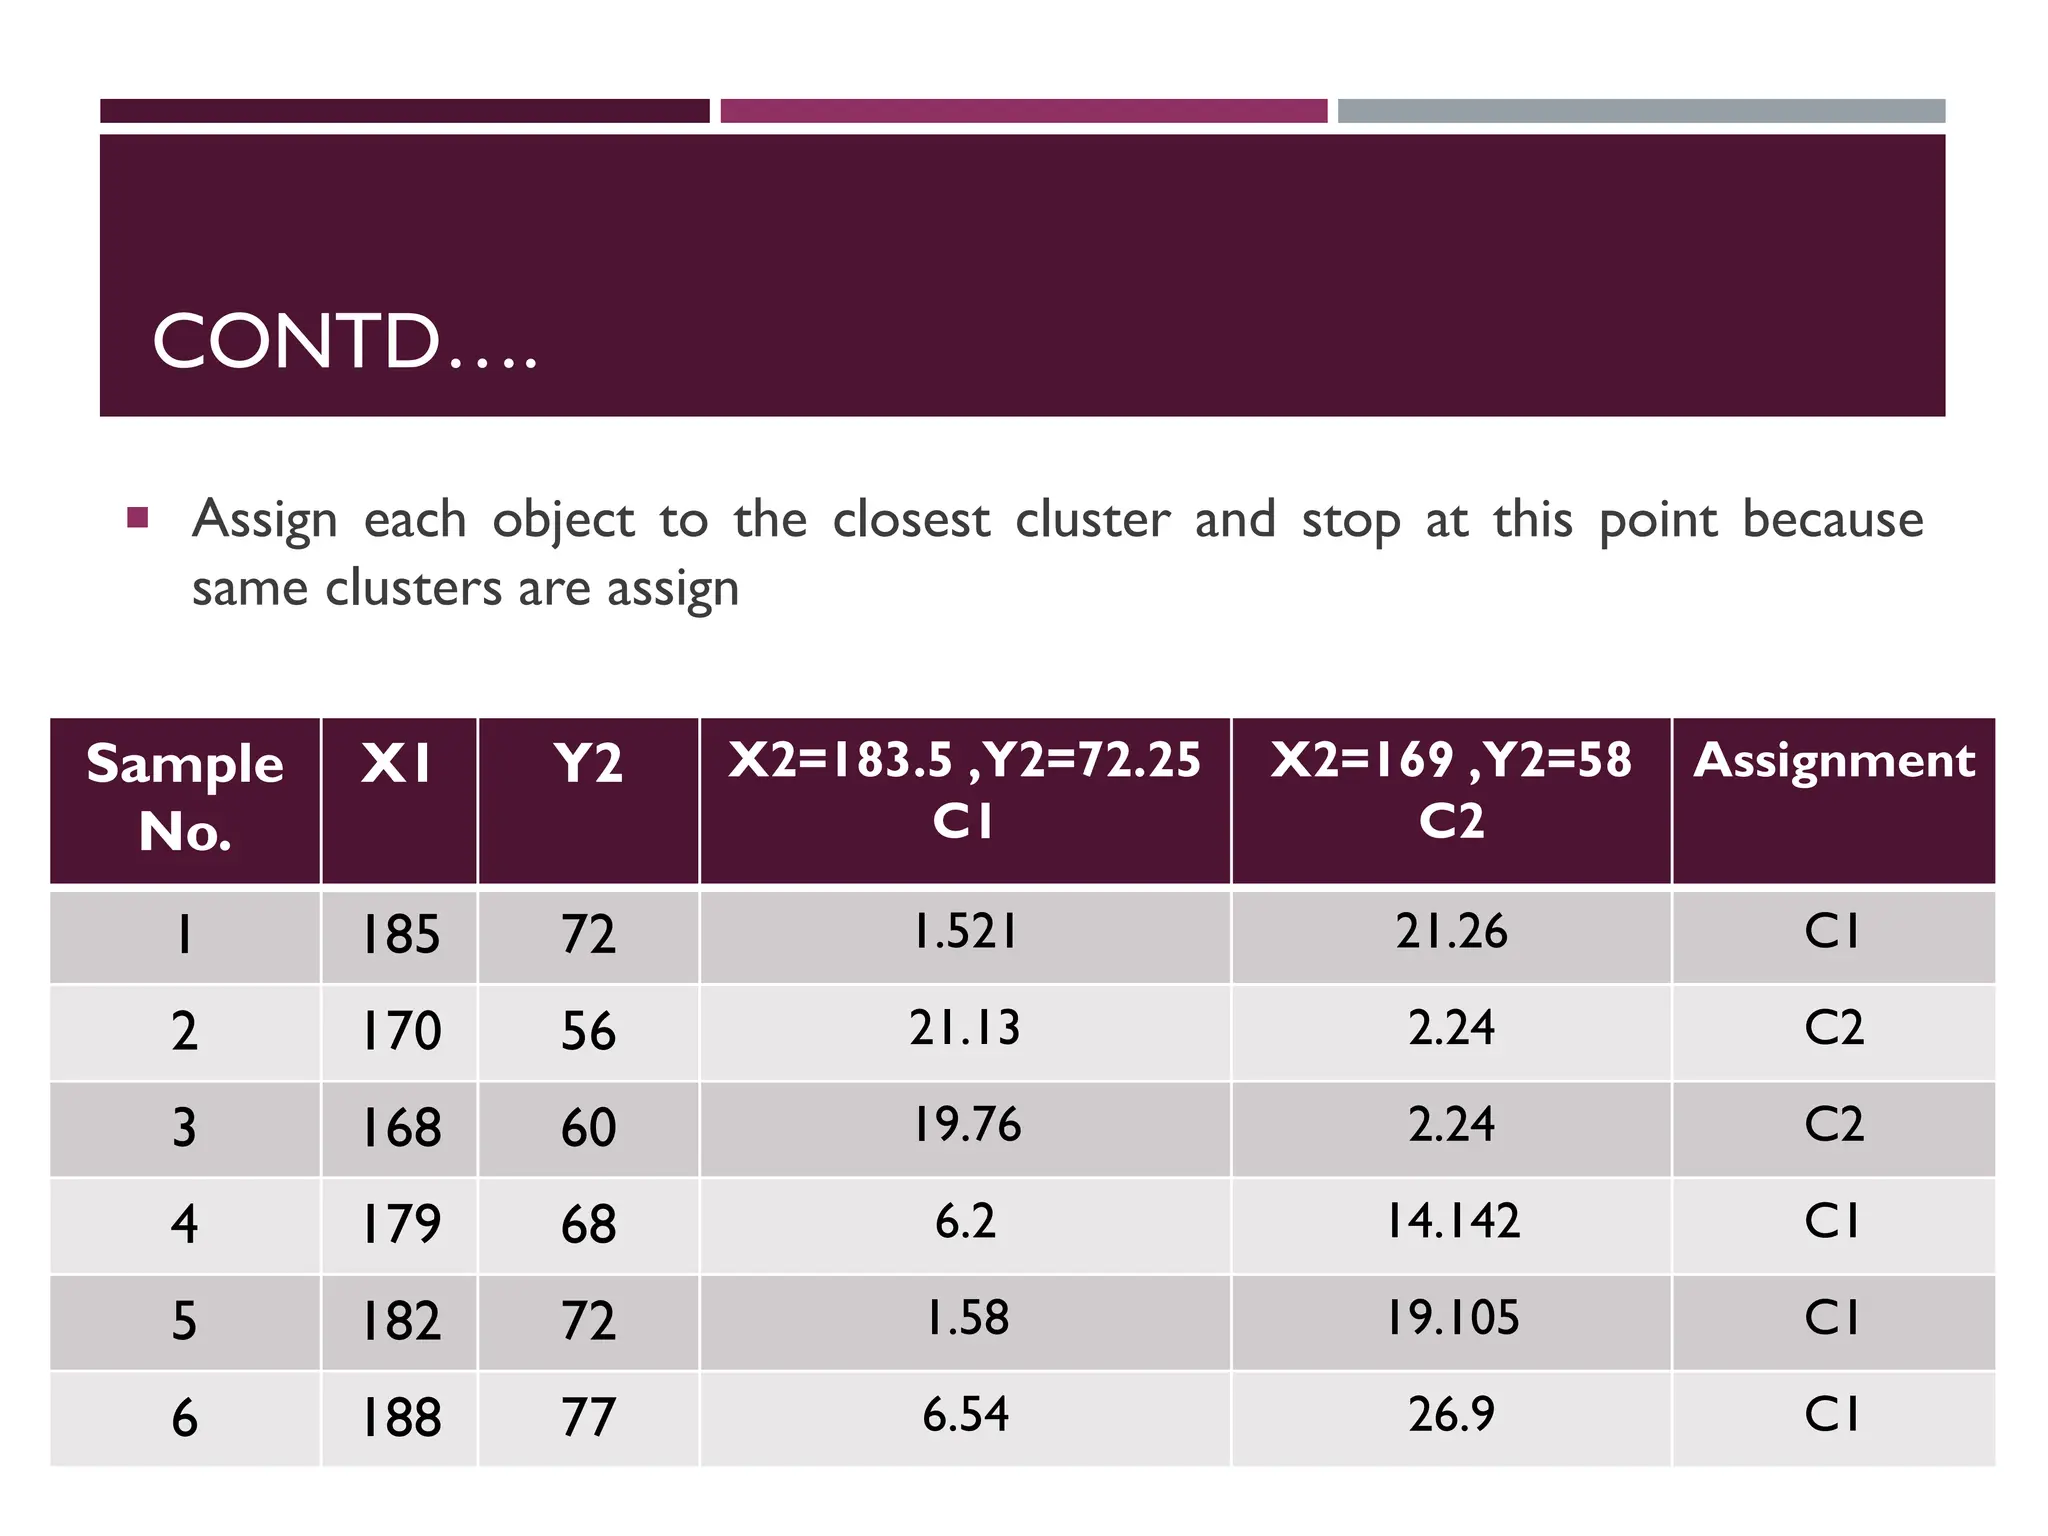
Assign eachobject to the closest cluster and stop at this point because
same clusters are assign
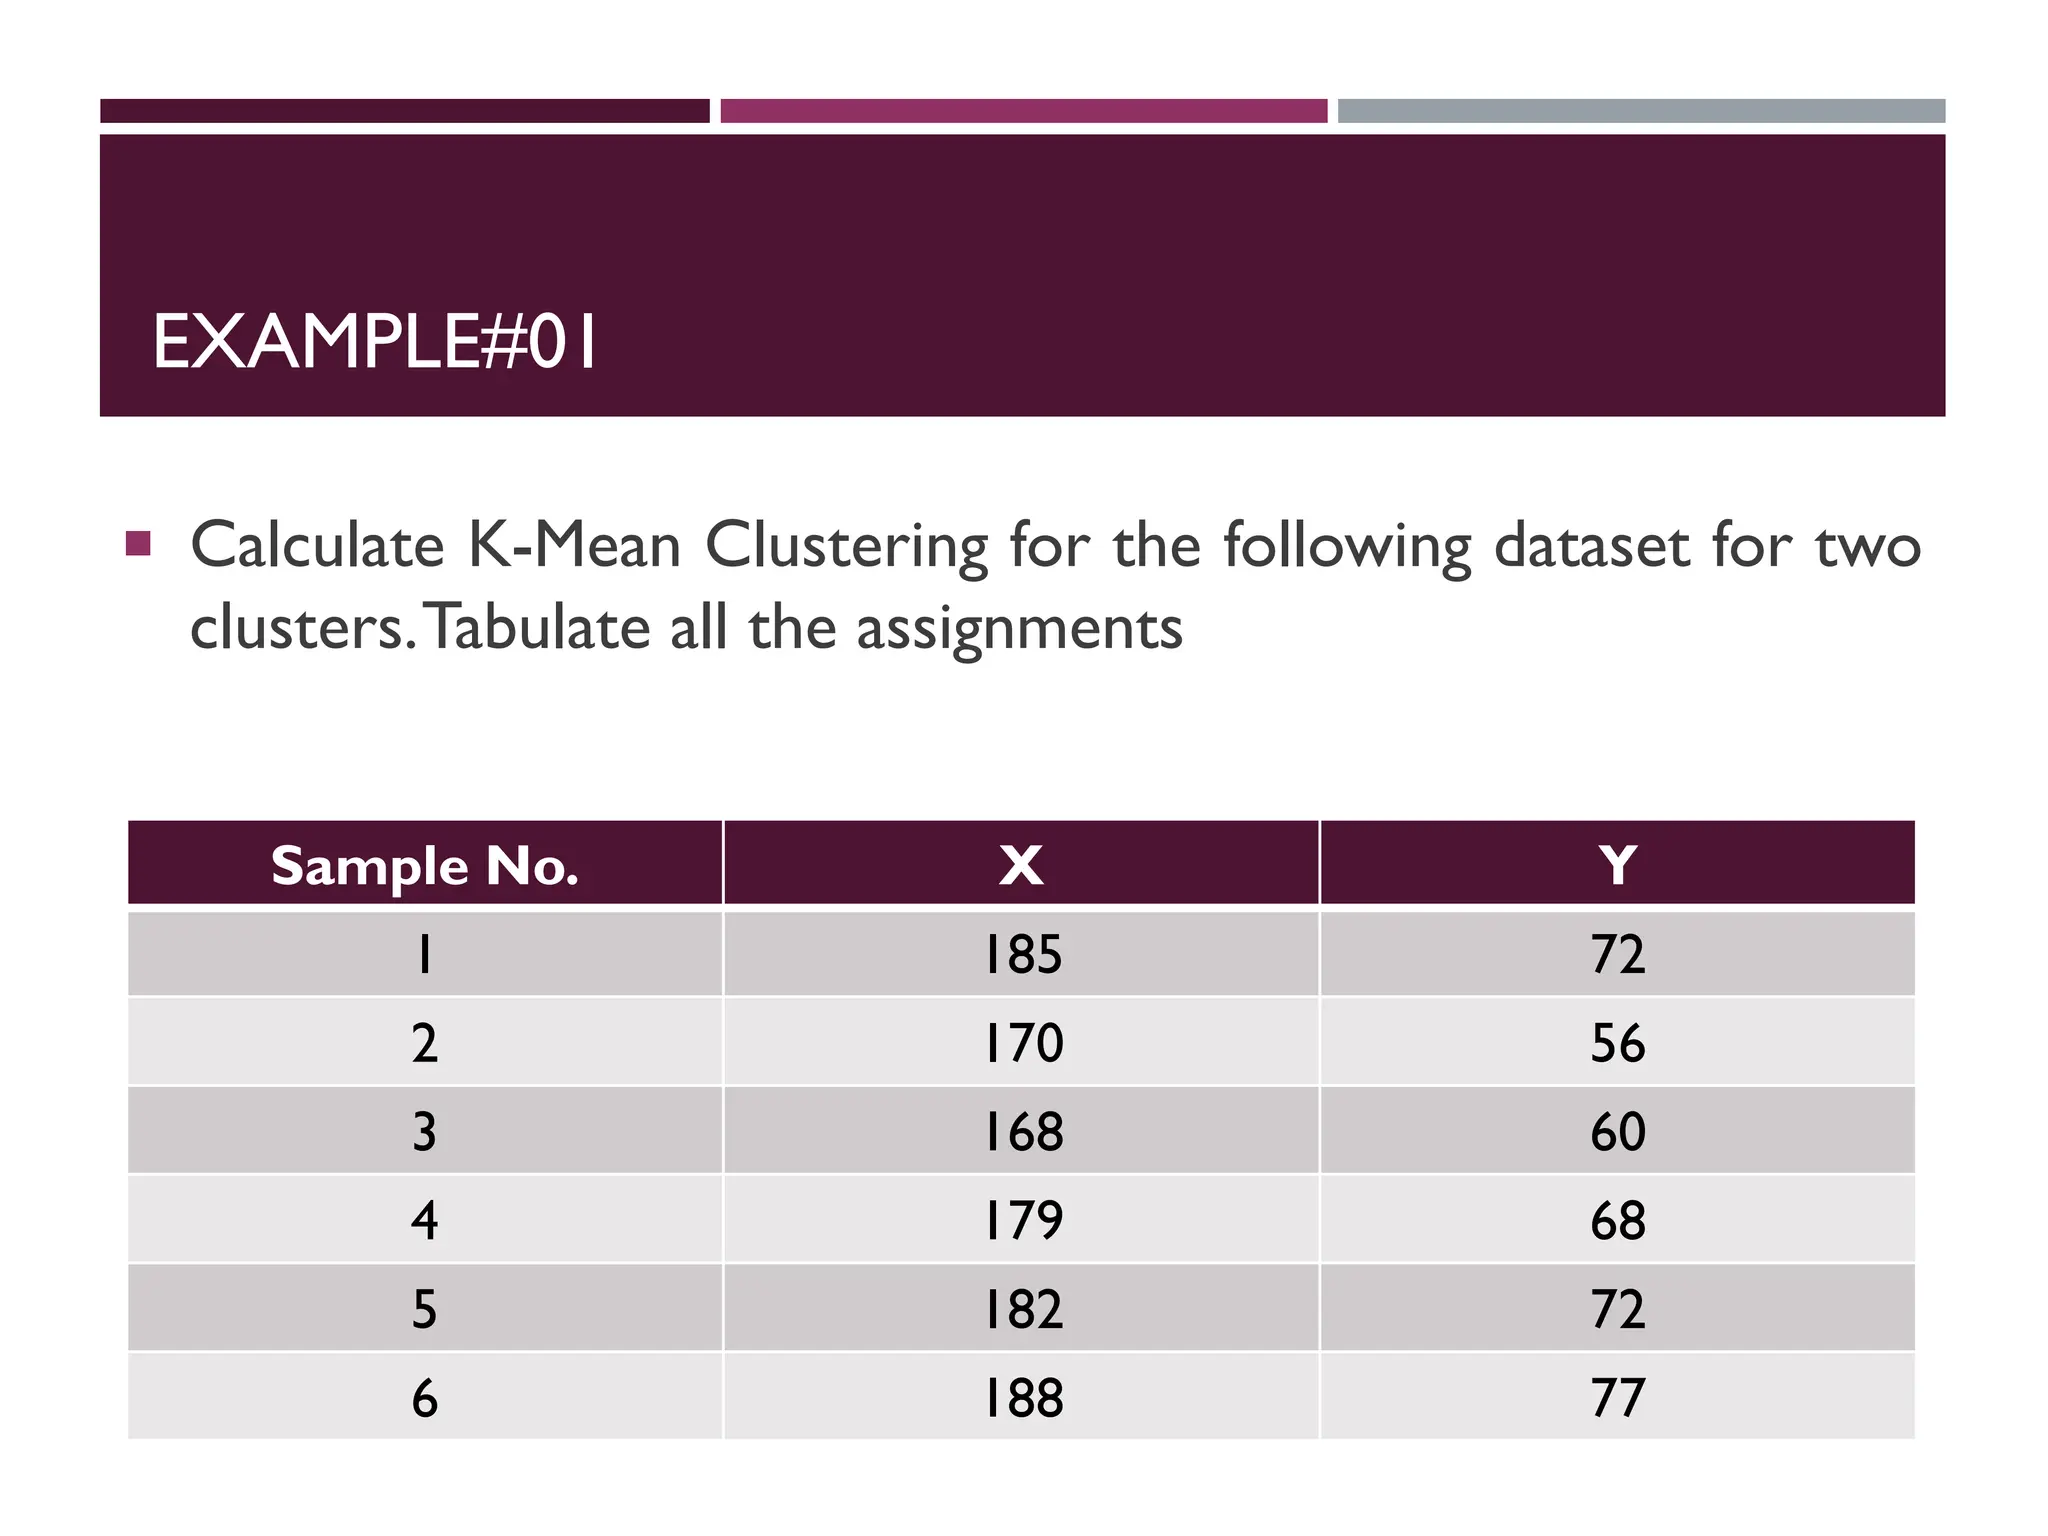
Sample
No.
X1 Y2 X2=183.5 ,Y2=72.25
C1
X2=169 ,Y2=58
C2
Assignment
1 185 72 1.521 21.26 C1
2 170 56 21.13 2.24 C2
3 168 60 19.76 2.24 C2
4 179 68 6.2 14.142 C1
5 182 72 1.58 19.105 C1
6 188 77 6.54 26.9 C1
26.
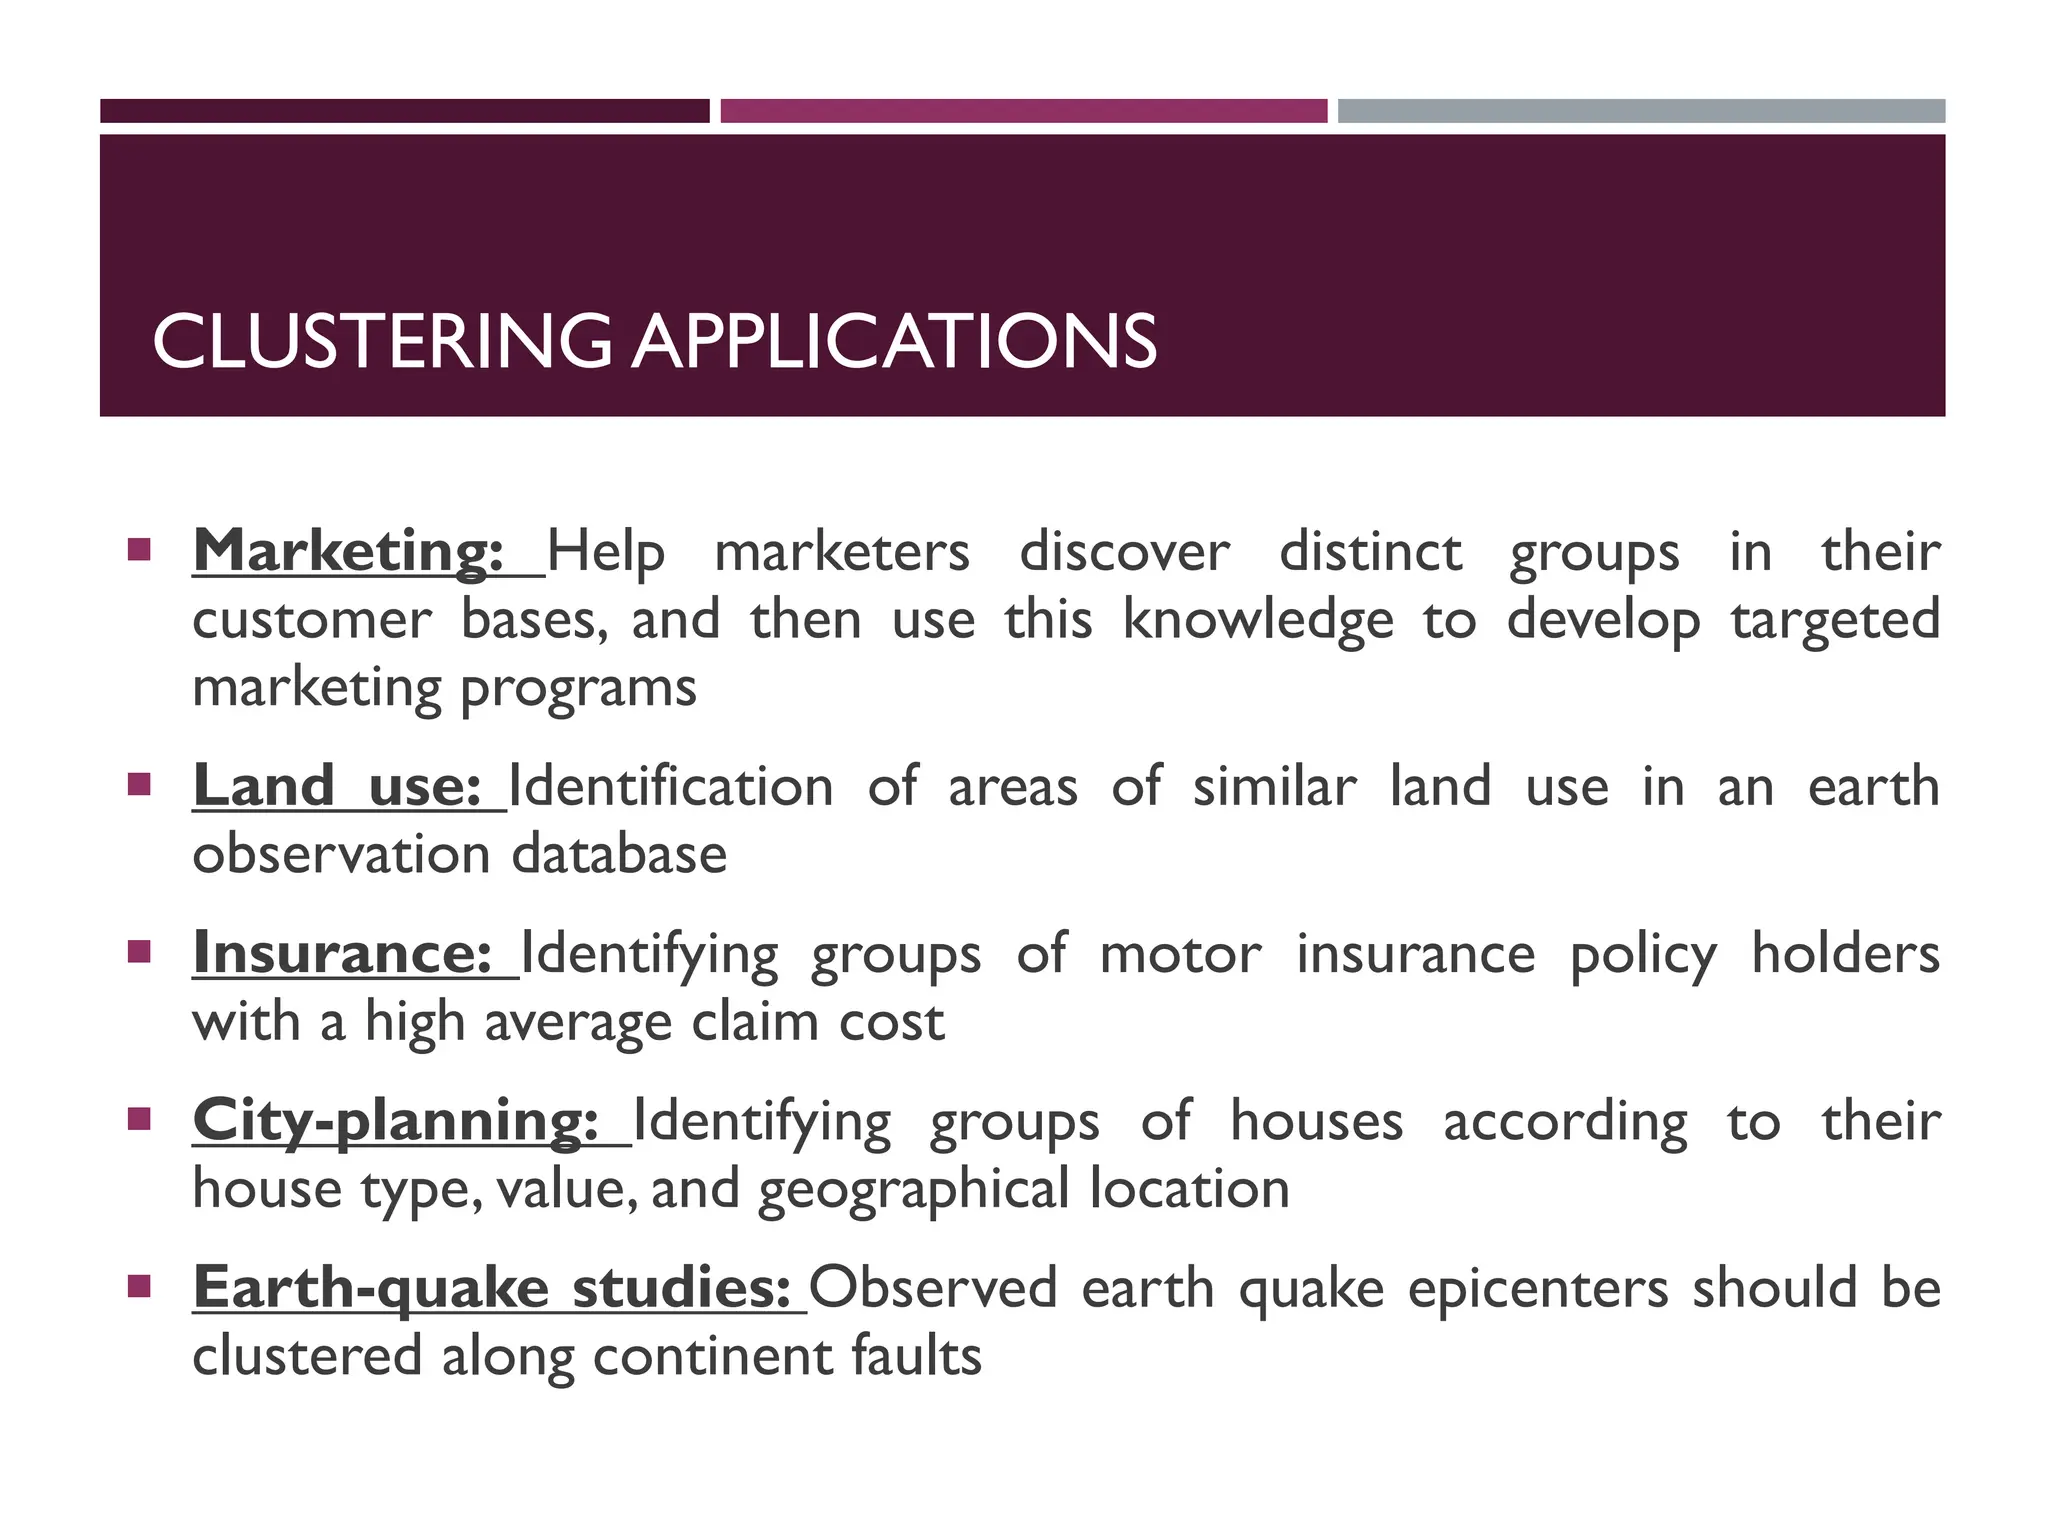
CLUSTERING APPLICATIONS
Marketing:Help marketers discover distinct groups in their
customer bases, and then use this knowledge to develop targeted
marketing programs
Land use: Identification of areas of similar land use in an earth
observation database
Insurance: Identifying groups of motor insurance policy holders
with a high average claim cost
City-planning: Identifying groups of houses according to their
house type, value, and geographical location
Earth-quake studies: Observed earth quake epicenters should be
clustered along continent faults
27.
ADVANTAGES
It isfast
Easy to understand
Comparatively efficient
If data sets are distinct then gives the best results
Produce tighter clusters
When centroids are recomputed the cluster changes.
Flexible
Easy to interpret
Better computational cost
Enhances Accuracy
28.
DISADVANTAGES
The algorithmis only applicable if the mean is defined.
o For categorical data, k-mode - the centroid is represented
by most frequent values.
The user needs to specify k.
The algorithm is sensitive to outliers
o Outliers are data points that are very far away from other
data points.
o Outliers could be errors in the data recording or some
special data points with very different values
29.
SUMMARY
Clustering ishas along history and still active
o There are a huge number of clustering algorithms
o More are still coming every year.
We only introduced several main algorithms. There are many
others, e.g.,
o density based algorithm, sub-space clustering, scale-up
methods, neural networks based methods, fuzzy clustering,
co-clustering, etc.
Clustering is hard to evaluate, but very useful in practice. This
partially explains why there are still a large number of
clustering algorithms being devised every year.
Clustering is highly application dependent.


![CONTD….
Step#05: Compute the new centroid for each cluster by calculating
mean of both the cluster values (C1 & C2)
C1 = (185 , 72) , (179 , 68) , (182 , 72) , (188 , 77)
Mean(X,Y) = [(185+179+182+188)/(4) , (72+68+72+77)/(4)]
C1(new) = (183.5 , 72.25)
C2 = (170 , 56) , (168 , 60)
Mean(X,Y) = [(170+168)/(2) , (56+60)/(2)]
C1(new) = (169 , 58)](https://image.slidesharecdn.com/chapter04part01k-meansclusterig-250525201708-2d369307/75/Chapter-04-Part-01-K-Means-Clusterig-pdf-23-2048.jpg)


![[ML]-Unsupervised-learning_Unit2.ppt.pdf](https://cdn.slidesharecdn.com/ss_thumbnails/ml-unsupervised-learningunit2-230916145038-acbd0397-thumbnail.jpg?width=640&height=640&fit=bounds)


