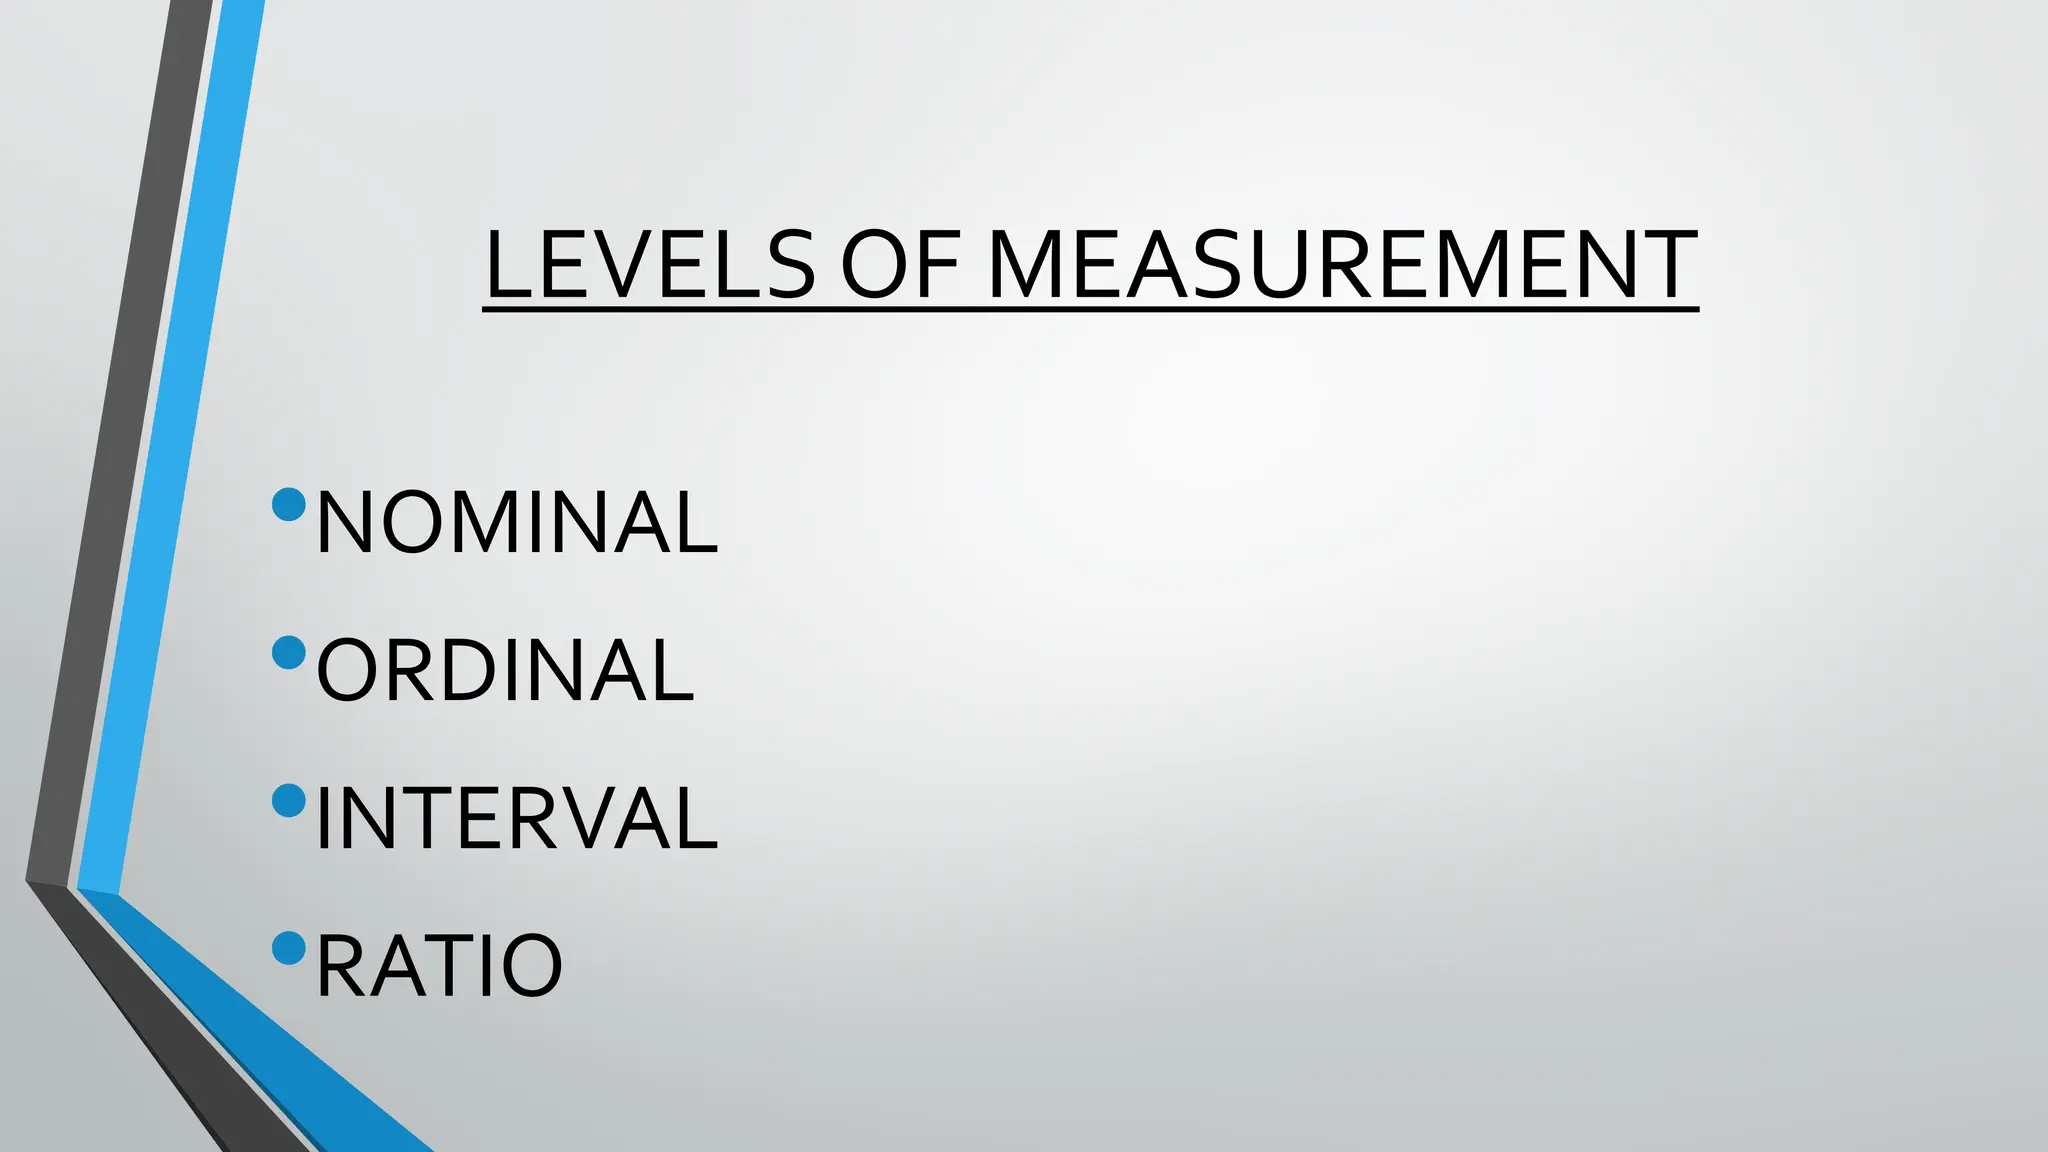
SlideShare a Scribd company logo
1 of 11
Download to read offline
LEVELS OF
MEASUREMENT
SIR LY
OBJECTIVE:
•to identify and differentiate the
different levels of measurement and
methods of data collection
LEVELS OF MEASUREMENT
•NOMINAL
•ORDINAL
•INTERVAL
•RATIO
NOMINAL LEVEL
•A measurement arises when we have
variables that are categorical and non-
numeric or where the numbers have no
sense of ordering
EX.
Numbers on the uniform, Sex, Marital
status, religion affiliation, college major,
blood type
Ordinal level
•deals with categorical variables like the
nominal level, but in this level ordering
is important, that is the values of the
variable could be ranked (note: no zero
point and distance is not considered).
•Socio-economic status, educational
level, range of income, satisfactory
rating, grades
Interval Level
•tells us that one unit differs by a certain amount of
degree from another unit.
•It categorizes and ranks data
•introduces precise and continuous intervals.
•Temperature, Ph Scale, times of the day
Interval Level
•Interval data are measured using continuous intervals
that show order, direction, and a consistent
difference in values.
•The difference between values on an interval scale
is always evenly distributed.
•Interval datasets have no ‘true zero.
•frequency distribution; mode, median, and mean;
and the range, standard deviation, and variance of a
dataset
Ratio Level
•Highest of four hierarchical levels of
measurement
•The levels, or scales, of measurement
indicate how precisely data is recorded
•the higher the level, the more complex the
measurement is.
•categorizes and ranks data, and uses
continuous intervals
Ratio Level
•categorizes and ranks data, and uses
continuous intervals
•values can be categorized, ordered, have
equal intervals and take on a true zero.
•Height, age, weekly food consumption,
number of people in a household
Identify if it is nominal, ordinal, interval or ratio
1. Workplace status
2.Degree of pain
3. Blood type
4.Degree of sweetness
5.Political preference
6.Length of a pencil
7. Place you live
8.Usual sleeping time
9.Happiness index of the day
10.Brand of laundry soap
04 LEVELS OF MEASUREMENT.pdf

More Related Content

Similar to 04 LEVELS OF MEASUREMENT.pdf

Presentation on nominal and ordinal scales of measurement
Presentation on nominal and ordinal scales of measurementPresentation on nominal and ordinal scales of measurement
Presentation on nominal and ordinal scales of measurementForum of Blended Learning
 
Data, Distribution Introduction and Types - Biostatistics - Ravinandan A P.pdf
Data, Distribution  Introduction and Types - Biostatistics - Ravinandan A P.pdfData, Distribution  Introduction and Types - Biostatistics - Ravinandan A P.pdf
Data, Distribution Introduction and Types - Biostatistics - Ravinandan A P.pdfRavinandan A P
 
fundamentals of data science and analytics on descriptive analysis.pptx
fundamentals of data science and analytics on descriptive analysis.pptxfundamentals of data science and analytics on descriptive analysis.pptx
fundamentals of data science and analytics on descriptive analysis.pptxkumaragurusv
 
Scales of Measurement - Thiyagu
Scales of Measurement - ThiyaguScales of Measurement - Thiyagu
Scales of Measurement - ThiyaguThiyagu K
 
psychometrics ch 2 -2016.ppt
psychometrics ch 2 -2016.pptpsychometrics ch 2 -2016.ppt
psychometrics ch 2 -2016.pptDejeneDay
 
Levels of Measurement
Levels of MeasurementLevels of Measurement
Levels of MeasurementSarfraz Ahmad
 
Levels of measurement
Levels of measurementLevels of measurement
Levels of measurementSarfraz Ahmad
 
Descriptivestatistics
DescriptivestatisticsDescriptivestatistics
DescriptivestatisticsCarla Piper
 
Data Analysis with SPSS PPT.pdf
Data Analysis with SPSS PPT.pdfData Analysis with SPSS PPT.pdf
Data Analysis with SPSS PPT.pdfThanavathi C
 
SCALE , CLASSIFICATION OF SCALE AND IMPORTANCE OF SCALING TECHNIQUES.pptx
SCALE , CLASSIFICATION OF SCALE AND IMPORTANCE OF SCALING TECHNIQUES.pptxSCALE , CLASSIFICATION OF SCALE AND IMPORTANCE OF SCALING TECHNIQUES.pptx
SCALE , CLASSIFICATION OF SCALE AND IMPORTANCE OF SCALING TECHNIQUES.pptxAnshutChitransh
 
Sampling-A compact study of different types of sample
Sampling-A compact study of different types of sampleSampling-A compact study of different types of sample
Sampling-A compact study of different types of sampleAsith Paul.K
 
Descriptive statistics
Descriptive statisticsDescriptive statistics
Descriptive statisticsHiba Armouche
 
Scales of Measurements.pptx
Scales of Measurements.pptxScales of Measurements.pptx
Scales of Measurements.pptxrajalakshmi5921
 
Measurement & Scaling Techniques
Measurement & Scaling TechniquesMeasurement & Scaling Techniques
Measurement & Scaling TechniquesSahadev Tomar
 

Similar to 04 LEVELS OF MEASUREMENT.pdf (20)

Presentation on nominal and ordinal scales of measurement
Presentation on nominal and ordinal scales of measurementPresentation on nominal and ordinal scales of measurement
Presentation on nominal and ordinal scales of measurement
 
Data, Distribution Introduction and Types - Biostatistics - Ravinandan A P.pdf
Data, Distribution  Introduction and Types - Biostatistics - Ravinandan A P.pdfData, Distribution  Introduction and Types - Biostatistics - Ravinandan A P.pdf
Data, Distribution Introduction and Types - Biostatistics - Ravinandan A P.pdf
 
fundamentals of data science and analytics on descriptive analysis.pptx
fundamentals of data science and analytics on descriptive analysis.pptxfundamentals of data science and analytics on descriptive analysis.pptx
fundamentals of data science and analytics on descriptive analysis.pptx
 
Scales of measurement
 Scales of measurement Scales of measurement
Scales of measurement
 
Scales of Measurement - Thiyagu
Scales of Measurement - ThiyaguScales of Measurement - Thiyagu
Scales of Measurement - Thiyagu
 
PRESENTATION.pptx
PRESENTATION.pptxPRESENTATION.pptx
PRESENTATION.pptx
 
psychometrics ch 2 -2016.ppt
psychometrics ch 2 -2016.pptpsychometrics ch 2 -2016.ppt
psychometrics ch 2 -2016.ppt
 
Levels of Measurement
Levels of MeasurementLevels of Measurement
Levels of Measurement
 
Levels of measurement
Levels of measurementLevels of measurement
Levels of measurement
 
Descriptivestatistics
DescriptivestatisticsDescriptivestatistics
Descriptivestatistics
 
Data Analysis with SPSS PPT.pdf
Data Analysis with SPSS PPT.pdfData Analysis with SPSS PPT.pdf
Data Analysis with SPSS PPT.pdf
 
SCALE , CLASSIFICATION OF SCALE AND IMPORTANCE OF SCALING TECHNIQUES.pptx
SCALE , CLASSIFICATION OF SCALE AND IMPORTANCE OF SCALING TECHNIQUES.pptxSCALE , CLASSIFICATION OF SCALE AND IMPORTANCE OF SCALING TECHNIQUES.pptx
SCALE , CLASSIFICATION OF SCALE AND IMPORTANCE OF SCALING TECHNIQUES.pptx
 
Unit 4.pptx
Unit 4.pptxUnit 4.pptx
Unit 4.pptx
 
Sampling-A compact study of different types of sample
Sampling-A compact study of different types of sampleSampling-A compact study of different types of sample
Sampling-A compact study of different types of sample
 
Descriptive statistics
Descriptive statisticsDescriptive statistics
Descriptive statistics
 
Scales of Measurements.pptx
Scales of Measurements.pptxScales of Measurements.pptx
Scales of Measurements.pptx
 
Measurementand scaling-10
Measurementand scaling-10Measurementand scaling-10
Measurementand scaling-10
 
1 introduction to psychological statistics
1 introduction to psychological statistics1 introduction to psychological statistics
1 introduction to psychological statistics
 
Variables.pdf
Variables.pdfVariables.pdf
Variables.pdf
 
Measurement & Scaling Techniques
Measurement & Scaling TechniquesMeasurement & Scaling Techniques
Measurement & Scaling Techniques
 

More from binoy ly

05 Data pRESENTATION.pdf
05 Data pRESENTATION.pdf05 Data pRESENTATION.pdf
05 Data pRESENTATION.pdfbinoy ly
 
03 Basic Terms in Statistics.pdf
03 Basic Terms in Statistics.pdf03 Basic Terms in Statistics.pdf
03 Basic Terms in Statistics.pdfbinoy ly
 
02 CONTEXTUALIZATION OF DATA.pdf
02 CONTEXTUALIZATION OF DATA.pdf02 CONTEXTUALIZATION OF DATA.pdf
02 CONTEXTUALIZATION OF DATA.pdfbinoy ly
 
01 Introducing Statistics.pdf
01 Introducing Statistics.pdf01 Introducing Statistics.pdf
01 Introducing Statistics.pdfbinoy ly
 
LEVELs of measurement.pptx
LEVELs of measurement.pptxLEVELs of measurement.pptx
LEVELs of measurement.pptxbinoy ly
 
Illustrating Random Variables and Distinguishing Between a Discrete.pptx
Illustrating Random Variables and Distinguishing Between a Discrete.pptxIllustrating Random Variables and Distinguishing Between a Discrete.pptx
Illustrating Random Variables and Distinguishing Between a Discrete.pptxbinoy ly
 

More from binoy ly (6)

05 Data pRESENTATION.pdf
05 Data pRESENTATION.pdf05 Data pRESENTATION.pdf
05 Data pRESENTATION.pdf
 
03 Basic Terms in Statistics.pdf
03 Basic Terms in Statistics.pdf03 Basic Terms in Statistics.pdf
03 Basic Terms in Statistics.pdf
 
02 CONTEXTUALIZATION OF DATA.pdf
02 CONTEXTUALIZATION OF DATA.pdf02 CONTEXTUALIZATION OF DATA.pdf
02 CONTEXTUALIZATION OF DATA.pdf
 
01 Introducing Statistics.pdf
01 Introducing Statistics.pdf01 Introducing Statistics.pdf
01 Introducing Statistics.pdf
 
LEVELs of measurement.pptx
LEVELs of measurement.pptxLEVELs of measurement.pptx
LEVELs of measurement.pptx
 
Illustrating Random Variables and Distinguishing Between a Discrete.pptx
Illustrating Random Variables and Distinguishing Between a Discrete.pptxIllustrating Random Variables and Distinguishing Between a Discrete.pptx
Illustrating Random Variables and Distinguishing Between a Discrete.pptx
 

Recently uploaded

Software Engineering Methodologies (overview)
Software Engineering Methodologies (overview)Software Engineering Methodologies (overview)
Software Engineering Methodologies (overview)eniolaolutunde
 
Kisan Call Centre - To harness potential of ICT in Agriculture by answer farm...
Kisan Call Centre - To harness potential of ICT in Agriculture by answer farm...Kisan Call Centre - To harness potential of ICT in Agriculture by answer farm...
Kisan Call Centre - To harness potential of ICT in Agriculture by answer farm...Krashi Coaching
 
Hybridoma Technology ( Production , Purification , and Application )
Hybridoma Technology  ( Production , Purification , and Application  ) Hybridoma Technology  ( Production , Purification , and Application  )
Hybridoma Technology ( Production , Purification , and Application ) Sakshi Ghasle
 
Q4-W6-Restating Informational Text Grade 3
Q4-W6-Restating Informational Text Grade 3Q4-W6-Restating Informational Text Grade 3
Q4-W6-Restating Informational Text Grade 3JemimahLaneBuaron
 
SOCIAL AND HISTORICAL CONTEXT - LFTVD.pptx
SOCIAL AND HISTORICAL CONTEXT - LFTVD.pptxSOCIAL AND HISTORICAL CONTEXT - LFTVD.pptx
SOCIAL AND HISTORICAL CONTEXT - LFTVD.pptxiammrhaywood
 
BASLIQ CURRENT LOOKBOOK LOOKBOOK(1) (1).pdf
BASLIQ CURRENT LOOKBOOK  LOOKBOOK(1) (1).pdfBASLIQ CURRENT LOOKBOOK  LOOKBOOK(1) (1).pdf
BASLIQ CURRENT LOOKBOOK LOOKBOOK(1) (1).pdfSoniaTolstoy
 
Paris 2024 Olympic Geographies - an activity
Paris 2024 Olympic Geographies - an activityParis 2024 Olympic Geographies - an activity
Paris 2024 Olympic Geographies - an activityGeoBlogs
 
The basics of sentences session 2pptx copy.pptx
The basics of sentences session 2pptx copy.pptxThe basics of sentences session 2pptx copy.pptx
The basics of sentences session 2pptx copy.pptxheathfieldcps1
 
18-04-UA_REPORT_MEDIALITERAСY_INDEX-DM_23-1-final-eng.pdf
18-04-UA_REPORT_MEDIALITERAСY_INDEX-DM_23-1-final-eng.pdf18-04-UA_REPORT_MEDIALITERAСY_INDEX-DM_23-1-final-eng.pdf
18-04-UA_REPORT_MEDIALITERAСY_INDEX-DM_23-1-final-eng.pdfssuser54595a
 
Measures of Central Tendency: Mean, Median and Mode
Measures of Central Tendency: Mean, Median and ModeMeasures of Central Tendency: Mean, Median and Mode
Measures of Central Tendency: Mean, Median and ModeThiyagu K
 
Z Score,T Score, Percential Rank and Box Plot Graph
Z Score,T Score, Percential Rank and Box Plot GraphZ Score,T Score, Percential Rank and Box Plot Graph
Z Score,T Score, Percential Rank and Box Plot GraphThiyagu K
 
Call Girls in Dwarka Mor Delhi Contact Us 9654467111
Call Girls in Dwarka Mor Delhi Contact Us 9654467111Call Girls in Dwarka Mor Delhi Contact Us 9654467111
Call Girls in Dwarka Mor Delhi Contact Us 9654467111Sapana Sha
 
Employee wellbeing at the workplace.pptx
Employee wellbeing at the workplace.pptxEmployee wellbeing at the workplace.pptx
Employee wellbeing at the workplace.pptxNirmalaLoungPoorunde1
 
Nutritional Needs Presentation - HLTH 104
Nutritional Needs Presentation - HLTH 104Nutritional Needs Presentation - HLTH 104
Nutritional Needs Presentation - HLTH 104misteraugie
 
Accessible design: Minimum effort, maximum impact
Accessible design: Minimum effort, maximum impactAccessible design: Minimum effort, maximum impact
Accessible design: Minimum effort, maximum impactdawncurless
 
Contemporary philippine arts from the regions_PPT_Module_12 [Autosaved] (1).pptx
Contemporary philippine arts from the regions_PPT_Module_12 [Autosaved] (1).pptxContemporary philippine arts from the regions_PPT_Module_12 [Autosaved] (1).pptx
Contemporary philippine arts from the regions_PPT_Module_12 [Autosaved] (1).pptxRoyAbrique
 
Activity 01 - Artificial Culture (1).pdf
Activity 01 - Artificial Culture (1).pdfActivity 01 - Artificial Culture (1).pdf
Activity 01 - Artificial Culture (1).pdfciinovamais
 
URLs and Routing in the Odoo 17 Website App
URLs and Routing in the Odoo 17 Website AppURLs and Routing in the Odoo 17 Website App
URLs and Routing in the Odoo 17 Website AppCeline George
 
“Oh GOSH! Reflecting on Hackteria's Collaborative Practices in a Global Do-It...
“Oh GOSH! Reflecting on Hackteria's Collaborative Practices in a Global Do-It...“Oh GOSH! Reflecting on Hackteria's Collaborative Practices in a Global Do-It...
“Oh GOSH! Reflecting on Hackteria's Collaborative Practices in a Global Do-It...Marc Dusseiller Dusjagr
 

Recently uploaded (20)

TataKelola dan KamSiber Kecerdasan Buatan v022.pdf
TataKelola dan KamSiber Kecerdasan Buatan v022.pdfTataKelola dan KamSiber Kecerdasan Buatan v022.pdf
TataKelola dan KamSiber Kecerdasan Buatan v022.pdf
 
Software Engineering Methodologies (overview)
Software Engineering Methodologies (overview)Software Engineering Methodologies (overview)
Software Engineering Methodologies (overview)
 
Kisan Call Centre - To harness potential of ICT in Agriculture by answer farm...
Kisan Call Centre - To harness potential of ICT in Agriculture by answer farm...Kisan Call Centre - To harness potential of ICT in Agriculture by answer farm...
Kisan Call Centre - To harness potential of ICT in Agriculture by answer farm...
 
Hybridoma Technology ( Production , Purification , and Application )
Hybridoma Technology  ( Production , Purification , and Application  ) Hybridoma Technology  ( Production , Purification , and Application  )
Hybridoma Technology ( Production , Purification , and Application )
 
Q4-W6-Restating Informational Text Grade 3
Q4-W6-Restating Informational Text Grade 3Q4-W6-Restating Informational Text Grade 3
Q4-W6-Restating Informational Text Grade 3
 
SOCIAL AND HISTORICAL CONTEXT - LFTVD.pptx
SOCIAL AND HISTORICAL CONTEXT - LFTVD.pptxSOCIAL AND HISTORICAL CONTEXT - LFTVD.pptx
SOCIAL AND HISTORICAL CONTEXT - LFTVD.pptx
 
BASLIQ CURRENT LOOKBOOK LOOKBOOK(1) (1).pdf
BASLIQ CURRENT LOOKBOOK  LOOKBOOK(1) (1).pdfBASLIQ CURRENT LOOKBOOK  LOOKBOOK(1) (1).pdf
BASLIQ CURRENT LOOKBOOK LOOKBOOK(1) (1).pdf
 
Paris 2024 Olympic Geographies - an activity
Paris 2024 Olympic Geographies - an activityParis 2024 Olympic Geographies - an activity
Paris 2024 Olympic Geographies - an activity
 
The basics of sentences session 2pptx copy.pptx
The basics of sentences session 2pptx copy.pptxThe basics of sentences session 2pptx copy.pptx
The basics of sentences session 2pptx copy.pptx
 
18-04-UA_REPORT_MEDIALITERAСY_INDEX-DM_23-1-final-eng.pdf
18-04-UA_REPORT_MEDIALITERAСY_INDEX-DM_23-1-final-eng.pdf18-04-UA_REPORT_MEDIALITERAСY_INDEX-DM_23-1-final-eng.pdf
18-04-UA_REPORT_MEDIALITERAСY_INDEX-DM_23-1-final-eng.pdf
 
Measures of Central Tendency: Mean, Median and Mode
Measures of Central Tendency: Mean, Median and ModeMeasures of Central Tendency: Mean, Median and Mode
Measures of Central Tendency: Mean, Median and Mode
 
Z Score,T Score, Percential Rank and Box Plot Graph
Z Score,T Score, Percential Rank and Box Plot GraphZ Score,T Score, Percential Rank and Box Plot Graph
Z Score,T Score, Percential Rank and Box Plot Graph
 
Call Girls in Dwarka Mor Delhi Contact Us 9654467111
Call Girls in Dwarka Mor Delhi Contact Us 9654467111Call Girls in Dwarka Mor Delhi Contact Us 9654467111
Call Girls in Dwarka Mor Delhi Contact Us 9654467111
 
Employee wellbeing at the workplace.pptx
Employee wellbeing at the workplace.pptxEmployee wellbeing at the workplace.pptx
Employee wellbeing at the workplace.pptx
 
Nutritional Needs Presentation - HLTH 104
Nutritional Needs Presentation - HLTH 104Nutritional Needs Presentation - HLTH 104
Nutritional Needs Presentation - HLTH 104
 
Accessible design: Minimum effort, maximum impact
Accessible design: Minimum effort, maximum impactAccessible design: Minimum effort, maximum impact
Accessible design: Minimum effort, maximum impact
 
Contemporary philippine arts from the regions_PPT_Module_12 [Autosaved] (1).pptx
Contemporary philippine arts from the regions_PPT_Module_12 [Autosaved] (1).pptxContemporary philippine arts from the regions_PPT_Module_12 [Autosaved] (1).pptx
Contemporary philippine arts from the regions_PPT_Module_12 [Autosaved] (1).pptx
 
Activity 01 - Artificial Culture (1).pdf
Activity 01 - Artificial Culture (1).pdfActivity 01 - Artificial Culture (1).pdf
Activity 01 - Artificial Culture (1).pdf
 
URLs and Routing in the Odoo 17 Website App
URLs and Routing in the Odoo 17 Website AppURLs and Routing in the Odoo 17 Website App
URLs and Routing in the Odoo 17 Website App
 
“Oh GOSH! Reflecting on Hackteria's Collaborative Practices in a Global Do-It...
“Oh GOSH! Reflecting on Hackteria's Collaborative Practices in a Global Do-It...“Oh GOSH! Reflecting on Hackteria's Collaborative Practices in a Global Do-It...
“Oh GOSH! Reflecting on Hackteria's Collaborative Practices in a Global Do-It...
 

04 LEVELS OF MEASUREMENT.pdf

  • 2. OBJECTIVE: •to identify and differentiate the different levels of measurement and methods of data collection
  • 4. NOMINAL LEVEL •A measurement arises when we have variables that are categorical and non- numeric or where the numbers have no sense of ordering EX. Numbers on the uniform, Sex, Marital status, religion affiliation, college major, blood type
  • 5. Ordinal level •deals with categorical variables like the nominal level, but in this level ordering is important, that is the values of the variable could be ranked (note: no zero point and distance is not considered). •Socio-economic status, educational level, range of income, satisfactory rating, grades
  • 6. Interval Level •tells us that one unit differs by a certain amount of degree from another unit. •It categorizes and ranks data •introduces precise and continuous intervals. •Temperature, Ph Scale, times of the day
  • 7. Interval Level •Interval data are measured using continuous intervals that show order, direction, and a consistent difference in values. •The difference between values on an interval scale is always evenly distributed. •Interval datasets have no ‘true zero. •frequency distribution; mode, median, and mean; and the range, standard deviation, and variance of a dataset
  • 8. Ratio Level •Highest of four hierarchical levels of measurement •The levels, or scales, of measurement indicate how precisely data is recorded •the higher the level, the more complex the measurement is. •categorizes and ranks data, and uses continuous intervals
  • 9. Ratio Level •categorizes and ranks data, and uses continuous intervals •values can be categorized, ordered, have equal intervals and take on a true zero. •Height, age, weekly food consumption, number of people in a household
  • 10. Identify if it is nominal, ordinal, interval or ratio 1. Workplace status 2.Degree of pain 3. Blood type 4.Degree of sweetness 5.Political preference 6.Length of a pencil 7. Place you live 8.Usual sleeping time 9.Happiness index of the day 10.Brand of laundry soap