Download to read offline
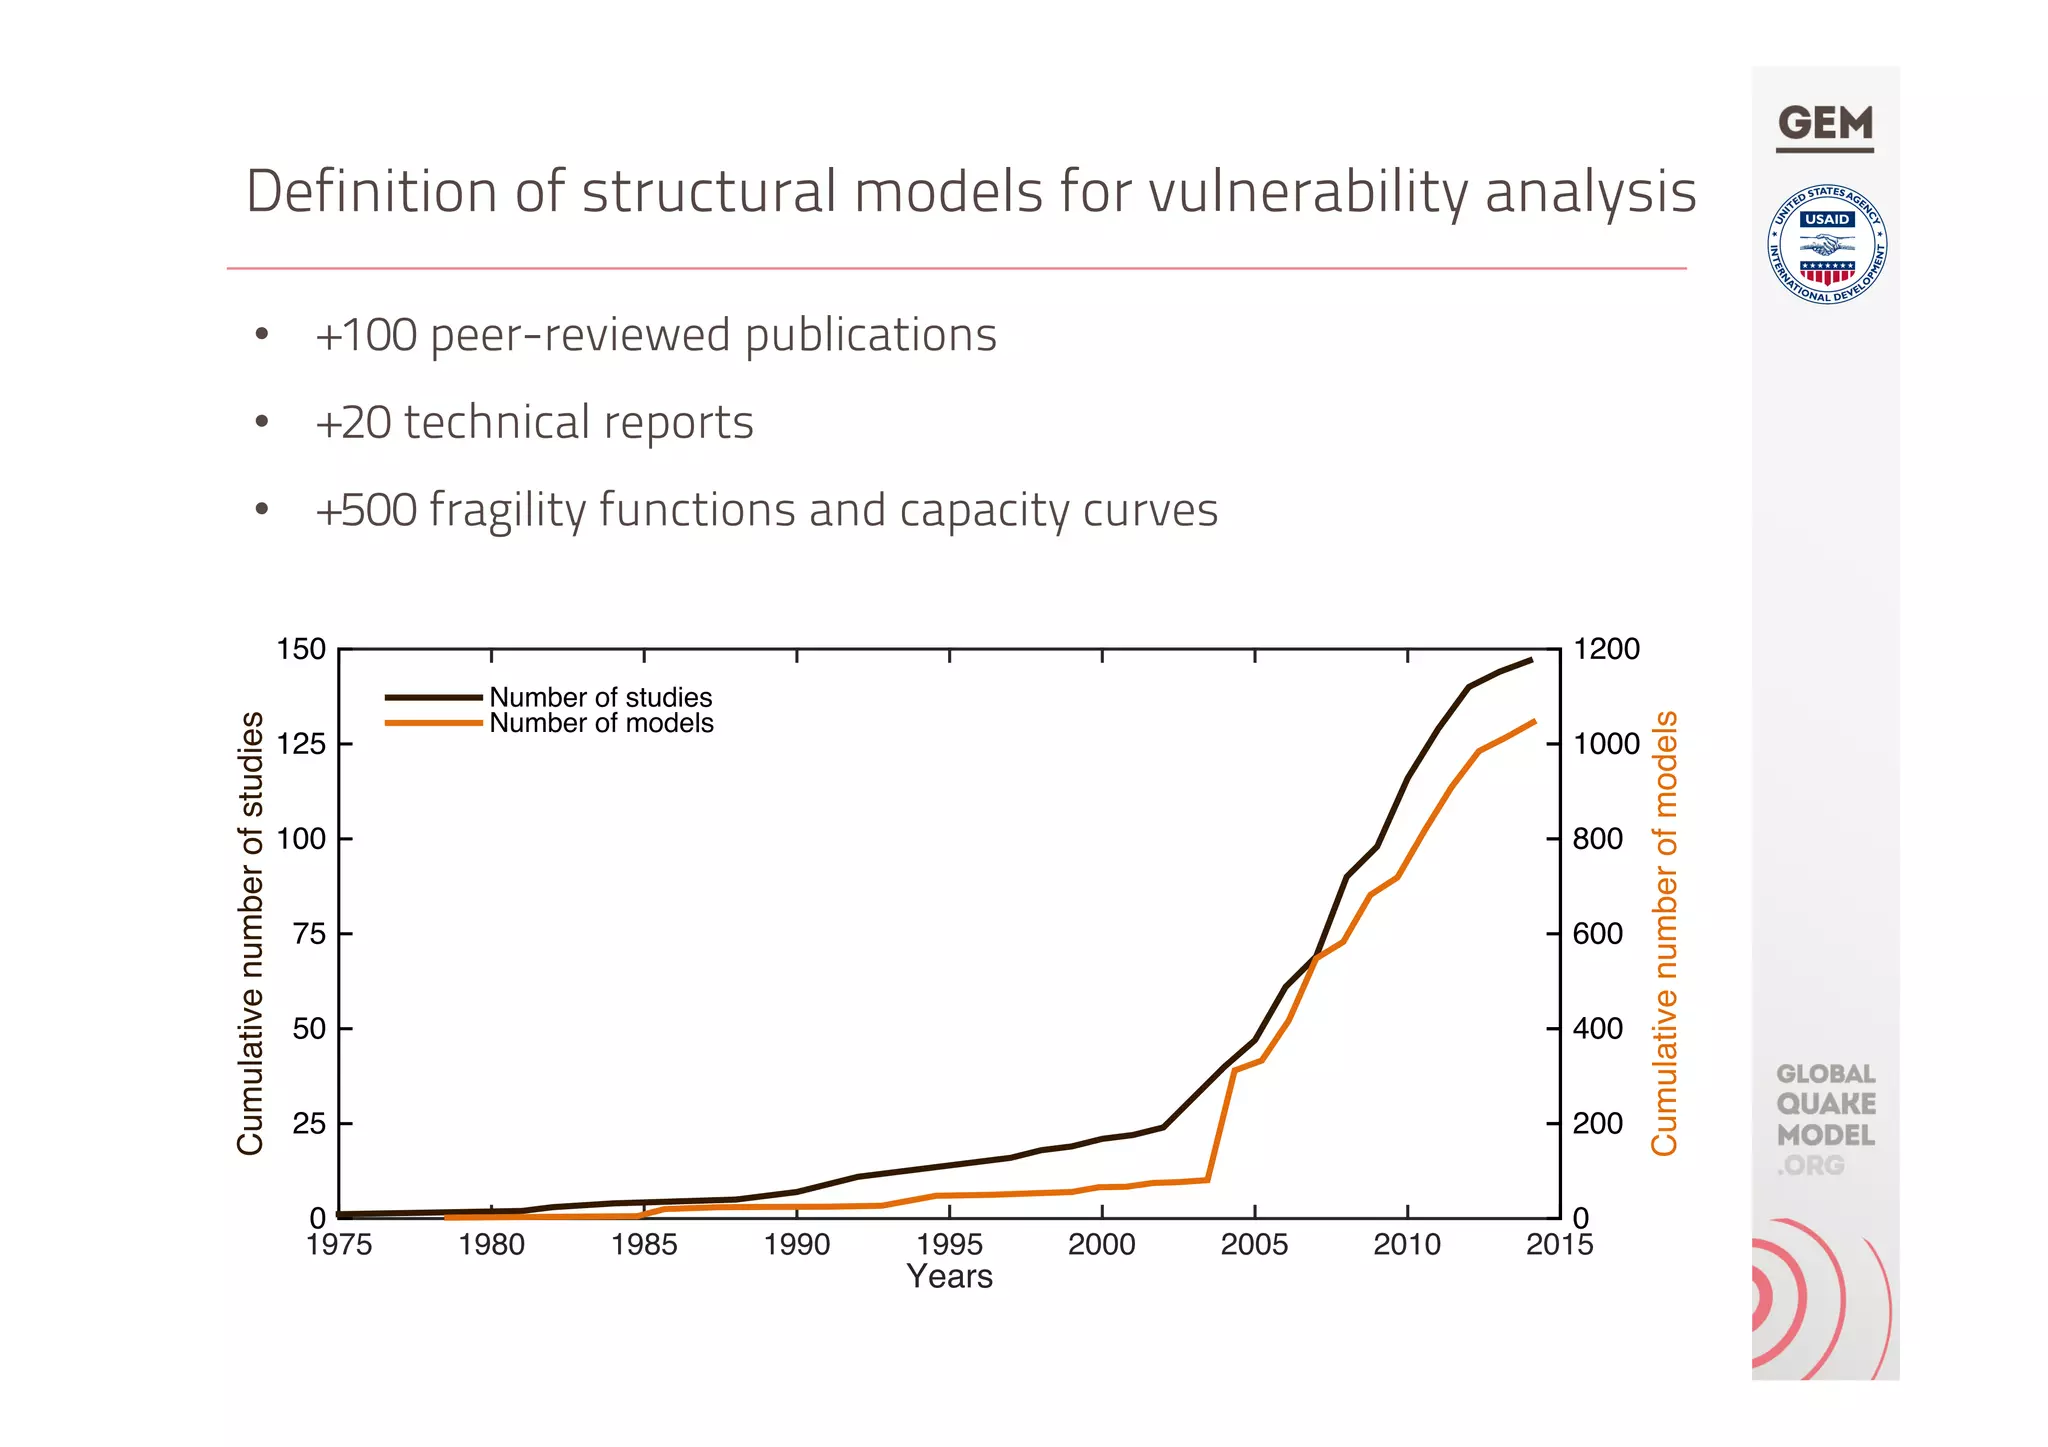
![MDOF
Simplification of 3D or 2D structures into a SDOF
he equivalent SDOF system can be either elastic or inelastic de-
ending on the chosen inelastic analysis method (see Section
.1.3).
he computation of the pushover curve and the subsequent deter-
mination of the properties of the equivalent SDOF system are thor-
ughly discussed in Section 7.2.
Global deformations ∆
Detailed
model
Static force
sing monotonically
m*
h*k*
Equivalent SDOF
system
0
1
2
3
0.0 0.1 0.2 0.3
Global deformation ∆ [m]
HorizontalforceV[MN]
ushover curve“
linear, inelastic
ormation relationship
ndamentals of Seismic Design”
Substitute SDoF structure
Effective displacement
(design displacement)
Effective mass
Effective height ( ) ( )¦¦
==
∆∆=
n
i
ii
n
i
iiie
mHmH
11
/
( ) ( )¦¦
==
∆∆=∆
n
i
ii
n
i
iid
mm
11
2
/
( ) d
n
i
iie
mm ∆∆= ¦
=
/
1
He
me
He
me ∆d
∆i
∆i-1
∆3
∆2
∆1
He
me
He
me ∆d
∆i
∆i-1
∆3
∆2
∆1
Cours
SDOF
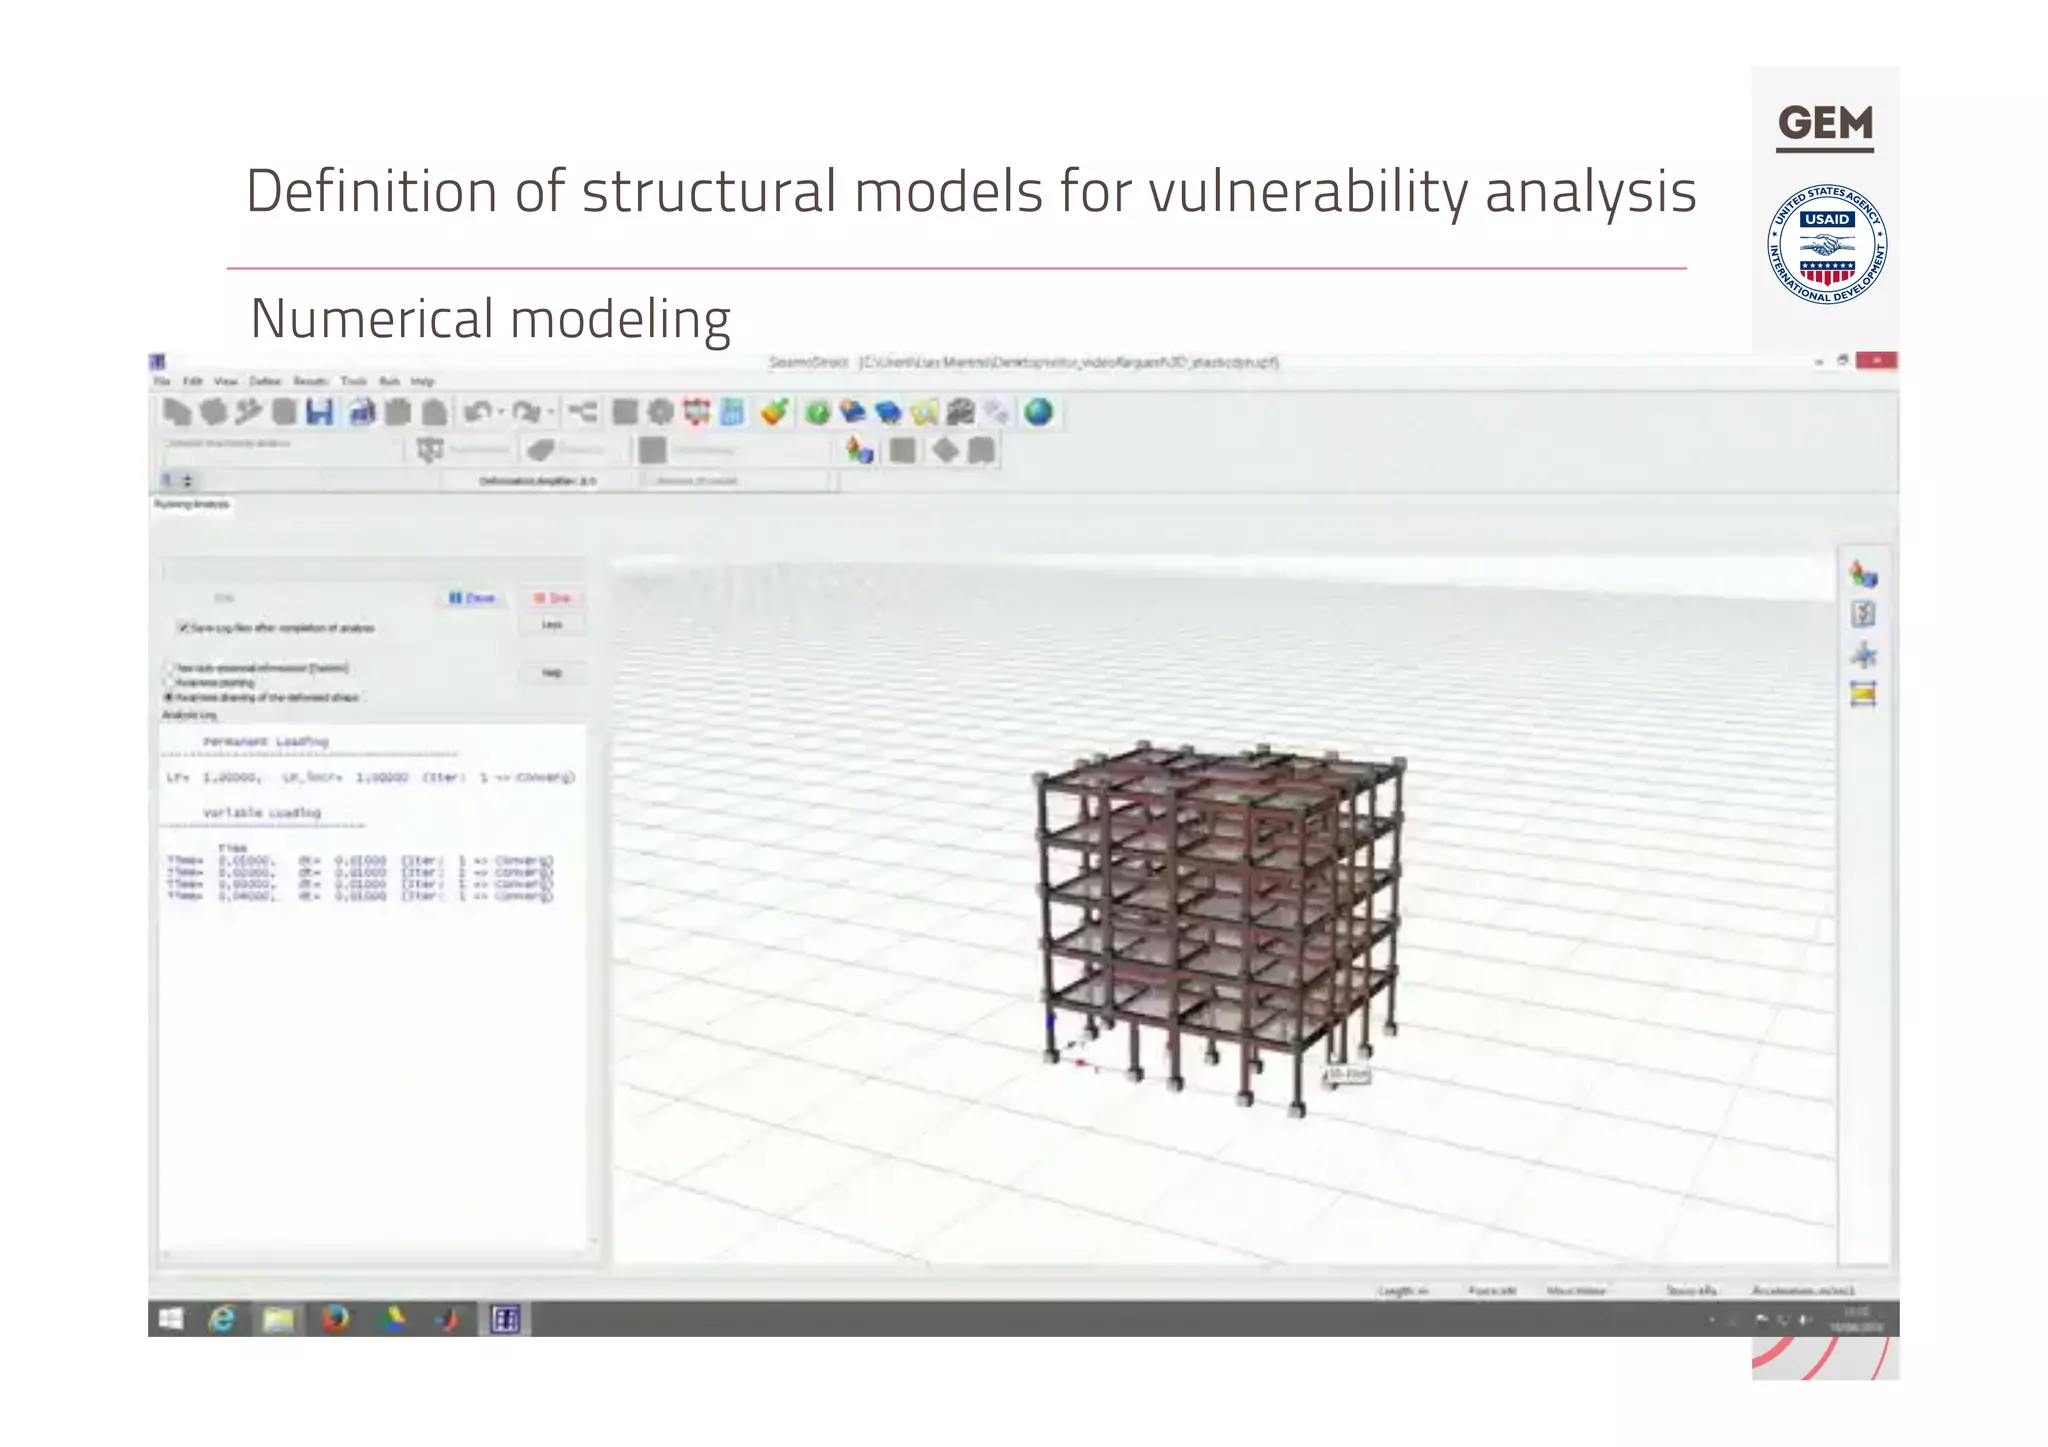
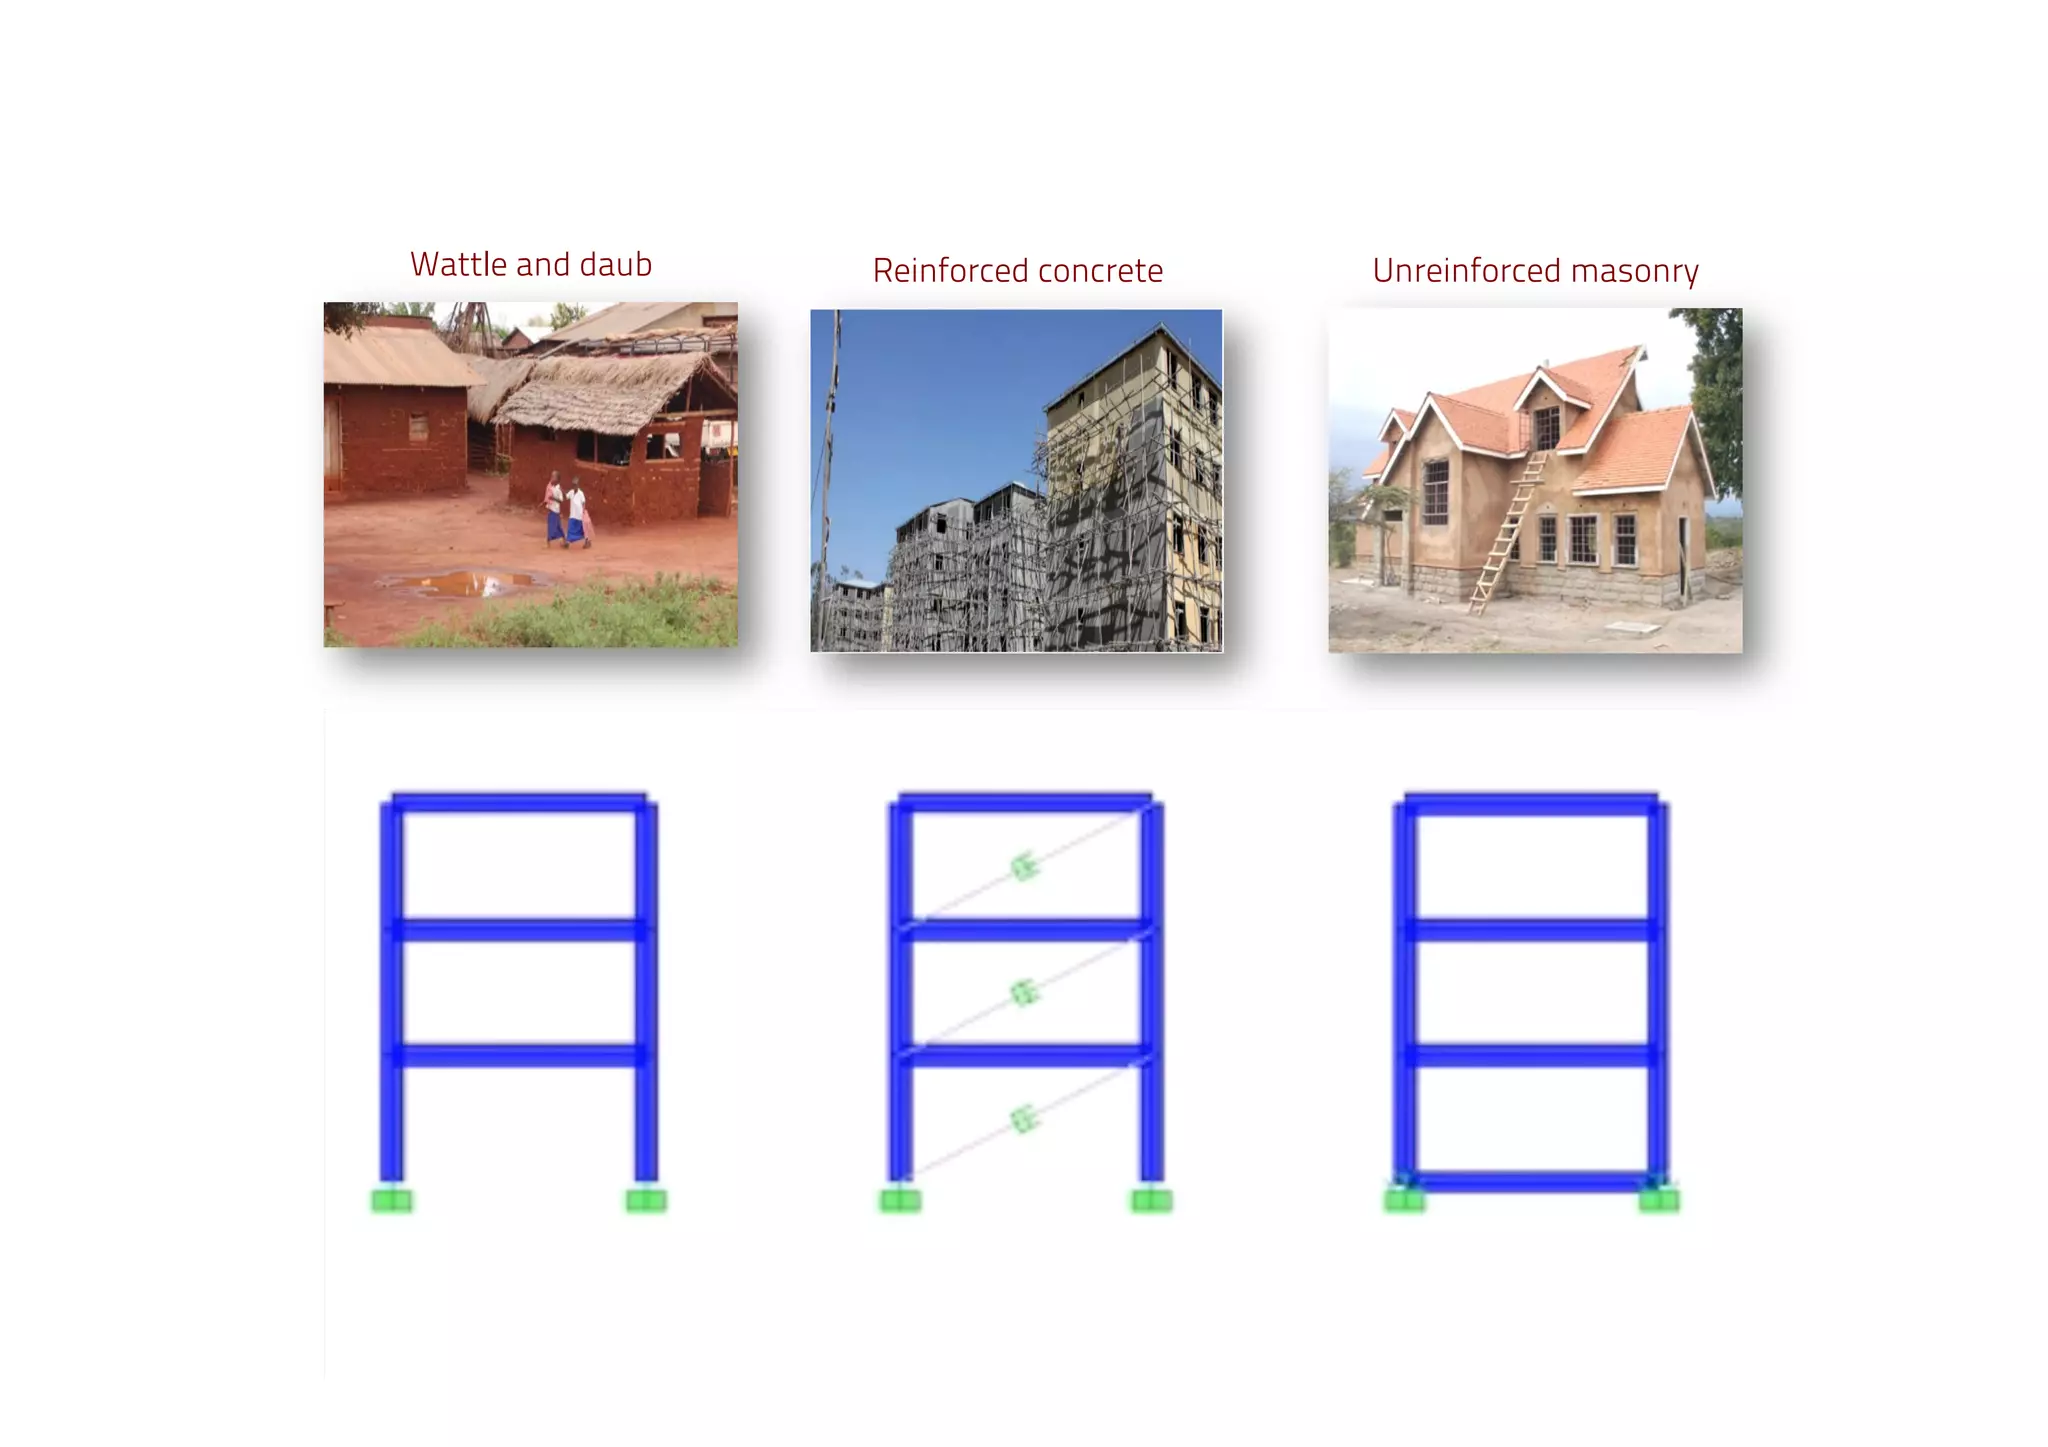
Definition of structural models for vulnerability analysis
−0.25 −0.2 −0.15 −0.1 −0.05 0 0.05 0.1 0.15 0.2 0.25
−0.5
−0.4
−0.3
−0.2
−0.1
0
0.1
0.2
0.3
0.4
0.5
Sd [m]
Sa[g]
sdof
pinching4
Hysteresis model](https://image.slidesharecdn.com/05-ccaravulnerability-180517141444/75/05-ccara-vulnerability-17-2048.jpg)
![Derivation of Fragility/Vulnerability functions
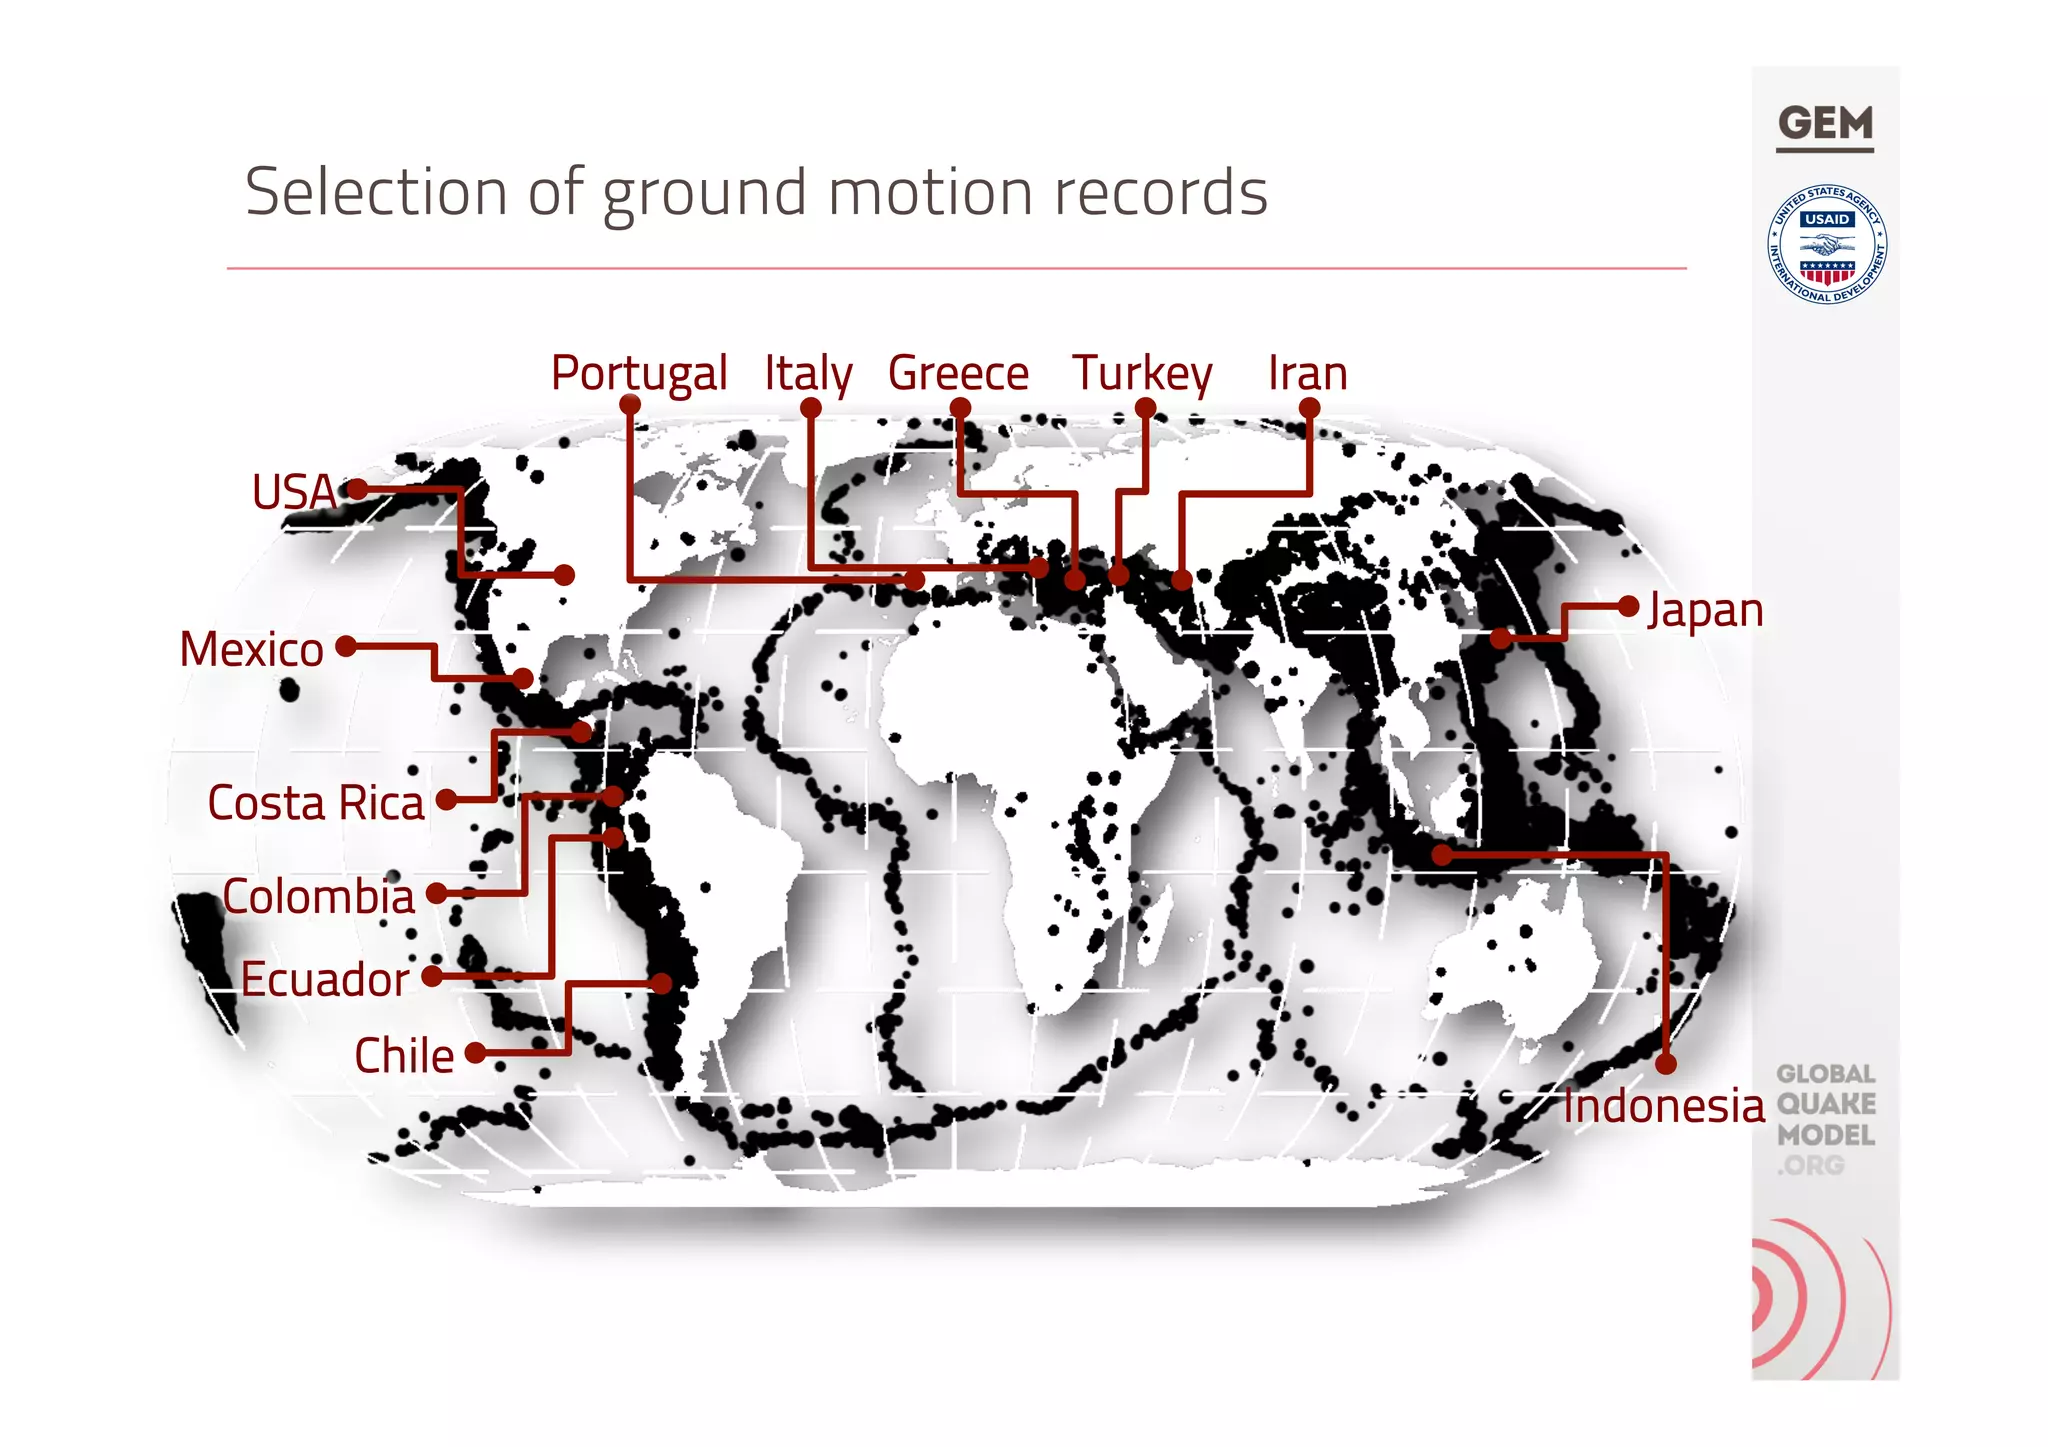
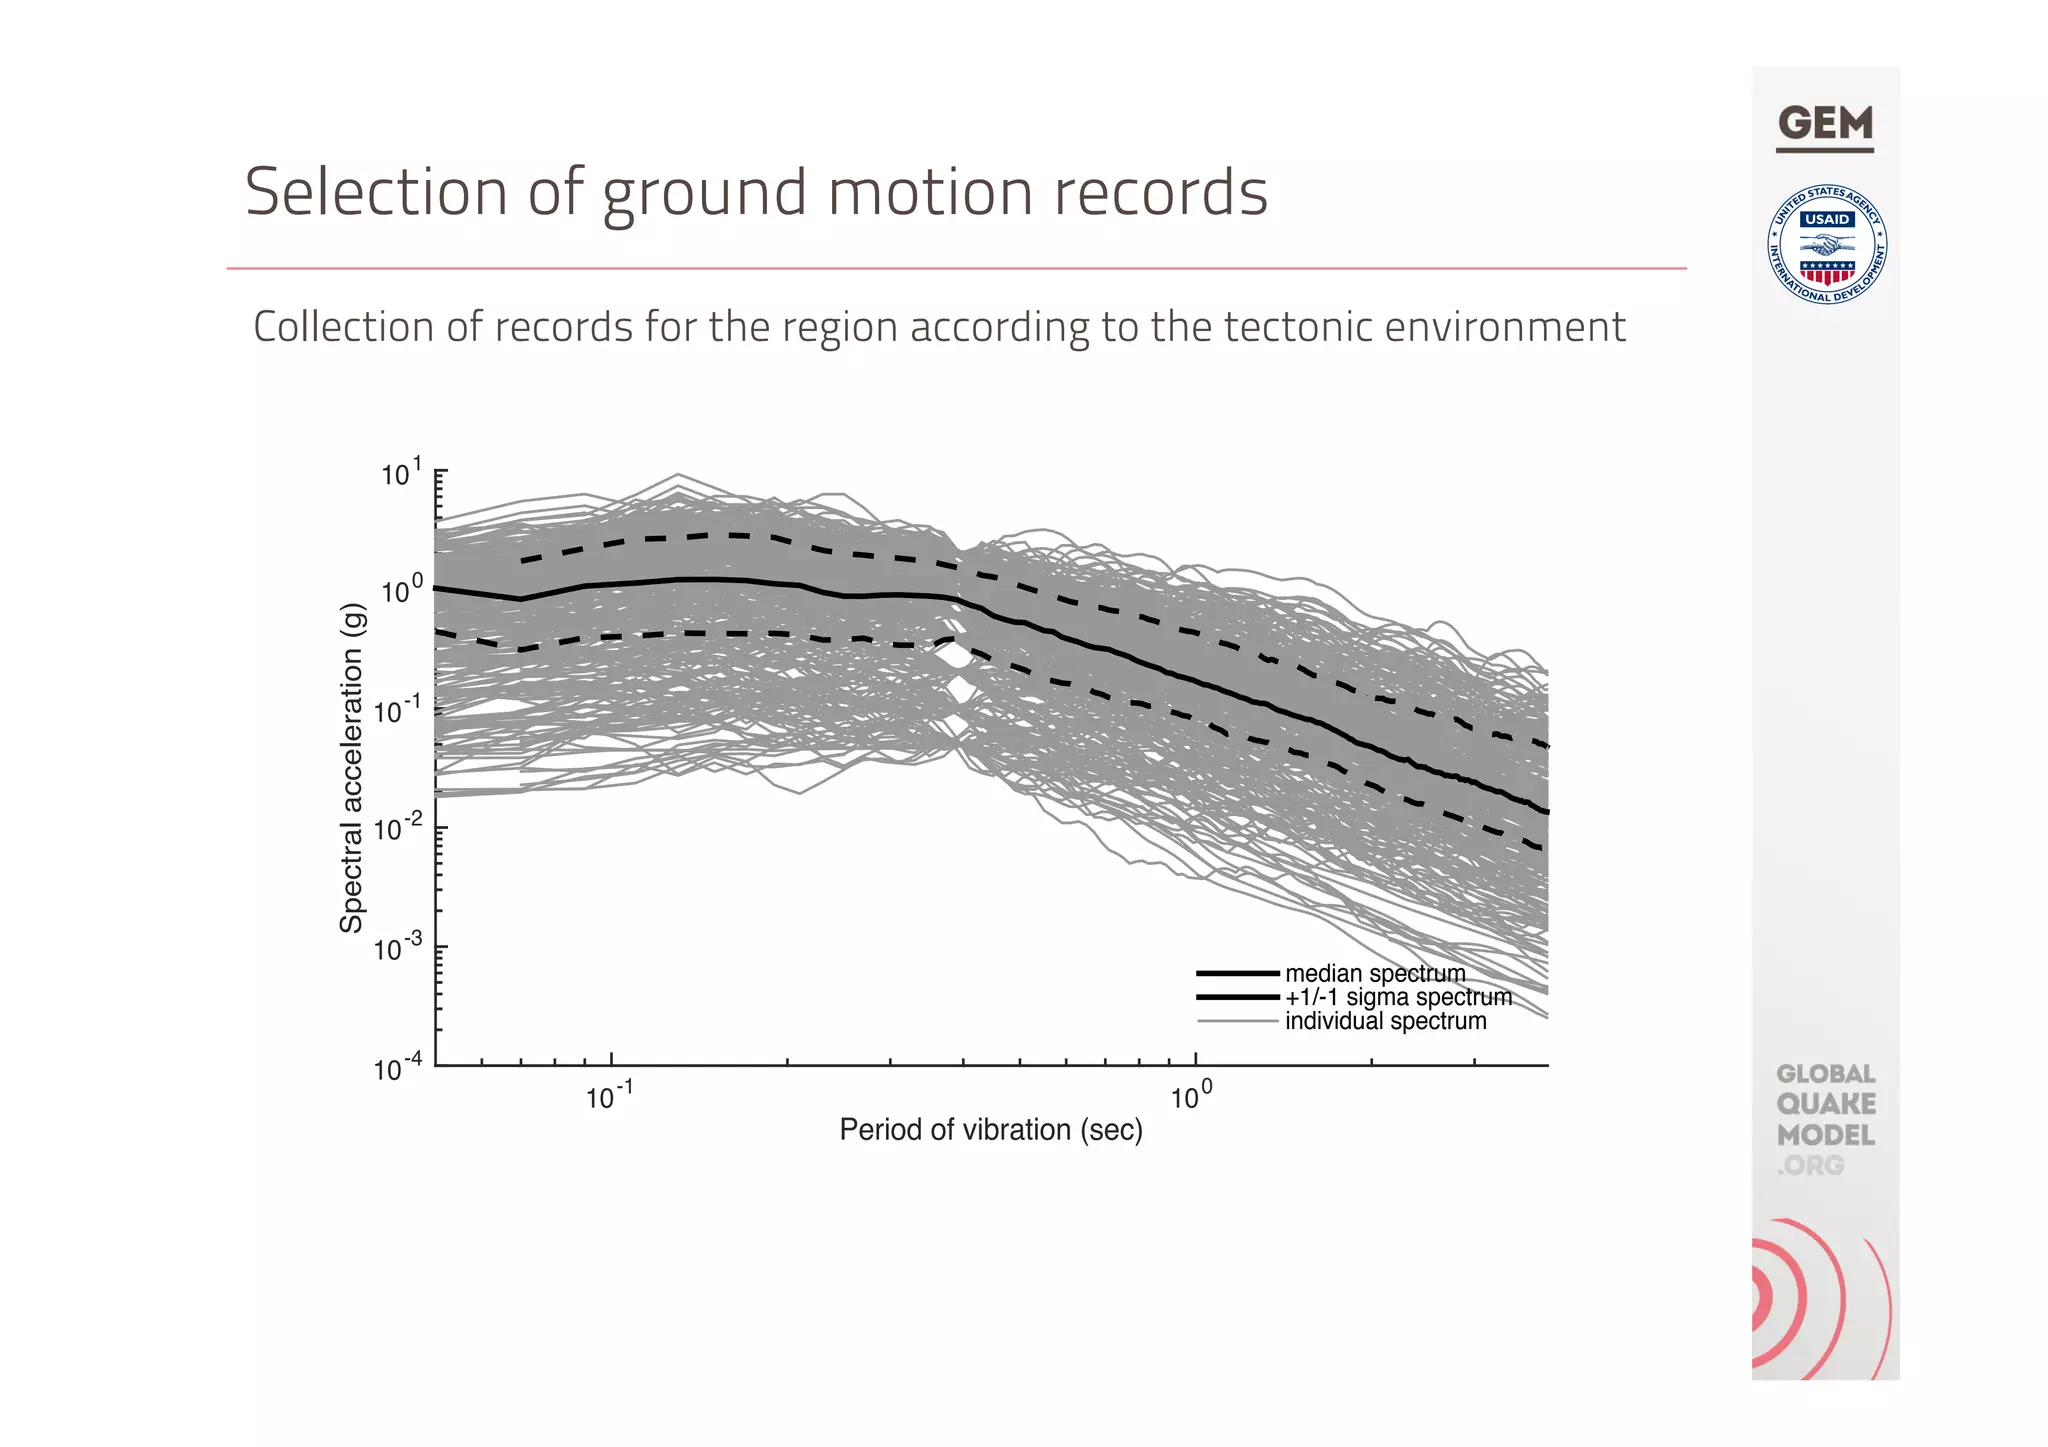
Ground motion
records
Single degree of
freedom systems
Period of vibration (sec)
10
-1
10
0
Spectralacceleration(g)
10
-4
10
-3
10
-2
10
-1
10
0
101
median spectrum
+1/-1 sigma spectrum
individual spectrum
Spectral displacement (m)
0 0.1 0.2 0.3 0.4 0.5
Spectralacceleration(g)
0
0.1
0.2
0.3
0.4
0.5
0.6
0.7
0.8
0.9
median curve
+1/-1 sigma curve
sampled curve
Risk Modelers
Toolkit
Spectral acceleration at 0.3 s [g]
0 0.2 0.4 0.6 0.8 1 1.2
Probabilityofexceedance
0
0.1
0.2
0.3
0.4
0.5
0.6
0.7
0.8
0.9
1
Limit state 1
Limit state 2
Limit state 3
Limit state 4](https://image.slidesharecdn.com/05-ccaravulnerability-180517141444/75/05-ccara-vulnerability-22-2048.jpg)

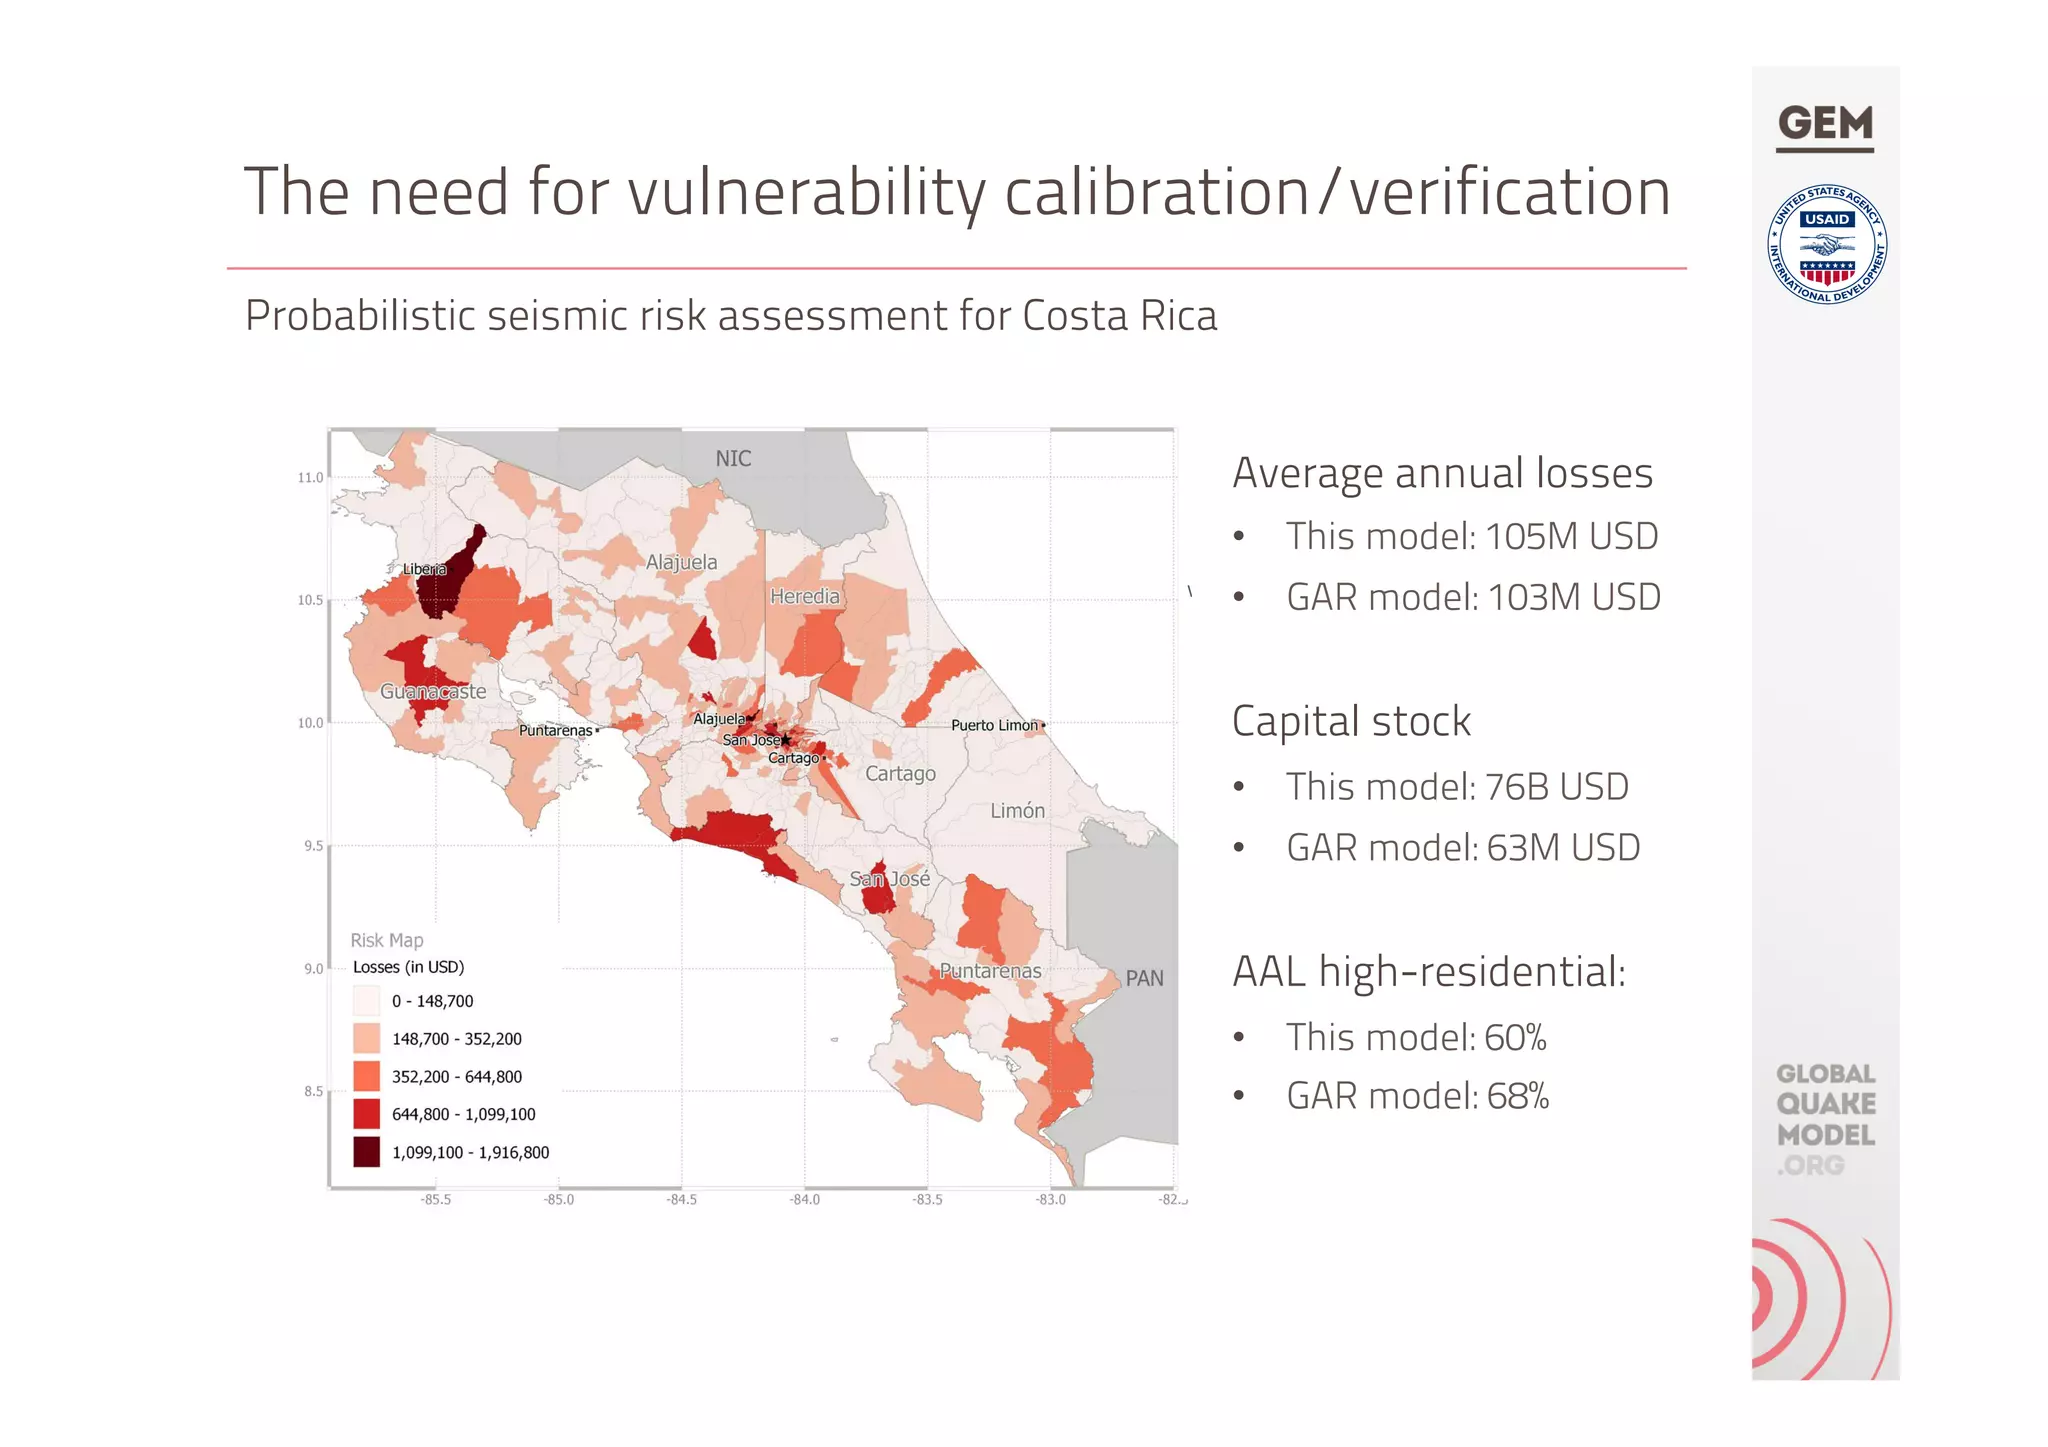


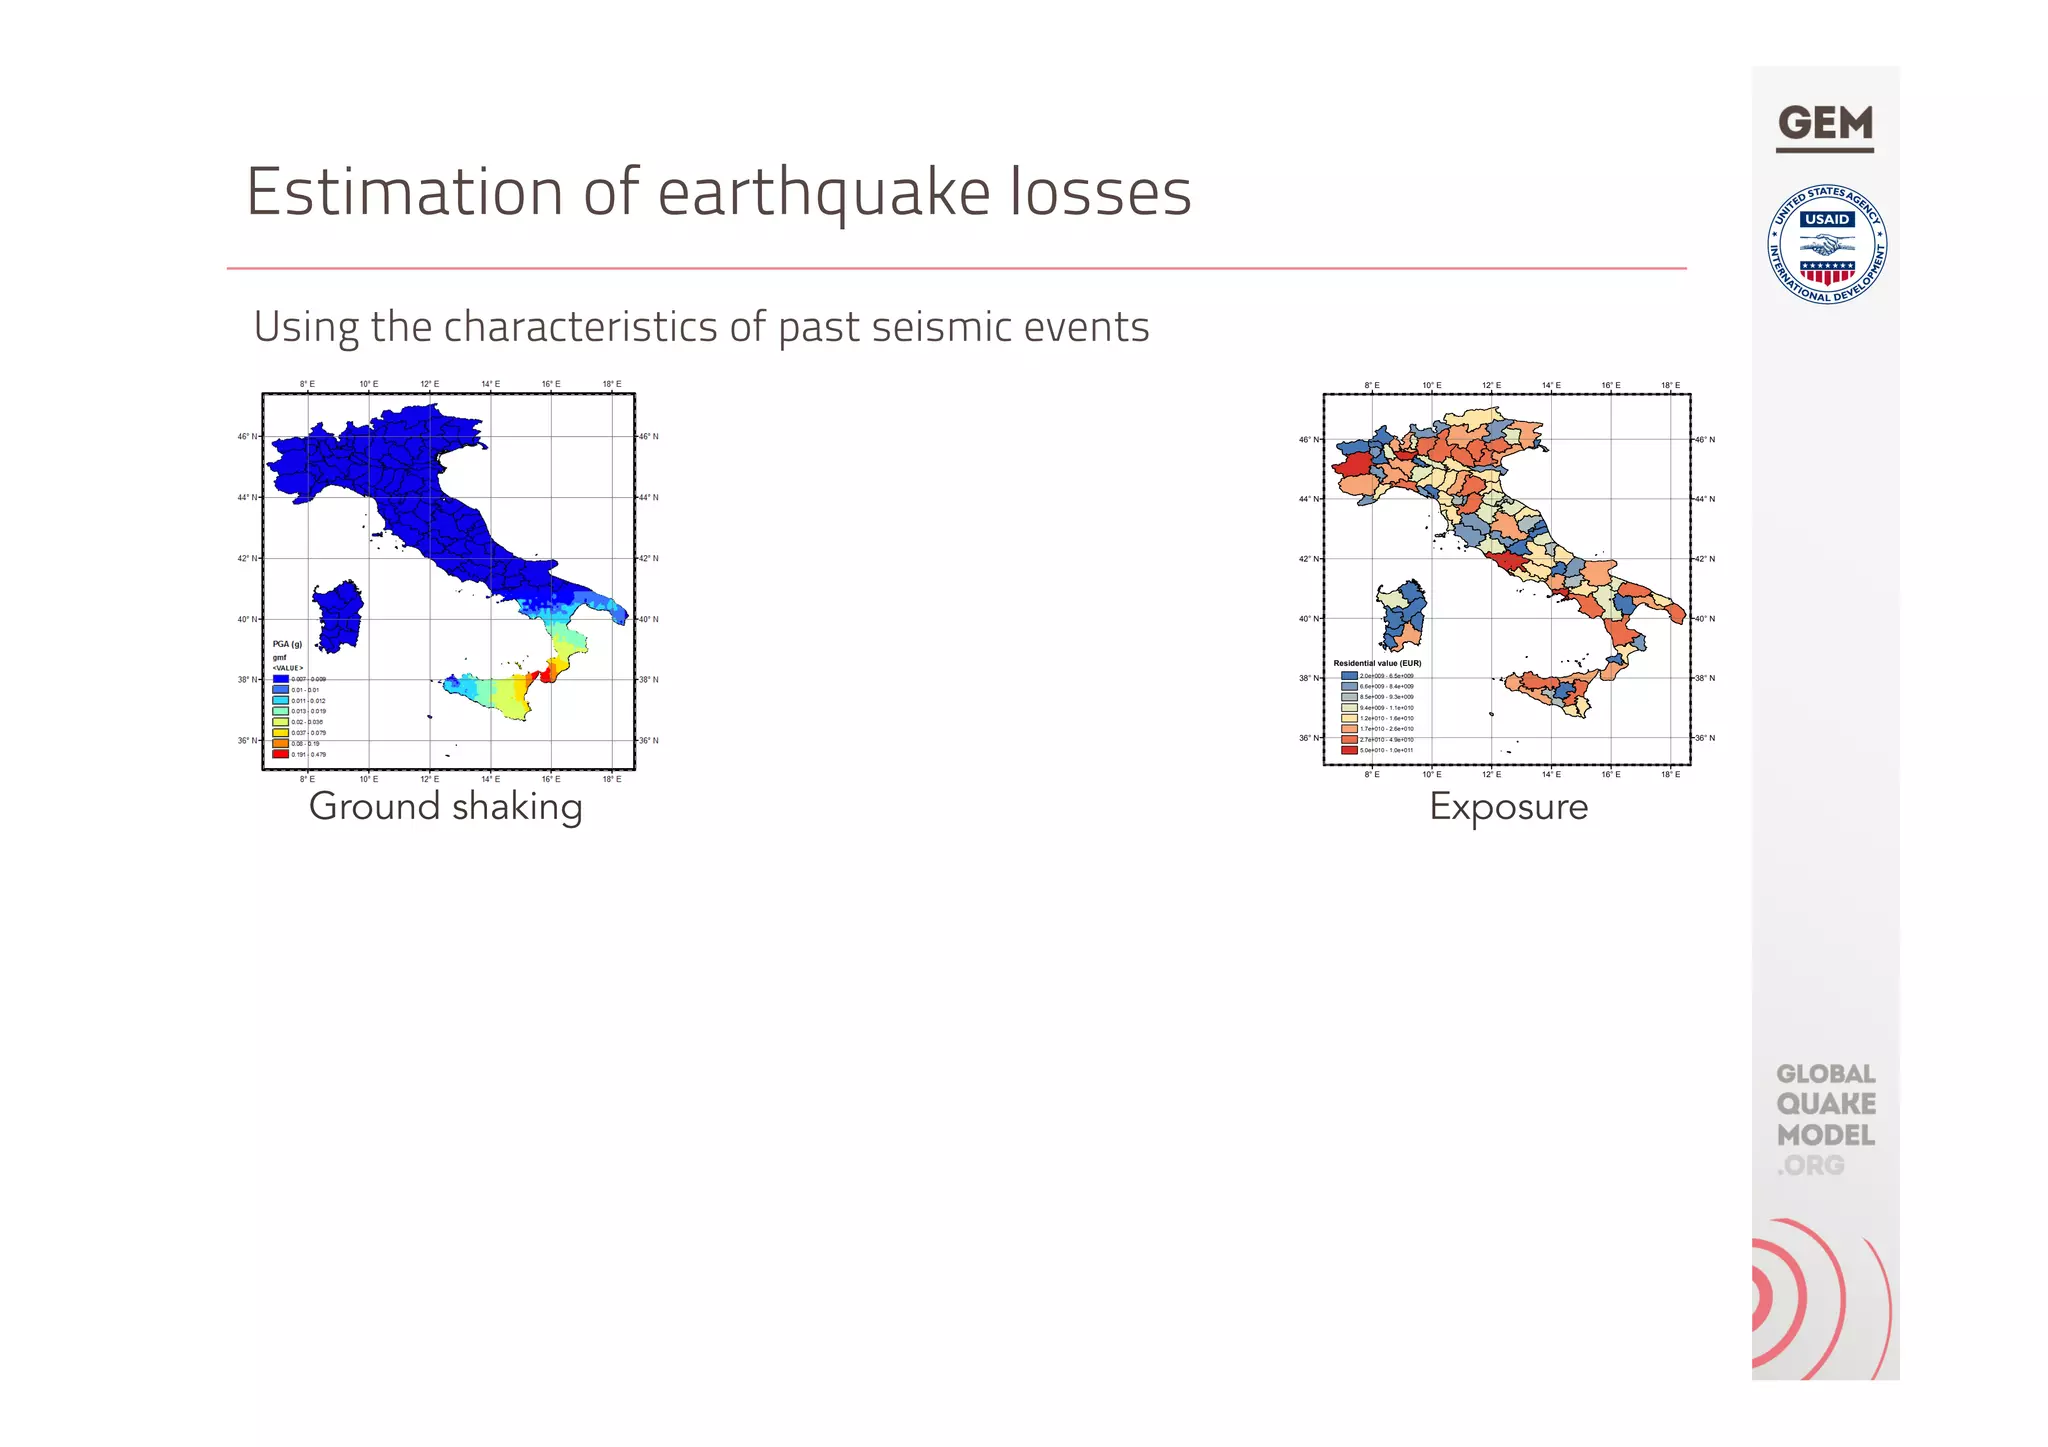
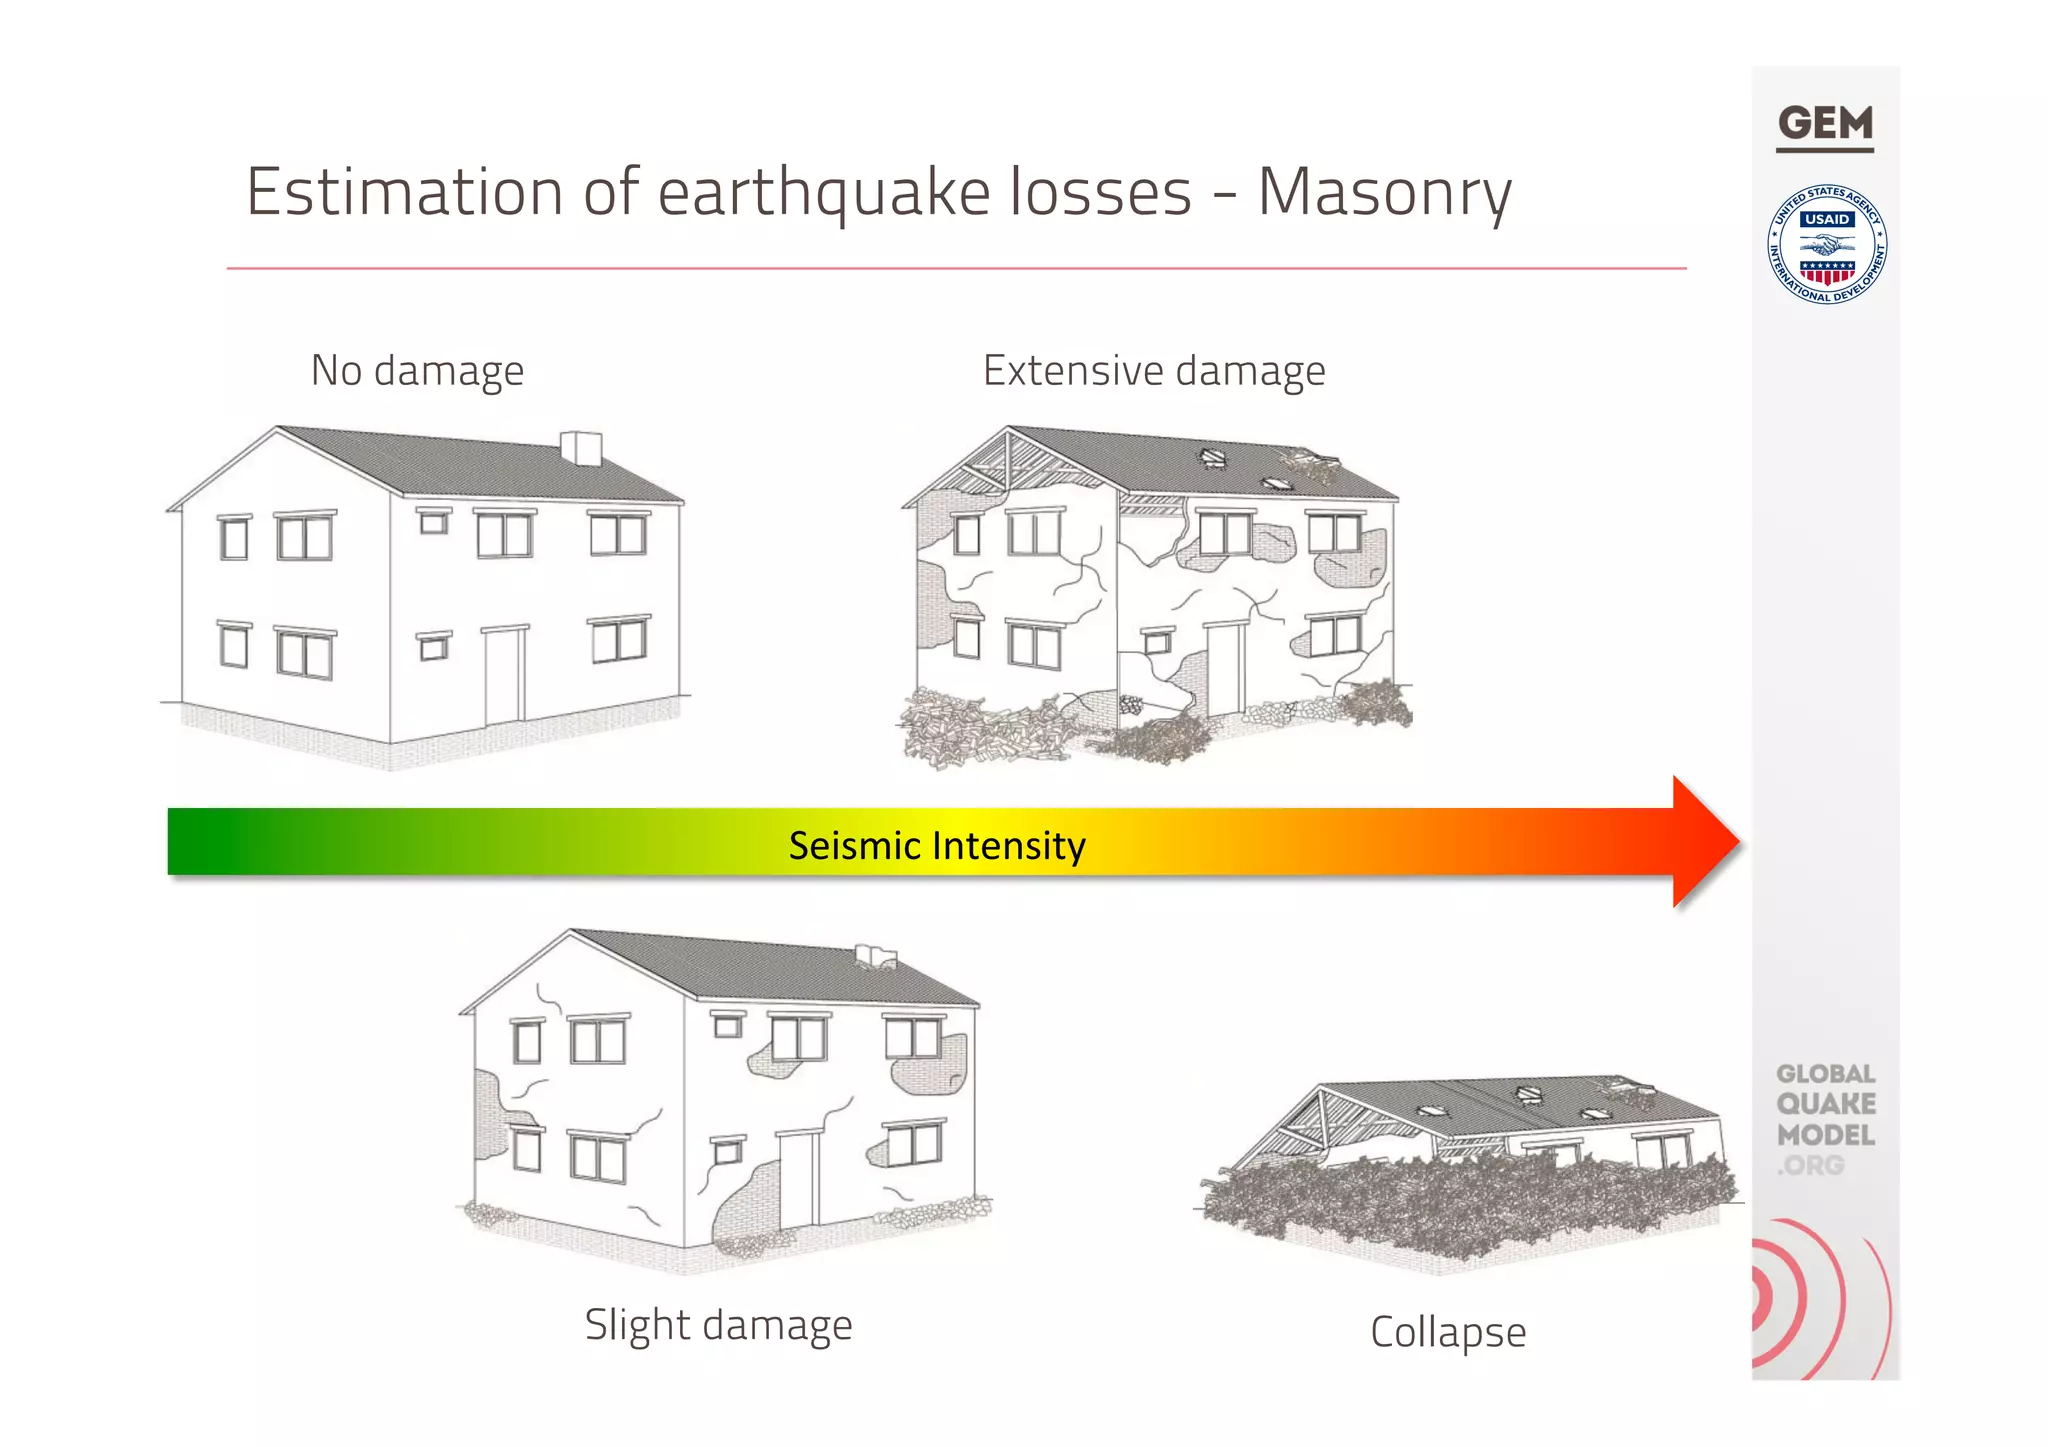
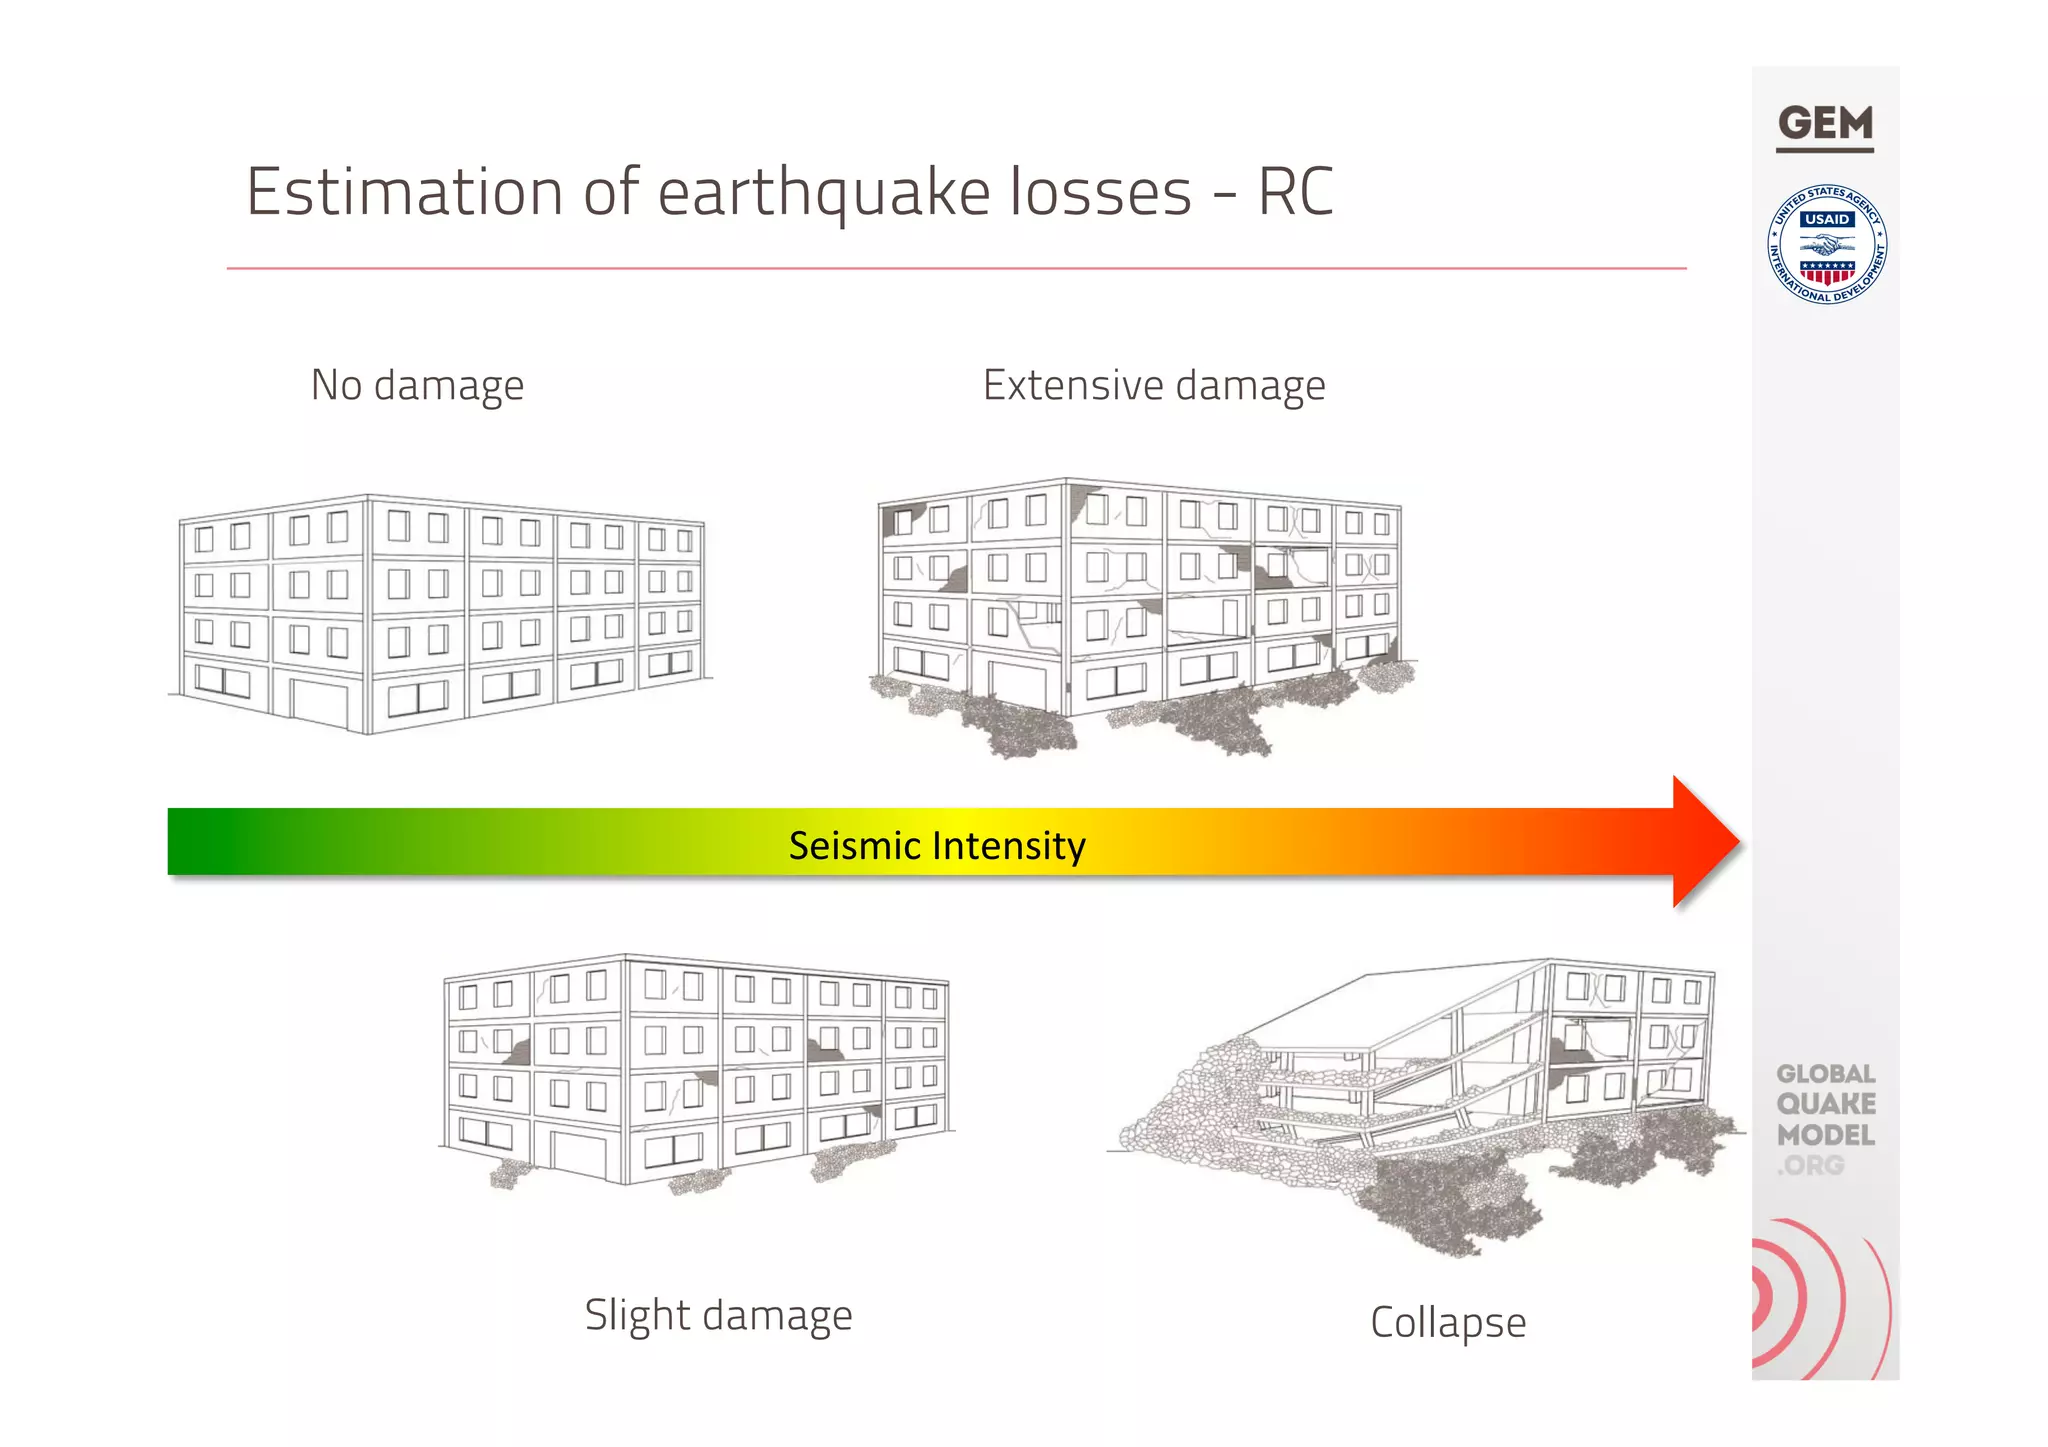
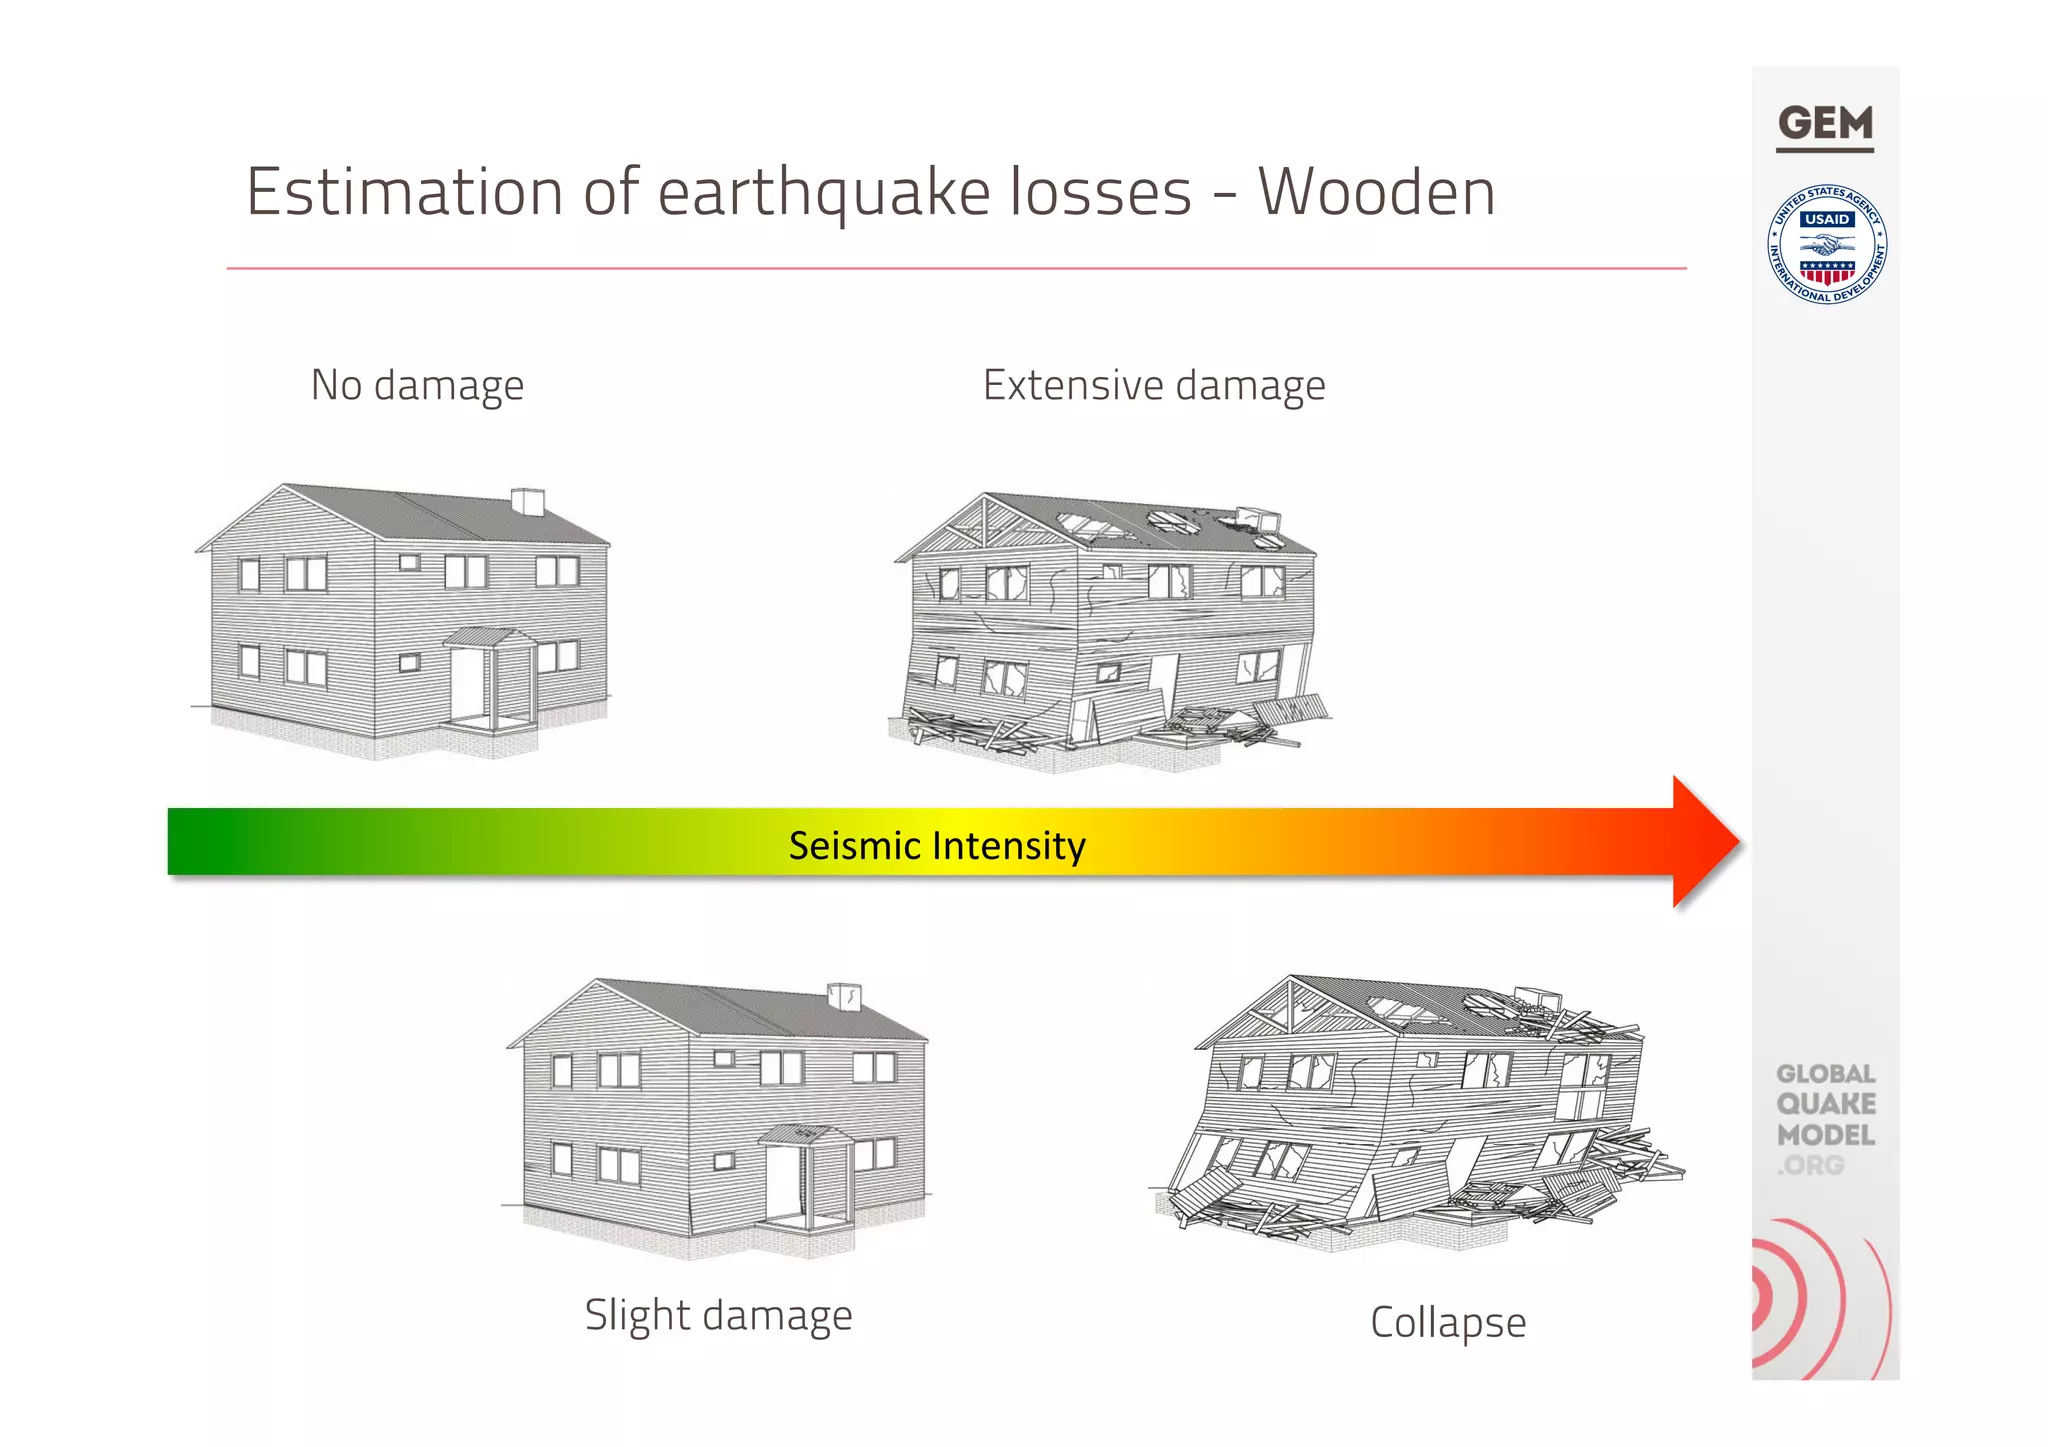
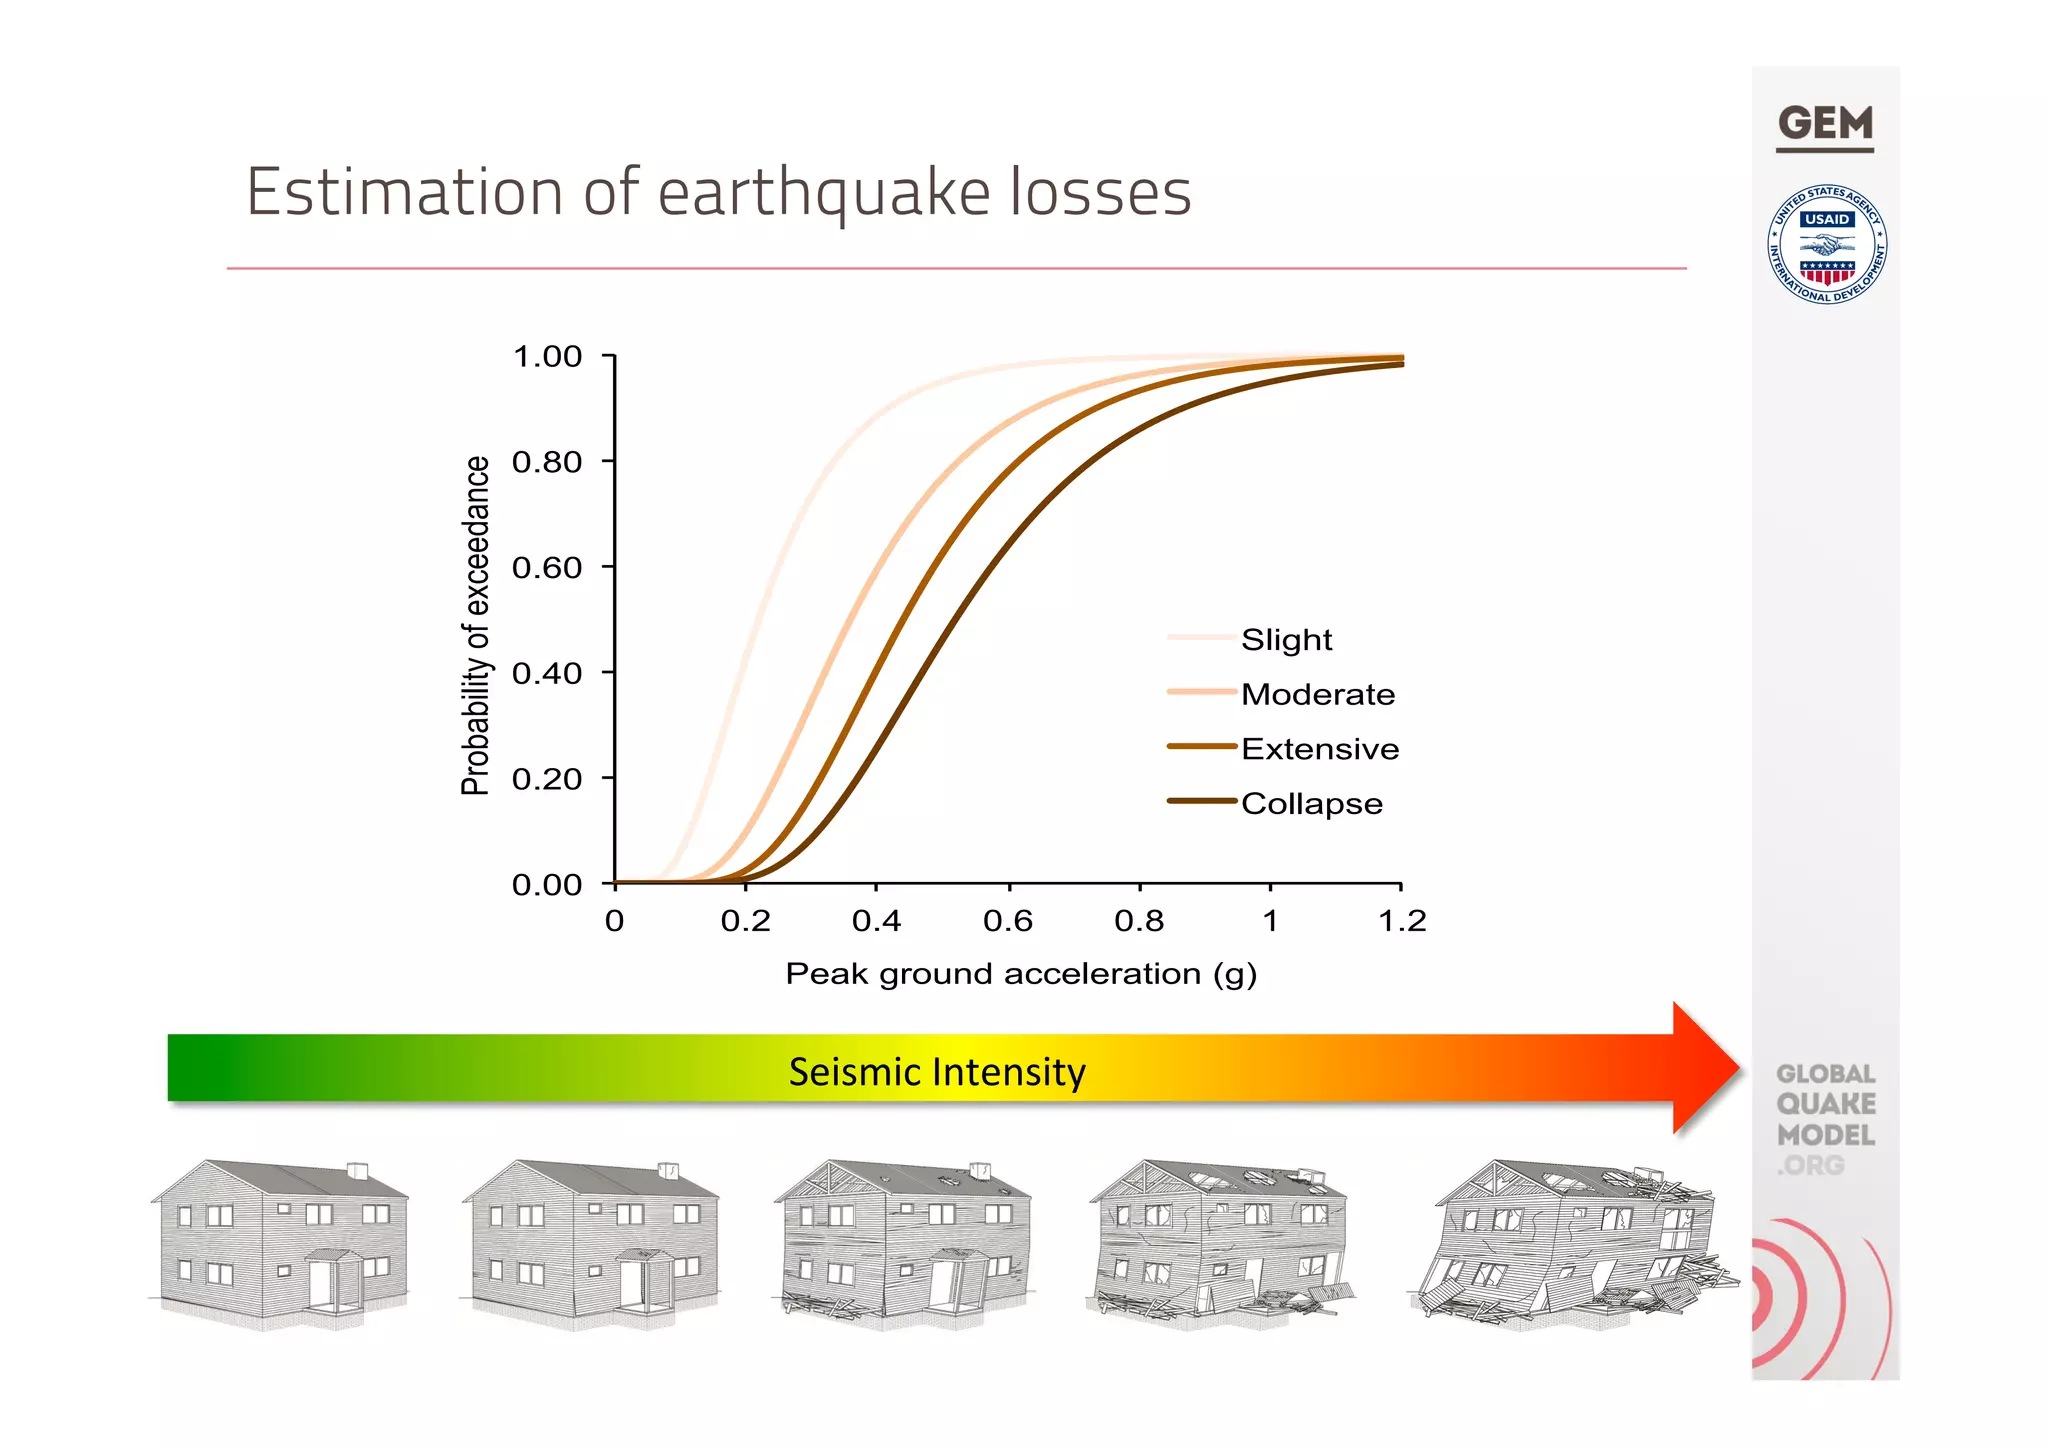
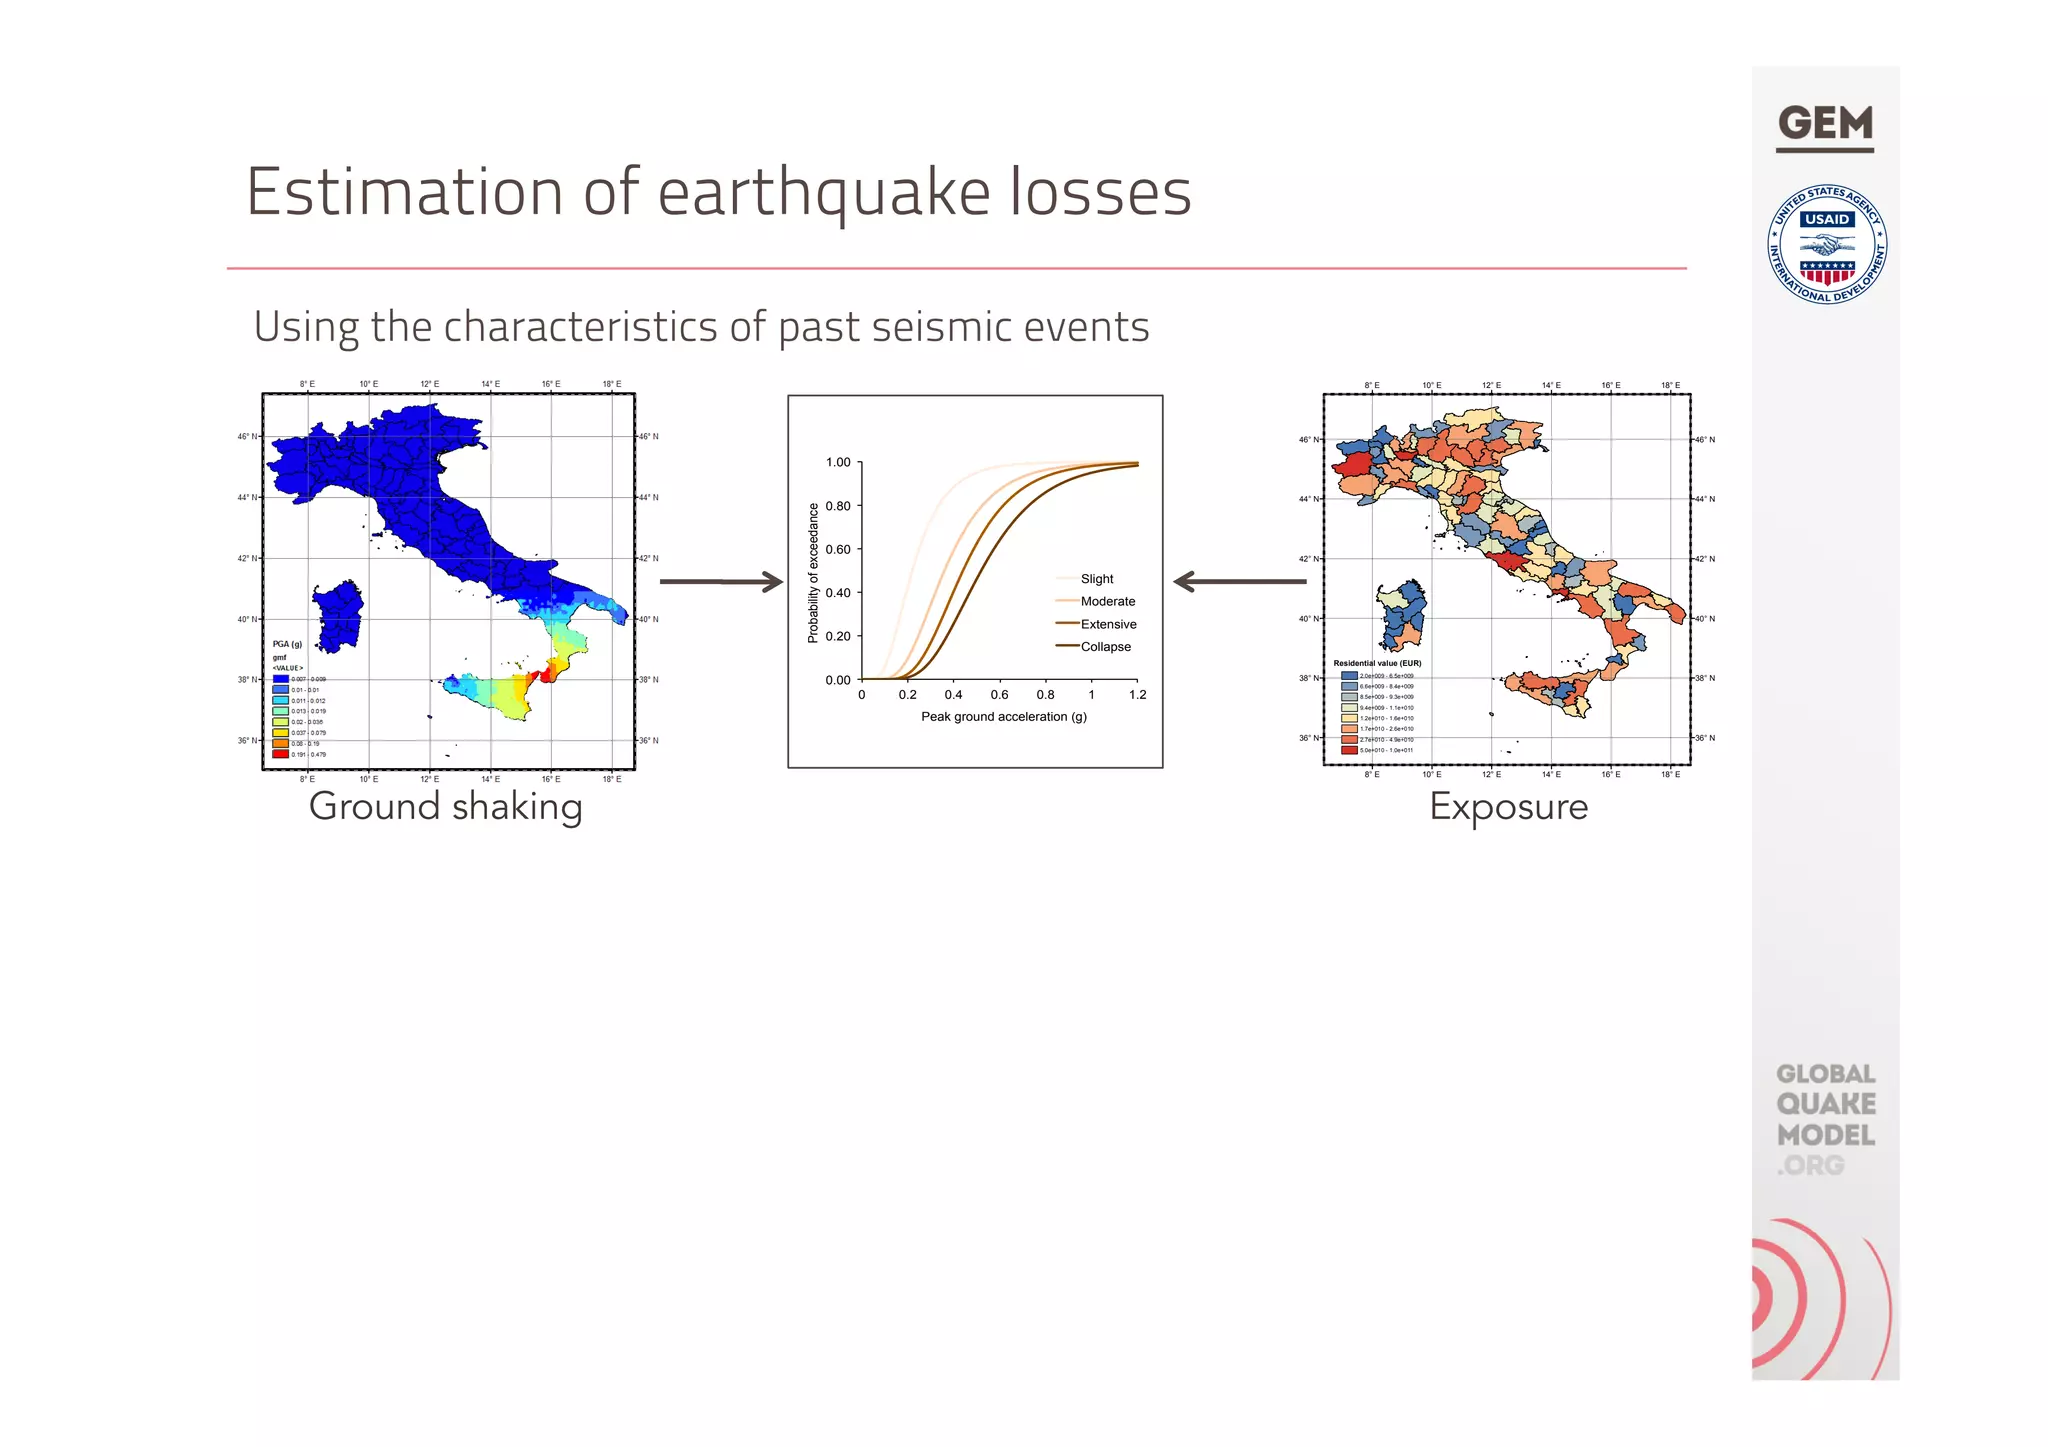
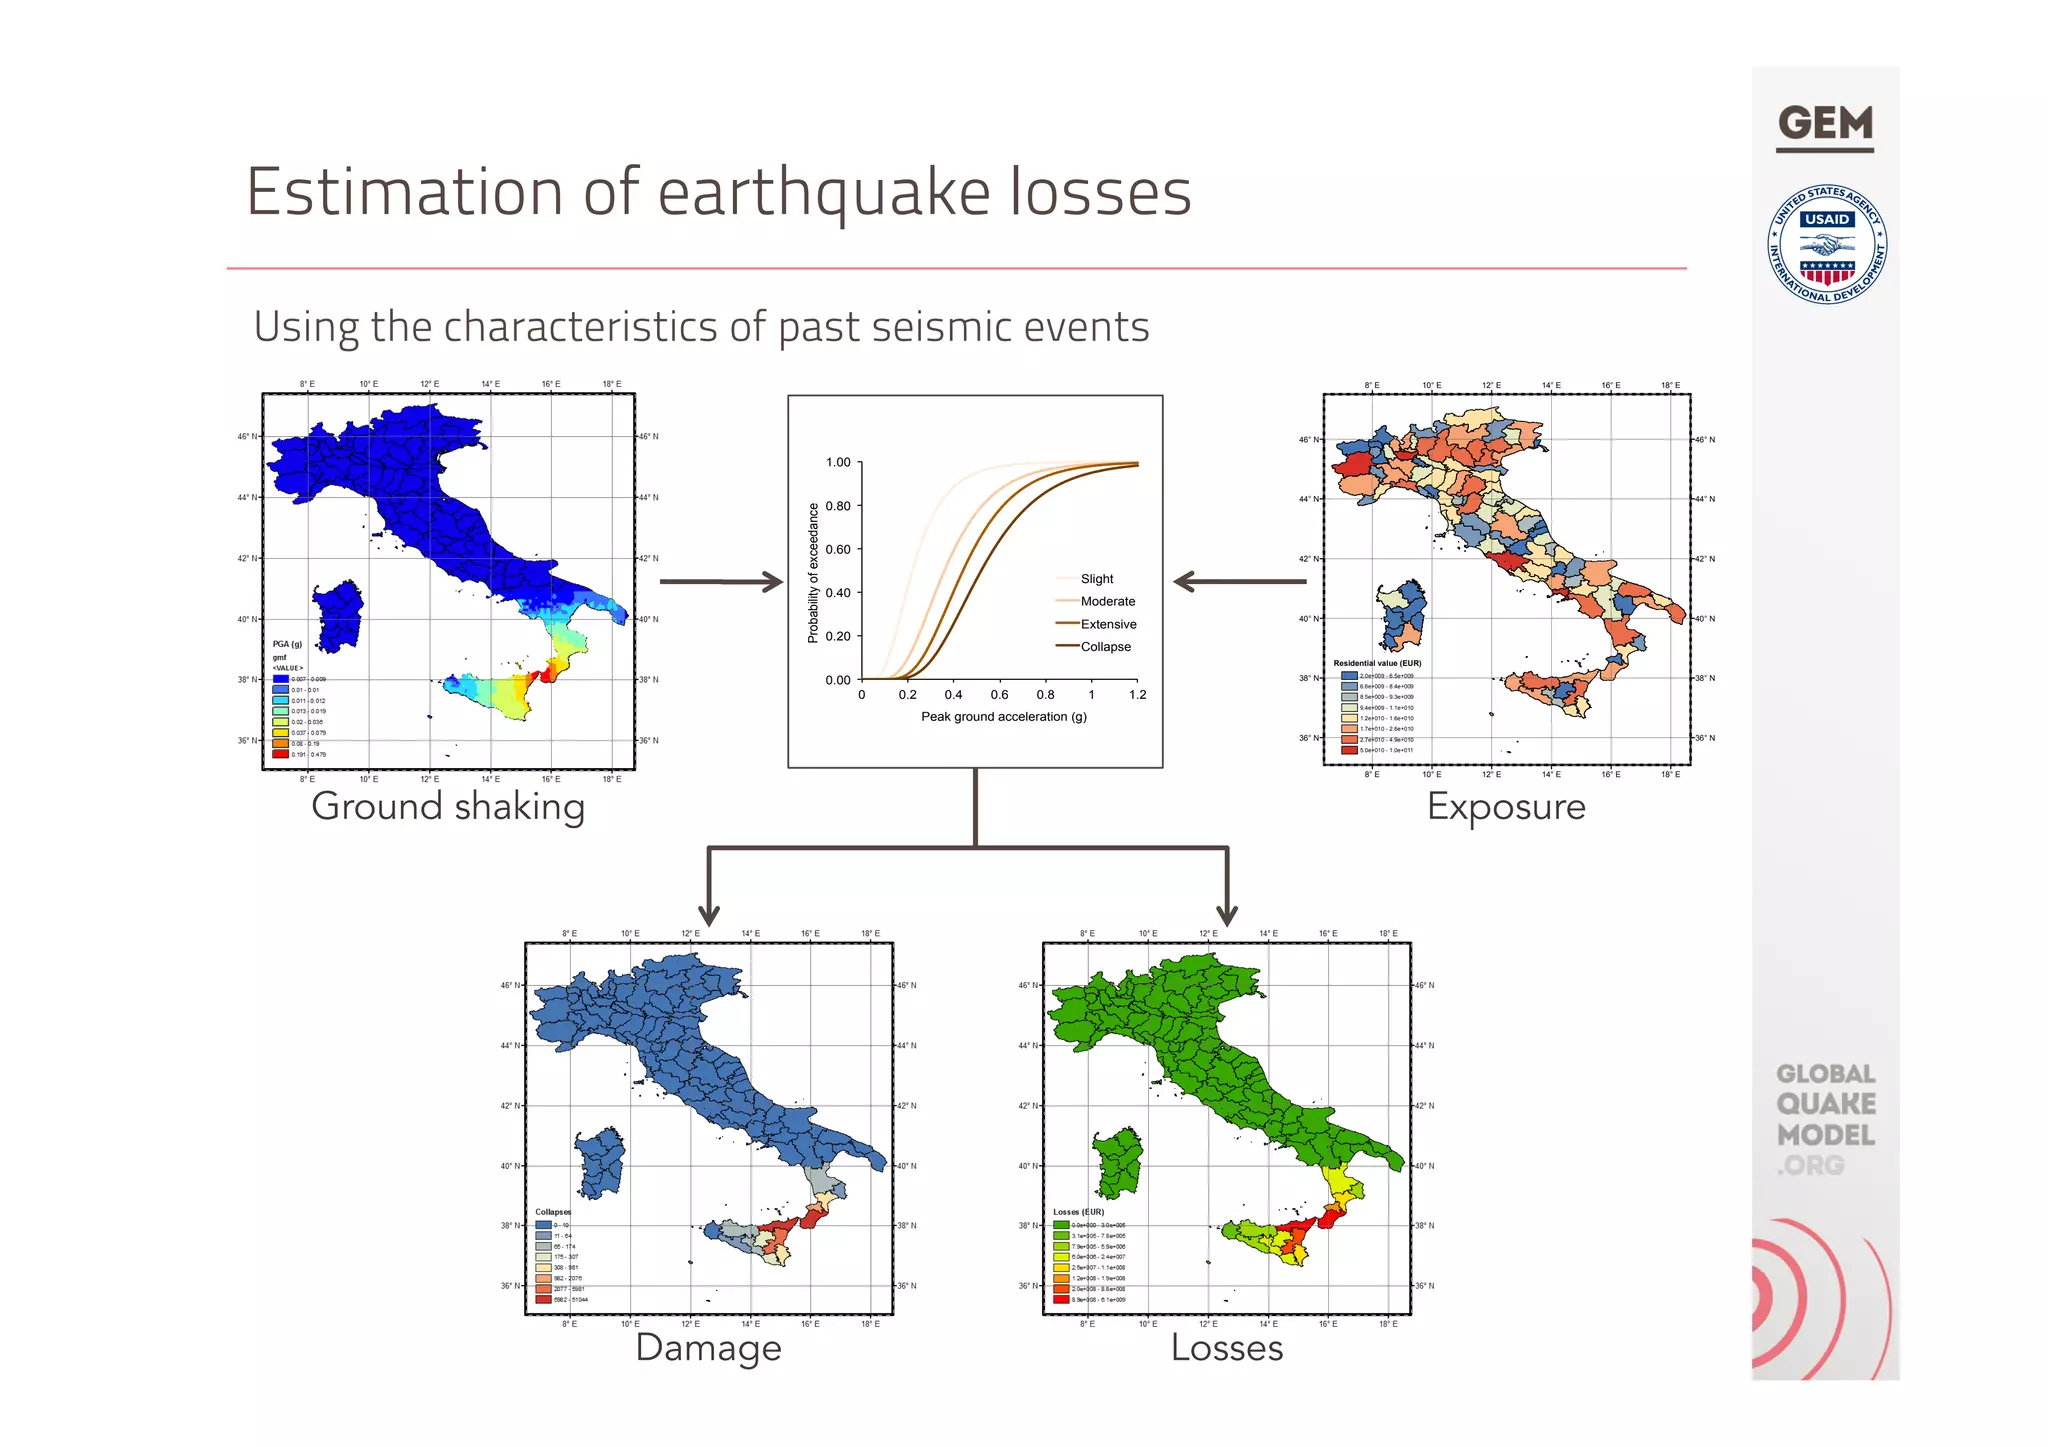
This document discusses the development of a global vulnerability database. It describes estimating earthquake losses using characteristics of past seismic events. It discusses challenges in developing fragility models for different regions and building classes. It also describes the process of deriving fragility and vulnerability functions, including defining structural models, selecting ground motion records, and using the models to estimate damage and losses. Calibration and validation of the models is emphasized.


