Download to read offline
![International Research Journal of Engineering and Technology (IRJET) e-ISSN: 2395-0056
Volume: 05 Issue: 10 | Oct 2018 www.irjet.net p-ISSN: 2395-0072
© 2018, IRJET | Impact Factor value: 7.211 | ISO 9001:2008 Certified Journal | Page 712
Probabilistic Risk Analysis of Seismic Irregular RC Structure Using
Fragility Curve
D. Kesavan Periyasamy1, Dr.R. Ponnudurai2
1PG Structural Engineering student, Department of Civil Engineering, Thiagarajar College of Engineering,
Madurai, Tamilnadu, India
2Assistant Professor, Department of Civil Engineering, Thiagarajar College of Engineering, Madurai,
Tamilnadu, India
---------------------------------------------------------------------***---------------------------------------------------------------------
Abstract - Most of the structures are designed for the vertical
load only. If the structures are design with consideration of
horizontal load (Seismic Load), it will expensive more than
designed structure considering vertical load. So far as
Probabilistic Risk Analysis has not been widely used for
building Frames. Fragility Curve is an effective tool for
vulnerability assessment of the structural system because it is
estimate the Probability of failure vs Ground motion
Parameter (Peak Ground Acceleration). Fragility Curve
assessing Pre-earthquake disaster planning as well as post-
earthquake recovery and retrofitting programs. In this paper
Fragility curve plot for the irregular shaped structure in plan.
Due to the asymmetric of the structure property of the
structure change with respect to the geometry. So that
Probabilistic risk analysis was taken considering both
direction of irregular structure separately by using fragility
curve.
Key Words: Asymmetric RC Structure, Probabilistic Risk
Analysis, Probability of Damage, Peak Ground Acceleration,
Fragility curve.
1. INTRODUCTION
Reliability analysis of structures estimating the
probabilities of a structure under various loading (seismic)
for its intended period of use. Safety and reliability are both
different concept. Safety is a more traditional concept, while
reliability is a relatively new one and which means a
probabilistic meaning to the traditional concept. Likewise
risk analysis and reliability analysis of structures are
simultaneously used to express their probabilities offailure.
However, they are not actually one and the same thing. Risk
analysis of structures is an extension of the reliability
analysis to include the consequences of failure. Fragility
analysis is used in connection with the seismic reliability or
risk analysis of structures. Fragility analysis is aimed at
finding the probability of failure of structures for various
levels of PGA at the site and is closer to the seismic risk
analysis of structures.
Fragility curve considered Uncertainty of
earthquake, Uncertainties associated with seismic hazard
estimates, Uncertainty of ground motion input, Uncertainty
of modeling of structures. Uncertainty of analysis and
Uncertainty of material property. Gerardo M. Verderame et
at al., taken the Case study for various Building after the
earthquake of Emilia. 5 different cases of building is taken
for the analysis. Fragility Curve assessing Pre-earthquake
disaster planning as well as post- earthquake recovery and
retrofitting programs. The variation of the damage cause by
the Change of PGA in the surface of the Earth[8].
Z.A. Lubkowski et at al., derived the relationship
between Ss and s1 by using PGA. In this study PSHA of India
also taken so no modification taken for the Empirical
Equation[9]. Spectral acceleration canbeobtainedbyS1and
SS parameter with respect to Euro Code. By using the
spectral acceleration the fragility curve can be plotted and
Seismic Hazard response spectrum curve can be plot by the
empirical value.
C. M. Ravi Kumar et at al.,proposedMethodologyfor
Probabilistic Seismic Risk Evaluation of Building Structure
Based on Pushover Analysis[11], which talks about Indian
provision defines three types of soil i.e. hard soil, medium
soil and soft soil based only on standard penetration test
(SPT) N value. The standard penetration test has many
limitations. It is difficult to determine the appropriate value
of N for layered soil and soil profiles can and will have large
variations for given region. Because of the limitations of this
method, it is best to use the shear wave velocity as a
supplement for the standard penetration test N values.
Develop an analytical fragility estimates to quantify the
seismic vulnerability of RC frame building. Prathibha S.
Shetty et at al., estimates the fragility of Rc Building Using
Etabs. Fragility curve can be plotted by using Bi linear
Capacity spectrum. Damage state occur by Bilinear Capacity
spectrum curve Variables. Fragility Curve shall be plotted
with more accuracy by considering other uncertainty apart
from push over analysis. By this method fragility curve shall
be plotted for pre-existing as well as designed structure by
only using Push over analysis.
2. DESCRIPTION OF MODEL
Four story (G+3) geometric irregular RC framed
structure was made up with Structural Analysis Software
shown in Fig1 which consist of M25 grade concrete and
Fe415 steel are used throughout the structure. Cross
sectional dimensions of beams 0.3mx0.45m. Cross sectional
dimensions of column 0.3mx0.3m with 9 bars of 12mm dia
bar and Slab thickness is 0.18m. Floor to Floor height of 3m,
Length of the each bay is 6m, Live load of 4 kN/m2 on all
floors. Dead Load of thestructureautomaticallycalculatedby](https://image.slidesharecdn.com/irjet-v5i10133-181030090058/75/IRJET-Probabilistic-Risk-Analysis-of-Seismic-Irregular-RC-Structure-using-Fragility-Curve-1-2048.jpg)
![International Research Journal of Engineering and Technology (IRJET) e-ISSN: 2395-0056
Volume: 05 Issue: 10 | Oct 2018 www.irjet.net p-ISSN: 2395-0072
© 2018, IRJET | Impact Factor value: 7.211 | ISO 9001:2008 Certified Journal | Page 713
25 kN/m3 density of reinforced cement concrete in addition
to the dead load of the beam, column, and slab.
Fig -1: Plan of Irregular Structure
Stiffness of beam, column and slab are separately
calculated then convert the 3D structure into 2D framed
model. Stiffness of 2D frame is shown in Fig 2 which was
consideration of elevation about X direction.
k1=k2=k3=k4=k5=k6=k7=k8=k9=k10=k11=k12=k1
3=k14=k15= 22.5kN/m
k16=k17=k18=k19=k20=k21=k22=k23=k24=k25=
k26=k27=k28=k29=k30=k31=k32=k33=k34=k35=
k36=12.5kN/m
k37=k38=k39=k40=k41=k42=k43=k44=k45=k46=
k47=k48= 324.675kN/m
k49=k50=k51=k52=k53=k54=k55=k56=k57=k58=
k59=k60=k61=k62=k63=k64=k65=k66=k67=k68=
k69=k70=k71=k72=k73=k74=k75=k76=k77=k78=
k79=k80=k81=k82=k83=k84=170.775kN/m
Fig -2: Elevation (X Direction)
Stiffness of 2D frame is shown in Fig 2 which was
consideration of elevation about Y direction.
k1=k2=k3=k4=k5=k6=k7=k8=k9=k10=k11=k12=k1
3=k14=k15=k16= 10 kN/m
k17=k18=k19=k20=k21=k22=k23=k24=k25=k26=
k27=k28=k29=k30=k31=k32=k33=k34=k35=k36=
22.5kN/m
k37=k38=k39=k40=k41=k42=k43=k44=k45=k46=
k47=k48= k49=k50=k51=k52=132.3 kN/m
k53=k54=k55=k56=k57=k58=k59=k60=k61=k62=
k63=k64=k65=k66=k67=k68=k69=k70=k71=k72=
k73=k74=k75=k76=k77=k78=k79=k80=k81=k82=
k83=k84= 324.675 kN/m
Fig -3: Elevation (Y Direction)
3. DEVELOPMENT OF FRAGILITY CURVE
3.1 Calculation of weight of the Structure
Weight of the beam at each floor =2075kN
Weight of the slab at each floor =7125kN
Weight of the column at each floor=384.75kN
Weight of Live Load at each floor =6336kN
Weight of wall at each floor =883.2kN
Total Weight at First Floor =16803.95kN
Total Weight at Second Floor =16803.95kN
Total Weight at Third Floor =16803.95kN
Total Weight at Fourth Floor =9833.975kN
Total Weight of the structure =60245.825kN
3.2 Calculation of Spectral Acceleration by PGA
Z.A. Lubkowski derived the relationship betweenSs
and S1 by using PGA[9]. In this study PSHA of India also
taken so no modification taken for the Empirical Equation.
Spectral acceleration can be obtained by S1 and SS
parameter with respect to Euro Code. The structure is
considered located in Zone A.
SS = PGA (0.3386 PGA + 2.1696)
S1 = PGA (0.5776 PGA + 0.5967)
Table -1: Spectral Acceleration
PGA
(g)
SS S1 SDS SD1 Sa(
%g)
Sa50 Sa84
0 0 0 0 0 0 0 0
0.05 0.11 0.03 0.06 0.02 0.05 0.02 0.04
0.1 0.22 0.07 0.12 0.03 0.10 0.05 0.08
0.15 0.33 0.10 0.18 0.05 0.15 0.08 0.13
0.2 0.45 0.14 0.24 0.08 0.20 0.10 0.17
0.25 0.56 0.19 0.30 0.10 0.26 0.13 0.22
0.3 0.68 0.23 0.36 0.12 0.31 0.16 0.26
0.35 0.80 0.28 0.43 0.15 0.37 0.18 0.31
0.4 0.92 0.33 0.49 0.18 0.42 0.21 0.35
0.45 1.04 0.39 0.56 0.21 0.23 0.24 0.40
0.5 1.17 0.44 0.62 0.24 0.26 0.27 0.45
0.55 1.30 0.50 0.69 0.27 0.30 0.30 0.50
0.6 1.42 0.57 0.76 0.30 0.33 0.33 0.55
0.65 1.55 0.63 0.83 0.34 0.37 0.36 0.61
0.7 1.68 0.70 0.90 0.37 0.41 0.39 0.66](https://image.slidesharecdn.com/irjet-v5i10133-181030090058/75/IRJET-Probabilistic-Risk-Analysis-of-Seismic-Irregular-RC-Structure-using-Fragility-Curve-2-2048.jpg)
![International Research Journal of Engineering and Technology (IRJET) e-ISSN: 2395-0056
Volume: 05 Issue: 10 | Oct 2018 www.irjet.net p-ISSN: 2395-0072
© 2018, IRJET | Impact Factor value: 7.211 | ISO 9001:2008 Certified Journal | Page 714
3.3 Calculating Plastic Hinge point by Pushover Analysis
The irregular structures modelled and performed
pushover analysis using software. Pushover analysis
performed over both X and Y Direction.
Fig -4: Pushover Analysis in X direction
Fig -5: Pushover Analysis in Y direction
3.4 Calculation of Force at Each Floor
Considering the zone factor 0.16, Response
Reduction Factor 3 and Importance Factor as 1.5 then found
the Force at each floor by adopting method of seismic
coefficient specified in IS 1893 part I.
Table -2: Base Shear
PGA(g) Ah50 Ah84 Vb50(KN) Vb84(KN)
0 0 0 0 0
0.05 0.01 0.02 603.69 1014.19
0.1 0.02 0.03 1220.18 2049.91
0.15 0.03 0.05 1849.49 3107.15
0.2 0.04 0.07 2491.62 4185.91
0.25 0.05 0.09 3146.55 5286.21
0.3 0.06 0.11 3814.30 6408.02
0.35 0.07 0.13 4494.86 7551.36
0.4 0.09 0.14 5188.23 8716.23
0.45 0.10 0.16 5894.42 9902.62
0.5 0.11 0.18 6613.41 11110.54
0.55 0.12 0.20 7345.22 12339.98
0.6 0.13 0.23 8089.85 13590.94
0.65 0.15 0.25 8847.28 14863.43
0.7 0.16 0.27 9617.53 16157.45
Table -3: Seismic Coefficient
Floor
Number
Height
(m)
Wi Wihi
2 Wihi
2/
∑ Wihi
2
1 3 16803.95 151235.6 0.0428
2 6 16803.95 604942.2 0.1712
3 9 16803.95 1361120 0.3852
4 12 9833.975 1416092 0.4007
The outer dimension of structure along X and Y
direction are same hence force at each floor can be same for
both direction.
Table -4: Force at Each Floor
3.5 Calculation of uncertainty Parameters
In this paper Simplified Probabilistic Risk Analysis
of Structures (made by Shinozuka et al) method has been
adopted[7]. And considered complete failure mechanism
PGA
(g)
Force in Each floor due to Sa50 (KN)
P1 P2 P3 P4
0 0.00 0.00 0.00 0.00
0.05 25.84 103.36 232.55 241.94
0.1 52.23 208.90 470.03 489.02
0.15 79.16 316.65 712.45 741.23
0.2 106.65 426.58 959.81 998.57
0.25 134.68 538.71 1212.10 1261.06
0.3 163.26 653.03 1469.33 1528.67
0.35 192.39 769.55 1731.49 1801.42
0.4 222.07 888.26 1998.59 2079.31
0.45 252.29 1009.17 2270.62 2362.33
0.5 283.07 1132.26 2547.59 2650.48
0.55 314.39 1257.55 2829.50 2943.77
0.6 346.26 1385.04 3116.34 3242.20
0.65 378.68 1514.72 3408.11 3545.76
0.7 411.65 1646.59 3704.83 3854.46
PGA
(g)
Force in Each floor due to Sa84 (KN)
P1 P2 P3 P4
0 0 0 0 0
0.05 43.41 173.64 390.68 406.46
0.1 87.74 350.96 789.66 821.55
0.15 132.99 531.97 1196.92 1245.26
0.2 179.17 716.66 1612.48 1677.61
0.25 226.26 905.04 2036.33 2118.57
0.3 274.28 1097.1 2468.47 2568.17
0.35 323.21 1292.85 2908.91 3026.39
0.4 373.07 1492.28 3357.63 3493.24
0.45 423.85 1695.4 3814.65 3968.71
0.5 475.55 1902.2 4279.96 4452.81
0.55 528.18 2112.69 4753.56 4945.54
0.6 581.72 2326.86 5235.45 5446.9
0.65 636.18 2544.72 5725.63 5956.88
0.7 691.57 2766.27 6224.11 6475.49](https://image.slidesharecdn.com/irjet-v5i10133-181030090058/75/IRJET-Probabilistic-Risk-Analysis-of-Seismic-Irregular-RC-Structure-using-Fragility-Curve-3-2048.jpg)
![International Research Journal of Engineering and Technology (IRJET) e-ISSN: 2395-0056
Volume: 05 Issue: 10 | Oct 2018 www.irjet.net p-ISSN: 2395-0072
© 2018, IRJET | Impact Factor value: 7.211 | ISO 9001:2008 Certified Journal | Page 716
5. CONCLUSIONS
In this paper, fragility curves are plotted for
asymmetric concretemomentresistingframestructures and
following conclusion can be stated
Probability of failure can be calculated for both
direction (X direction and Y direction) in the
asymmetric RC structure because probability of
failure varying with respect to geometrical
asymmetry.
By using Probabilistic Risk analysis we can connect
the Probability of damage to the Ground motion
Parameters such as Peak Ground Acceleration
(PGA), Peak Ground Velocity (PGV) and Peak
ground displacement (PGD).
When the PGA exceeds 0.3g, the above seismic
irregular structurewill more probablyfailure(more
than 80%).
In this analysis 7 combination of uncertainty was
used, hence the probability of failure was more
accurate.
By using the Probabilistic Risk Analysis in the
existing structure we can predicttheamountofPGA
which causes the structure Failure.
Probability of the damage slightly lesser in Y
direction, because moment of inertia is greater in Y
direction.
REFERENCES
[1] Datta, T. K. (2010). Seismic Analysis of Structures. John
Wiley & Sons (Asia) Pte Ltd, Singapore.
[2] IS 1893 (Part 1) (2002). Indian Standard Criteria for
Earthquake Resistant Design of Structures, (fifth
revision). Indian Standard Institute, New Delhi, India.
[3] ATC-40. (1996). Seismic Evaluation and Retrofit of
Concrete Buildings. Applied Technology Council, 555.
Twin Dolphin Drive, Suite 550 Redwood City,California.
[4] FEMA 356. (2000). Pre-standard and Commentary on
the Guidelines for the Seismic Rehabilitation of
Buildings, American Society of Civil Engineers, USA.
[5] FEMA 440. (2005). Improvement of Nonlinear Static
Seismic Analysis Procedures. Department of Homeland
Security, Federal Emergency Management Agency,
Washington, D.C., U.S.A.
[6] HAZUS MH-MR5 Technical and User’s Manual. (2003).
Federal Emergency Management Agency, Washington
DC, USA.
[7] Shinozuka, M., Mizutani, M., Takeda, M., and Kai, Y.
(1989) A Seismic PRA Procedure in Japan and its
Application to a Building PerformanceSafetyEstimation
Part 3-Estimation of Building and Equipment
Performance Safety. Proceedings of ICOSAR 1989, San
Francisco, USA, pp. 637–644.
[8] Gerardo M. Verderame, PaoloRicci,Flavia DeLuca,Carlo
Del Gaudio, Maria Teresa De Risi (2015) Damage
scenarios for RC buildings duringthe2012Emilia (Italy)
earthquake in Elsevier Soil Dynamics and Earthquake
Engineering.
[9] Gerardo M. Verderame, PaoloRicci,Flavia DeLuca,Carlo
Del Gaudio, Maria Teresa De Risi , Deriving SS and S1
Parameters from PGA Maps in World Conference in
Earthquake Engineering.
[10] Thomas, P., Wong, I and Abrahamson, N. (2010).
Verification of Probabilistic Seismic Hazard Analysis
Computer Programs. PEER Report 2010/106, Pacific
Earthquake Engineering Research Center, College of
Engineering, University of California, Berkeley.
[11] C. M. Ravi Kumar, K. S. Babu Narayan, Reddy D. Venkat
Article(2014),Methodology for Probabilistic Seismic
Risk Evaluation ofBuildingStructureBasedonPushover
Analysis in Architectural Design.
BIOGRAPHIES
D. Kesavan Periyasamy student of
post graduate in M.E Structural
Engineering from Thiagarajar
College of Engineering, Madurai,
India. Had completed under
graduation B.E. in Civil Engineering
from Holycross Engineering College
in 2017, Tuticorin, India.
Dr.R.Ponnudurai is working as
Assistant Professor at Thiagarajar
College of Engineering, Madurai,
India. Had completed B.E Civil
Engineering,, M.E Structural
(Fracture mechanics) at MS
University, Baroda, India and Ph.D
from Anna university, Chennai,India.](https://image.slidesharecdn.com/irjet-v5i10133-181030090058/75/IRJET-Probabilistic-Risk-Analysis-of-Seismic-Irregular-RC-Structure-using-Fragility-Curve-5-2048.jpg)

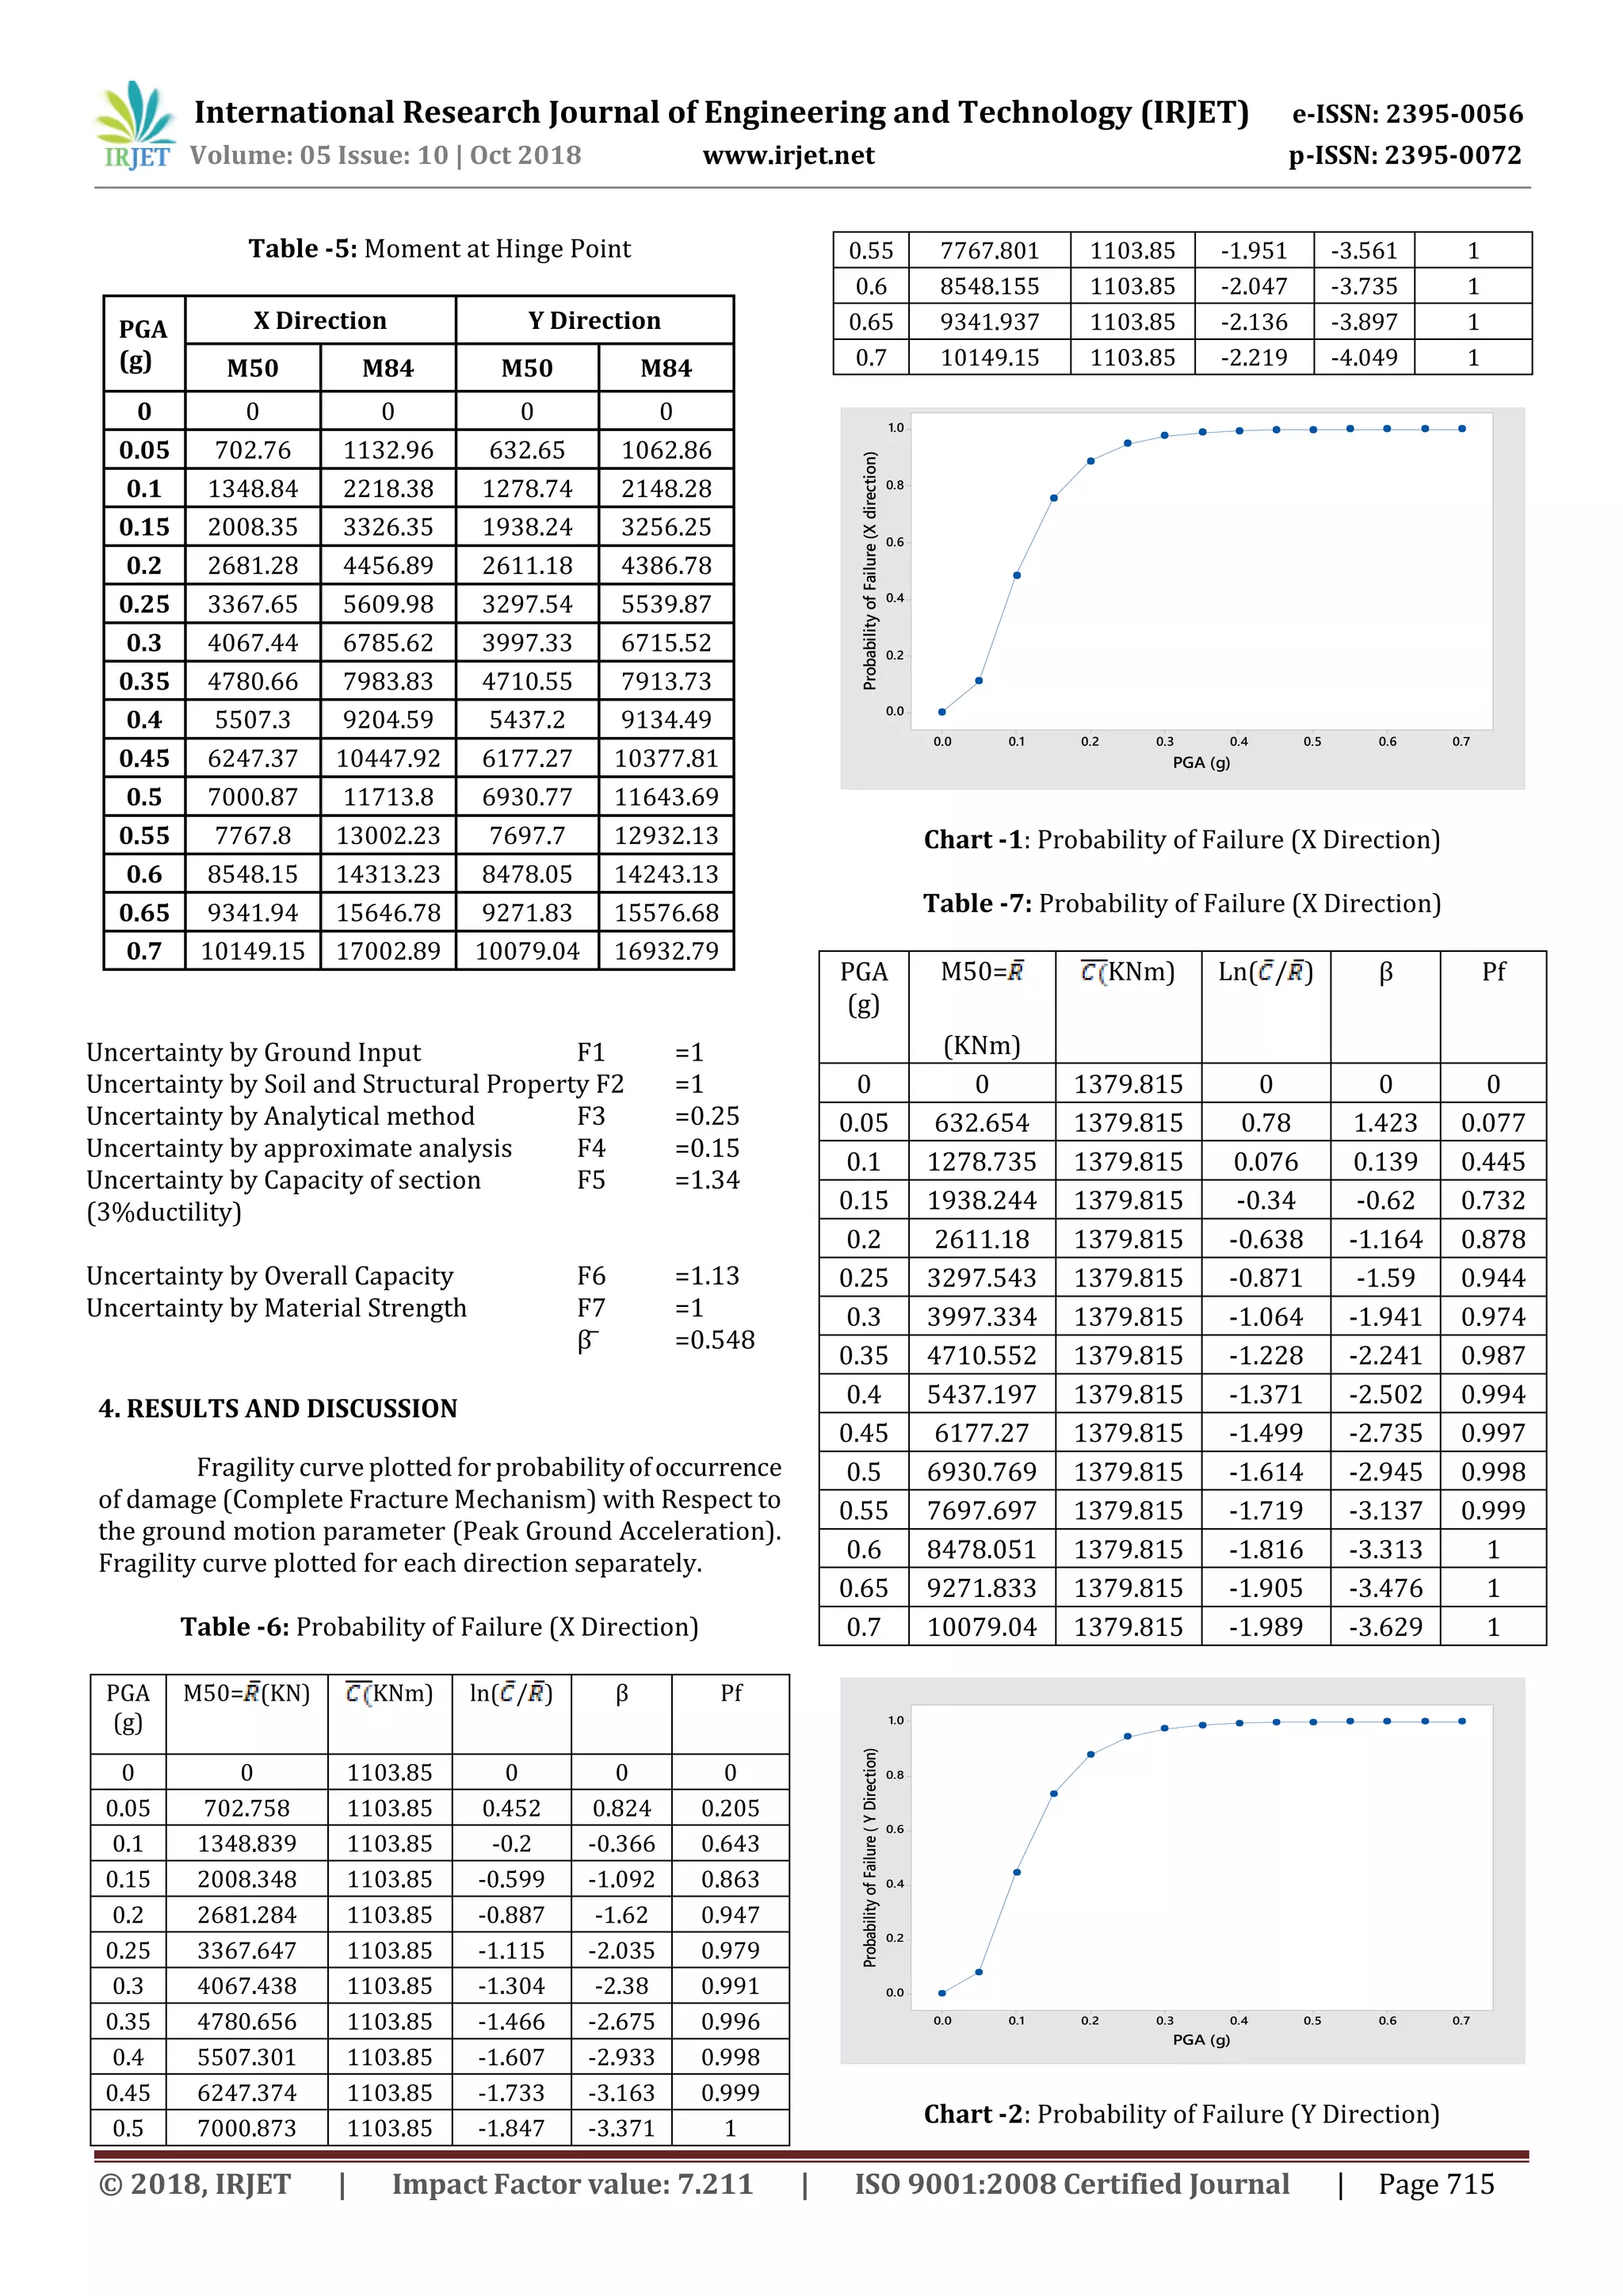
This document summarizes a study that performed a probabilistic risk analysis of an irregular reinforced concrete structure using fragility curves. A 4-story irregular RC structure was modeled and its stiffness properties were calculated. Pushover analyses were conducted in two directions to identify plastic hinge locations. Spectral accelerations were determined for different peak ground accelerations using empirical equations. Fragility curves were developed by calculating the probability of exceeding different damage states at varying ground motion intensities. The study aims to assess the seismic vulnerability of irregular structures using fragility analysis.


