Download as PDF, PPTX

![MDOF
Simplification of 3D or 2D structures into a SDOF
lent SDOF system can be either elastic or inelastic de-
n the chosen inelastic analysis method (see Section
tation of the pushover curve and the subsequent deter-
the properties of the equivalent SDOF system are thor-
cussed in Section 7.2.
bal deformations ∆
Detailed
model
nically
m*
h*k*
Equivalent SDOF
system
0
1
2
3
0.0 0.1 0.2 0.3
Global deformation ∆ [m]
HorizontalforceV[MN]
ve“
stic
ationship
ntals of Seismic Design”
Substitute SDoF structure
ive displacement
gn displacement)
ive mass
ive height ( ) ( )¦¦ ∆∆=
n
ii
n
iiie
mHmH /
( ) ( )¦¦
==
∆∆=∆
n
i
ii
n
i
iid
mm
11
2
/
( ) d
n
i
iie
mm ∆∆= ¦
=
/
1
He
me
He
me ∆d
∆i
∆i-1
∆3
∆2
∆1
He
me
He
me ∆d
∆i
∆i-1
∆3
∆2
∆1
SDOF
Definition of structural models for vulnerability
analysis
−0.25 −0.2 −0.15 −0.1 −0.05 0 0.05 0.1 0.15 0.2 0.25
−0.5
−0.4
−0.3
−0.2
−0.1
0
0.1
0.2
0.3
0.4
0.5
Sd [m]
Sa[g]
sdof
pinching4
Hysteresis model](https://image.slidesharecdn.com/02-ccararisk-180517141426/85/02-ccara-risk-30-320.jpg)
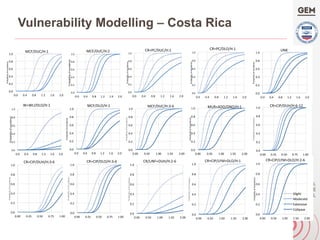
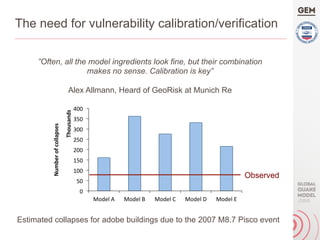
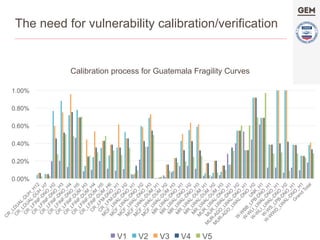
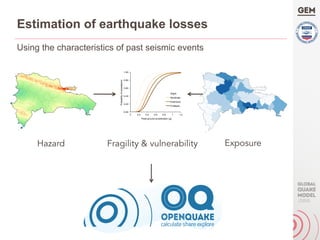
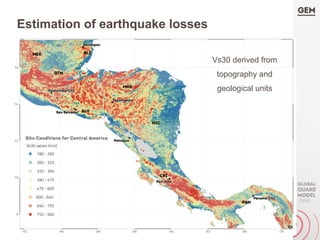
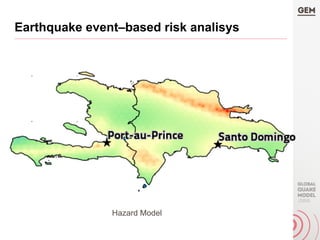
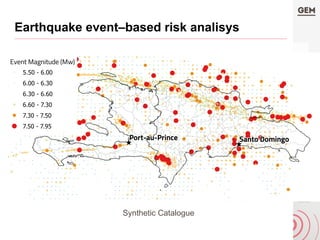
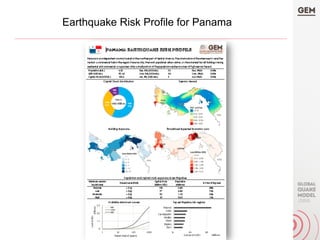
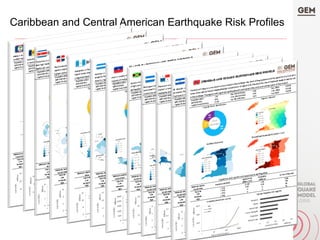
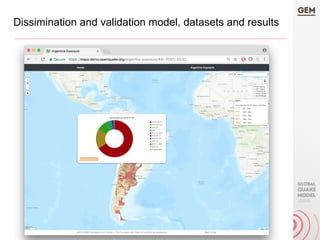
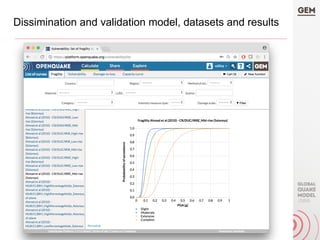


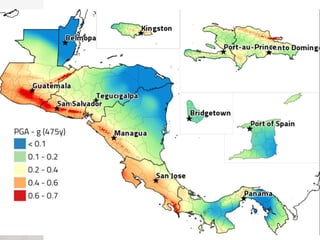
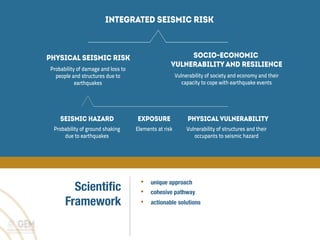
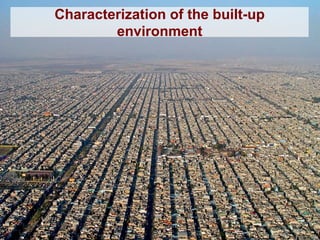
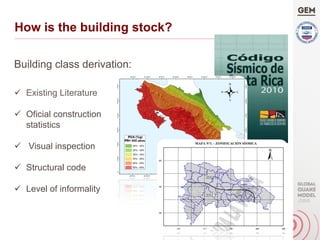
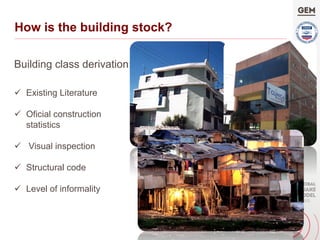
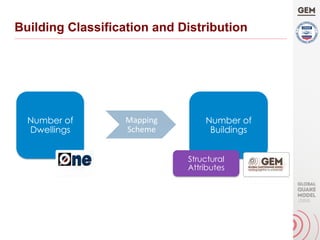
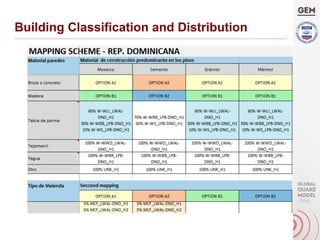
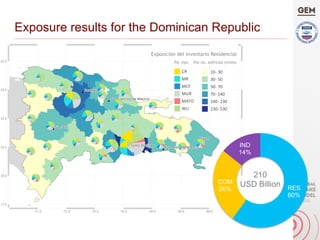
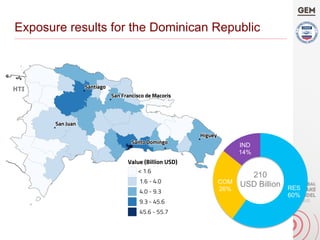
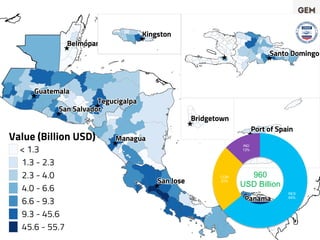
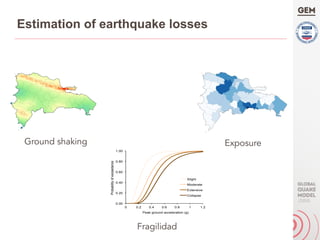
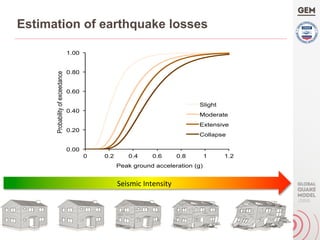
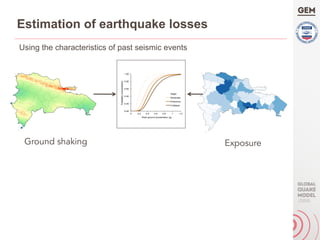
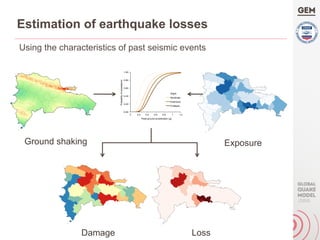
This document summarizes the Caribbean and Central American Seismic Risk Assessment Project. The project uses an integrated framework to model seismic risk by assessing seismic hazard, exposure of the built environment, and physical and socioeconomic vulnerability. Building inventories and fragility curves have been developed for the Dominican Republic to estimate potential earthquake losses and inform risk reduction efforts. Calibration of vulnerability models is important to ensure realistic estimated losses that match observations from past earthquakes.


