Download to read offline

![International Research Journal of Engineering and Technology (IRJET) e-ISSN: 2395 -0056
Volume: 04 Issue: 03 | Mar -2017 www.irjet.net p-ISSN: 2395-0072
© 2017, IRJET | Impact Factor value: 5.181 | ISO 9001:2008 Certified Journal | Page 1888
ReinforcedConcretebuildings.Theinvestigatedbuildingscan
be considered low-engineered buildings, using no seismic
codes or old seismic codes. The seismic capacity of the
selected models representing the existing RC buildings has
been evaluated through non-linear dynamic simulations.
Seismic response has been analyzed, considering various
response parameters, such as ductility demands and Inter-
storey Drift Ratio (IDR). It is concluded that defining an
accurate tool for seismic reduction strategies is essential for
accurate structural performance analysis.
Aiswarya S & Nandita Mohan(2014)conductedastudy
on the generation of fragility curves for a five-story
reinforced concrete (RC) flat-slab building structure. For the
development of fragility curves a set of earthquake records
were selected from PEER data base. Inelastic time history
analysis was performed to analyze the structuresubjectedto
the earthquake records in terms of spectral acceleration in
ETABS. The fragility curves developed from this study were
used to compare the seismic performance of retrofitted and
un-retrofitted structure. From the study, theyconcludedthat
the flat slab systems are more vulnerable to seismic hazard
because of their insufficient lateral resistance and undesired
performance at high levels of seismic demand. Based on this
they proposed the retrofitting technique like inclusion of
shear wall and studied its effect using the fragility curve.
Tarannum Yasmin et al (2015) reviewed the
importance of fragilityanalysis using existingmethodologies
and focuses on their key features highlightingthelimitations.
The paper suggests the way for selection of appropriate
assessment method for seismic vulnerability assessment of
existing buildings. Through the review it is observed that in
most of the vulnerability assessmentmethods,significanceof
elements such as staircases and lift shafts has not been
considered. Therefore, there is need for further research
required to develop experimental methods considering the
changes in stiffness and overall resistance of buildings. The
document outlined that while selecting a particular
methodology one should taken into account the type of
building/structure, availability of expertise, availability of
ground motion data, and availability of previous earthquake
damage records etc.
Sumit. A. Patel etal(2016)conductedafragilityanalysis
of high-rise building structures using ETABS software. They
have developed fragility curves for the building with X-
bracing, V-bracing. The fragility curves developedintermsof
PGA for Limit state: slight, Moderate, major and collapse in
lognormal distribution. Resultsshowedthattheprobabilities
of damage of structure for repairable, damage state in
medium soil consider decreases as we shift from the Bare to
X-bracing structureand further increasefromX-bracingtoV-
bracing structure in various stories. From Non-linear static
analysis, generations of hinges in X-bracing are less than V-
bracing and Bare structure. So, X- bracing works very
effectively in earthquake loading.
4. SUMMERY AND CONCLUSIONS
Afterreviewingsomeoftheliteratureworks
done by different scholars and researchers in the
development of fragility curves, it is understoodthatfragility
curve is found to be an efficient tool for studying the
vulnerability of a structure under various strong ground
motions. While in the development of fragility curves,
analyticalapproach is most common and thus widely usedin
various studies. Also fragility curves are generated from
multiple Incremental Dynamic Analysis or IDA curves with
the help of traditional curve fitting technique. Since it is a
tedious and time consuming process, further studies are
recommended in this area.
Also while analyzing the papers, it is noticed that
major studies were done only up to mid-rise buildings and a
limited number of studies were conducted on high- rise
buildings. Thus a study in the field of vulnerability
assessment on a high-rise building is highly recommended.
Installation of different base isolators helps to safe
guard the building when different ground motion intensities
hit the building. The papers outlined that Friction Pendulum
Bearing System (FPS)reduces the storey drift of the building
under varying ground intensity motions, especiallywhenthe
number of storeys increases.
While keeping all those in mind, an effective study can be
done mainly concentrating on earthquake vulnerability
assessment of a high- rise RC building with Friction
Pendulum System (FPS) as the main base isolator.
REFERENCES
[1] Aiswarya S, Nandita Mohan. (2014), “Vulnerability
Analysis by the Development of Fragility Curves”, IOSR
Journal of Mechanical and Civil Engineering (IOSR-
JMCE), Vol.2, pp. 33-40.
[2] Amiri Hormozak E. (2013), “Analytical fragility curves
for horizontally curved steel girderhighway bridges”,
(Doctoral dissertation), University of Nevada, Reno.
[3] Ashish R. Akhare, Tejas R.Wankhade. (2014), “Seismic
performance of RC structure using different base
isolator”, IJESRT International Journal of Engineering
Sciences & Research Technology, pp. 724-729.
[4] Bakhshi A & Mostafavi S.A.(2014), “Development of
fragility curves for base isolated RC structures”,
Proceedings of the 9th International Conference on
Structural Dynamics, EURODYN.
[5] Bhatti A. Q, Varum H & Zeeshan Alam. (2013), “Seismic
vulnerability assessment and evaluation on a high rise
building in Islamabad”, Journal of Asian Earth Sciences,
42:3,468-478.
[6] Chandak N. R.(2013), “Effect of base isolation on the
response of RC Building”, Journal of Civil Engineering
Research, Vol. 3,No. 4, pp. 135-142.
[7] Dhawade S. M.(2014),“Comparative Study for Seismic
Performance of BaseIsolated & Fixed Based RC Frame
Structure”, International Journal of Civil Engineering
Research, Vol. 5, No. 2 (2014), pp. 183-190.](https://image.slidesharecdn.com/irjet-v4i3511-171230112607/75/A-Review-on-Earthquake-Vulnerability-Assessment-4-2048.jpg)
![International Research Journal of Engineering and Technology (IRJET) e-ISSN: 2395 -0056
Volume: 04 Issue: 03 | Mar -2017 www.irjet.net p-ISSN: 2395-0072
© 2017, IRJET | Impact Factor value: 5.181 | ISO 9001:2008 Certified Journal | Page 1889
[8] Luigi Petti.(2013),“Modelling and analysis of base
isolated structures with Friction Pendulum System
considering near fault events”, Open Journal of Civil
Engineering, 3, 86-93.
[9] Marco Vona.(2014),“Fragility curves of existing RC
buildings based on specific structural performance
levels”, Open Journal of Civil Engineering,Vol.4,pp.120-
134, May.
[10] Murat Serdar Kircil, Zekeriya Polat. (2006), “Fragility
analysis of mid-rise R/C frame buildings”, Engineering
Structures 28 (2006) 1335–1345.
[11] Nikolay Kravchuk, Ryan Colquhoun.(2008),
“Development of a Friction PendulumBearing Base
Isolation SystemforEarthquakeEngineeringEducation”,
Proceedings of the 2008 American Society for
Engineering Education Pacific Southwest
AnnualConference.
[12] Shah N. N & Tande S. N.(2014), “Study of the stiffening
systems for seismic loads in multi storied
building”,International Journal of Engineering Science
&Technology, 6(6).
[13] Sumit.A.Patel, A.R.Darji. (2016), “Fragility analysis of
high-rise building structure”,Journal of Emerging
Technologies and Innovative Research (JETIR), Volume
3, Issue 7.
[14] TarannumYasmin, Ajay Chourasia.(2015), “Fragility
analysis for seismic vulnerability assessment of
buildings: a review”, International Research Journal of
Engineering and Technology (IRJET), Volume: 02 Issue:
06.
[15] Vamvatsikos D, Cornell C. A. (2002), “Incremental
Dynamic Analysis”, Submitted to Earthquake
Engineering and Structural Dynamics, John Wiley &
Sons, Ltd.](https://image.slidesharecdn.com/irjet-v4i3511-171230112607/75/A-Review-on-Earthquake-Vulnerability-Assessment-5-2048.jpg)

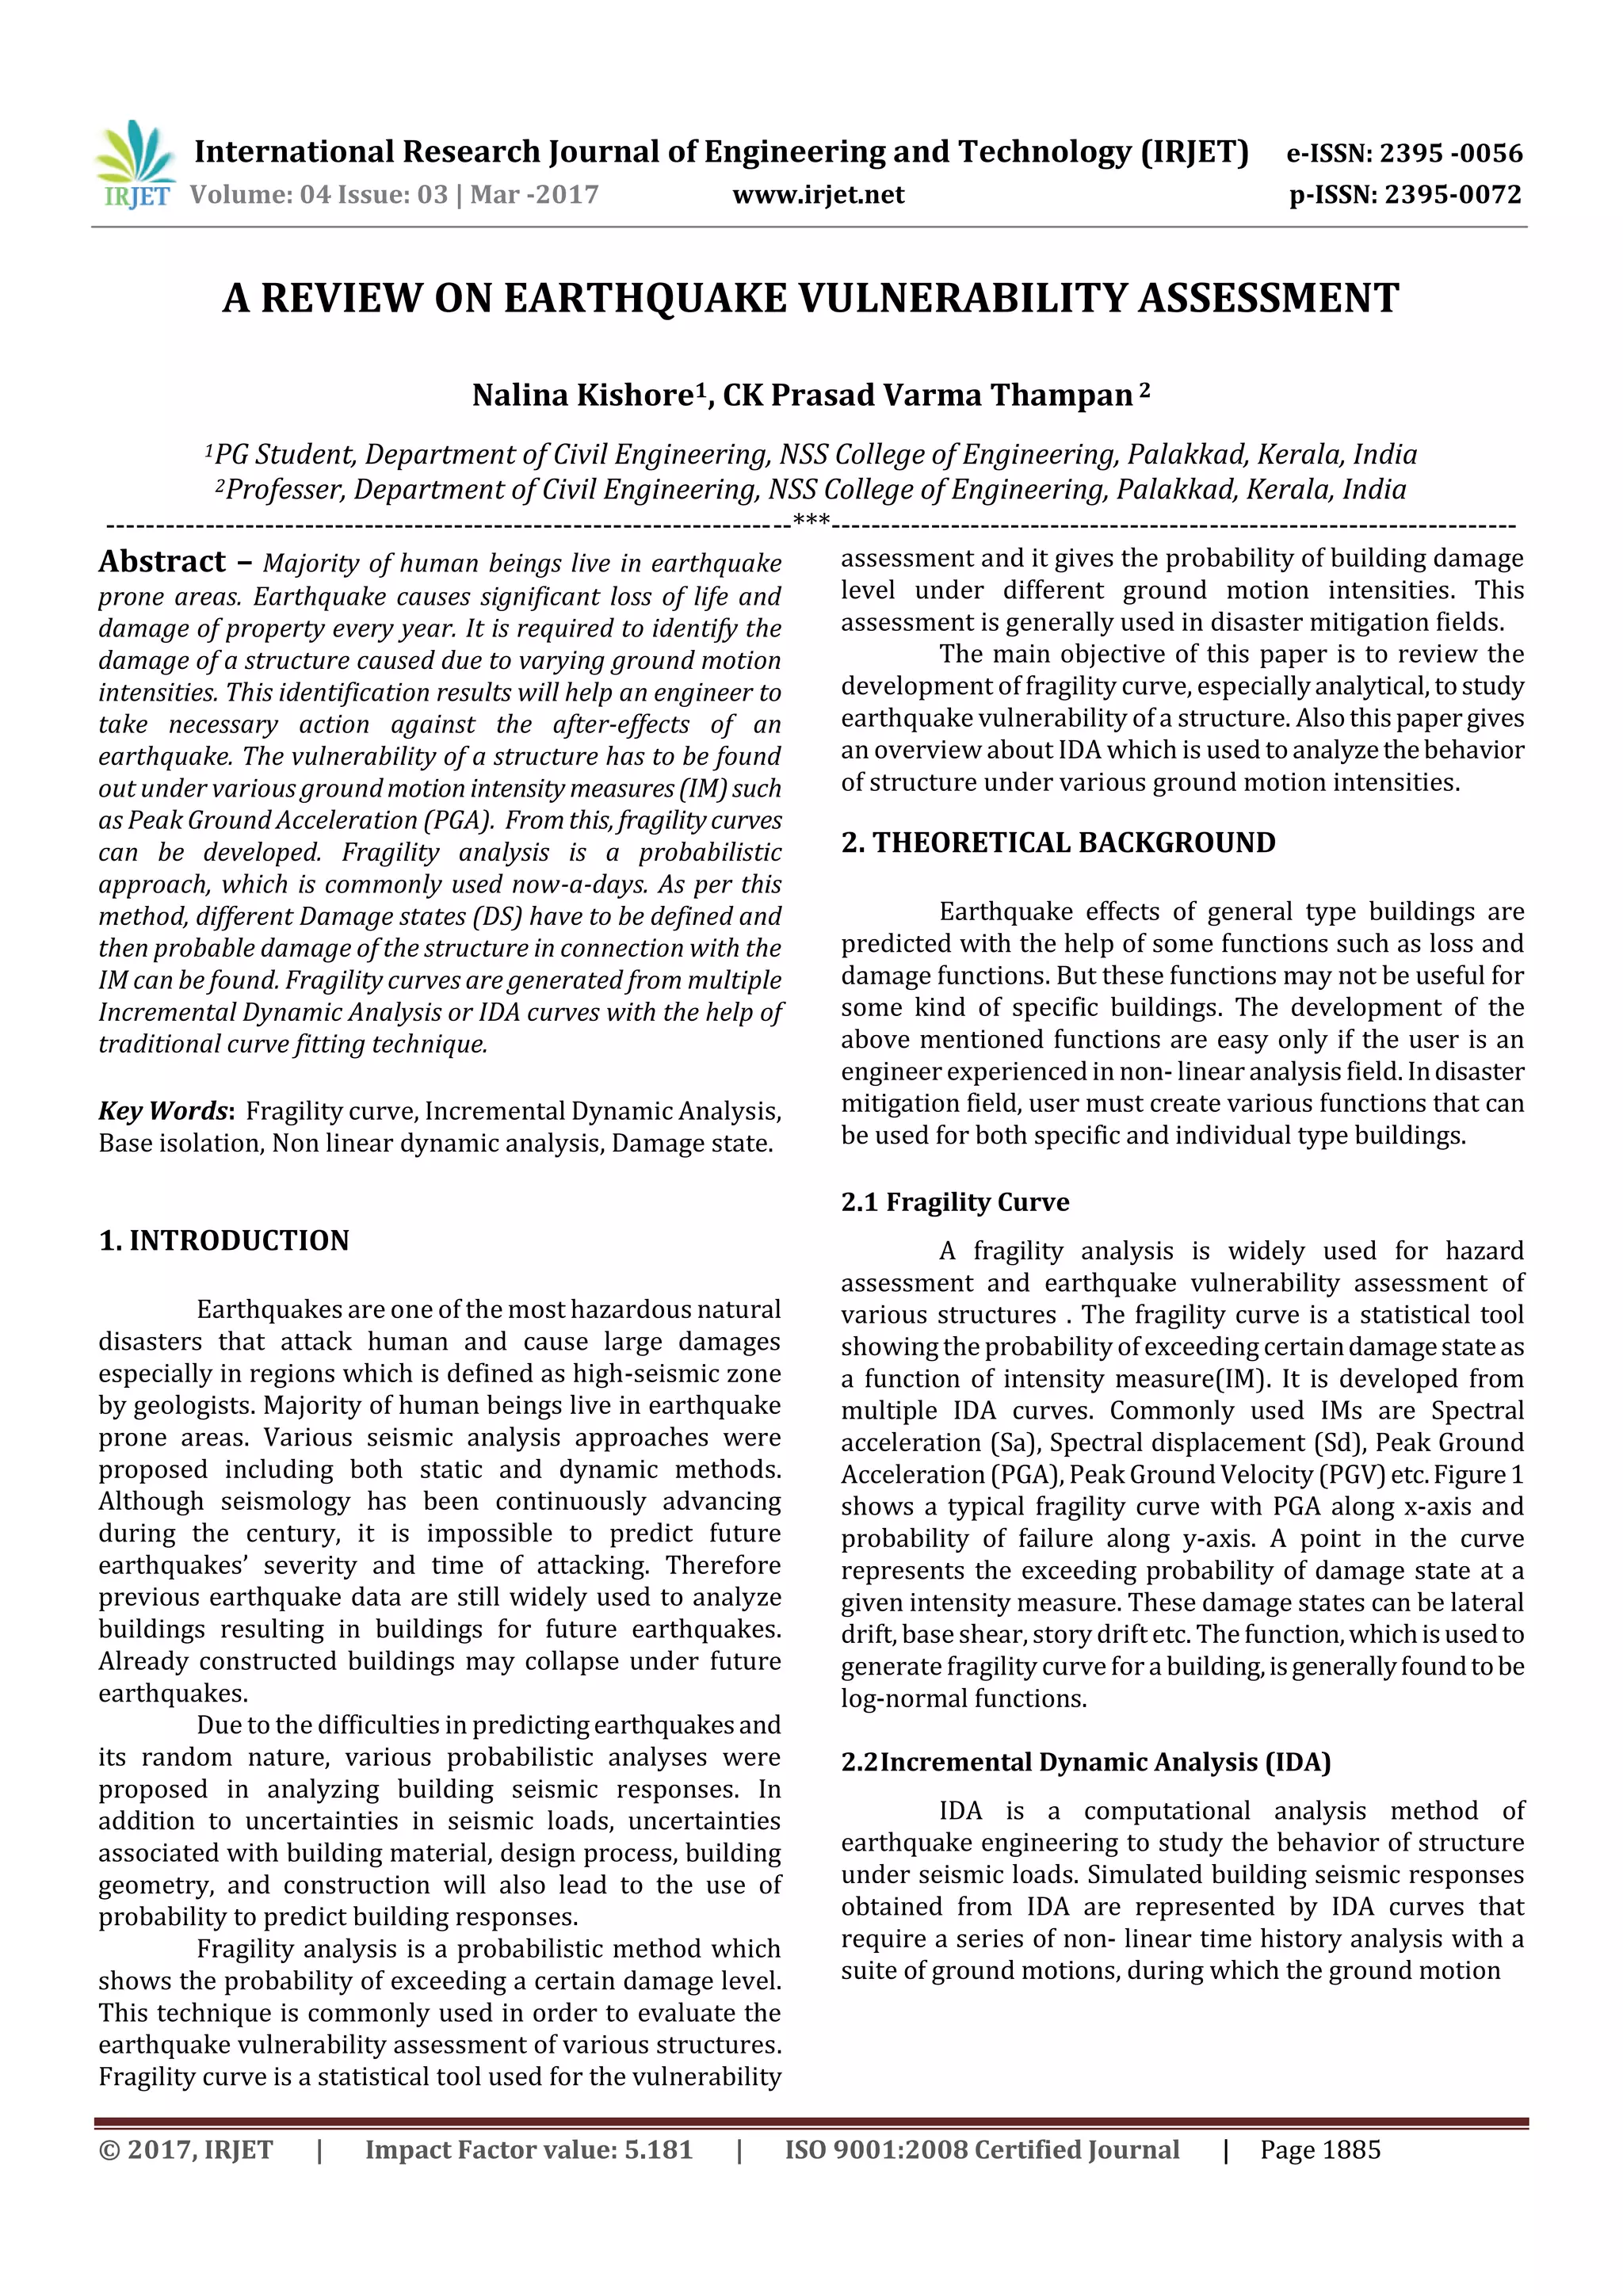
This document provides a review of earthquake vulnerability assessment. It discusses fragility curves, which show the probability of exceeding certain damage levels as a function of ground motion intensity. Fragility curves are developed using incremental dynamic analysis (IDA), which involves performing nonlinear time history analyses while gradually increasing ground motion intensities. IDA provides structural response over a range of intensities from elastic to collapse. The document also reviews several studies on developing fragility curves for buildings using IDA and analyzing the seismic performance of base isolated structures through experimental testing.