Download as PDF, PPTX

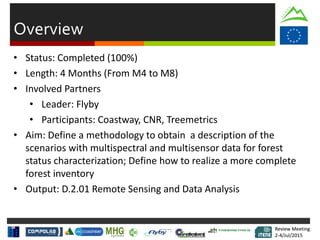
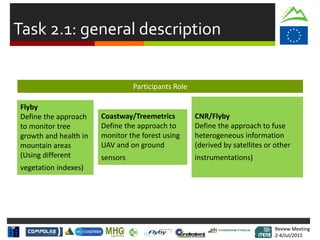
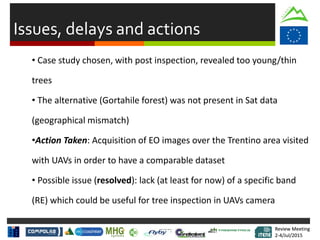
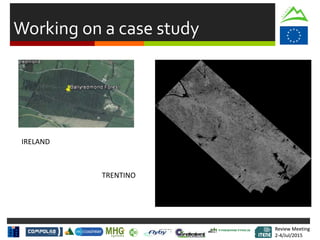

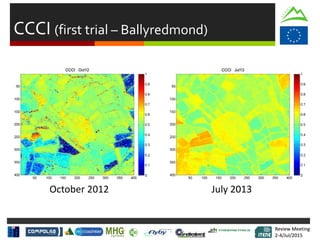
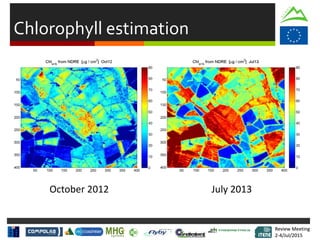
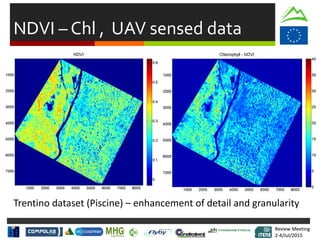
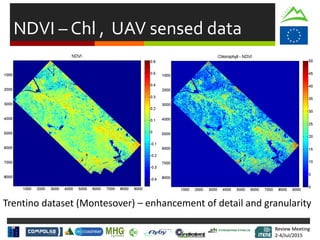
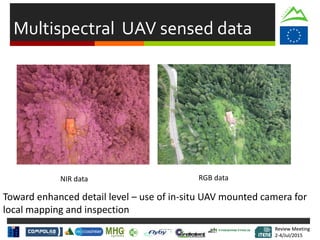
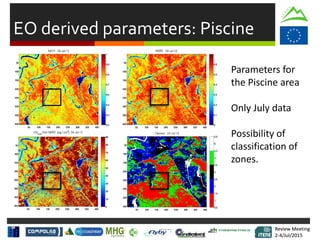
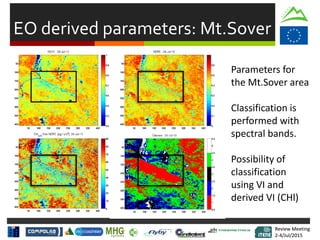
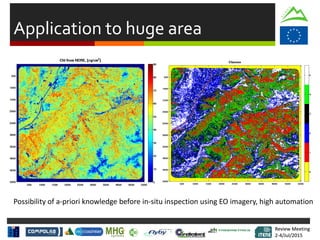


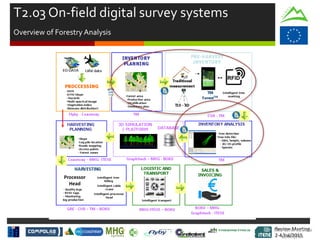
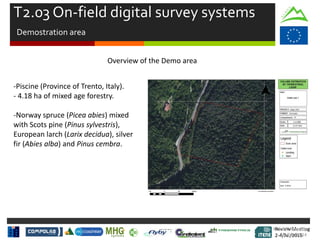

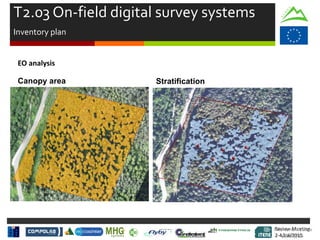
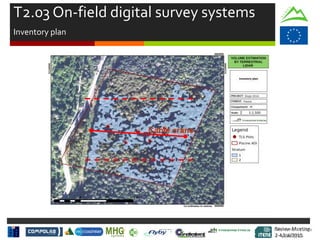
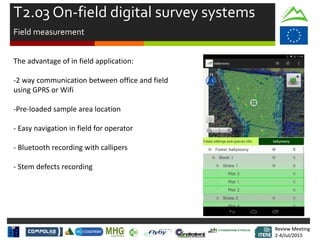
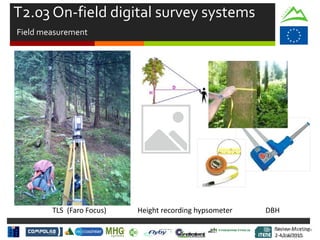

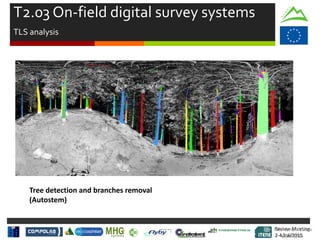
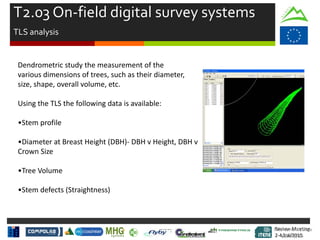
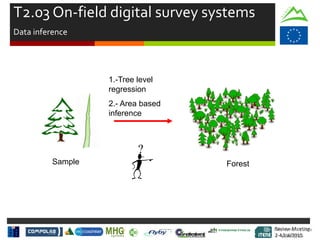
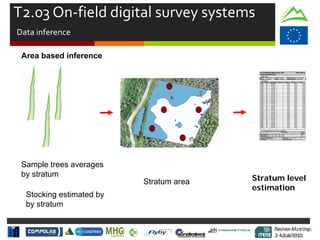
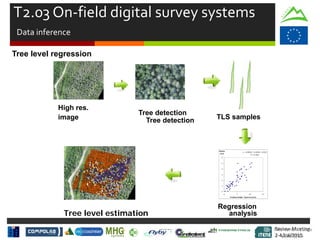
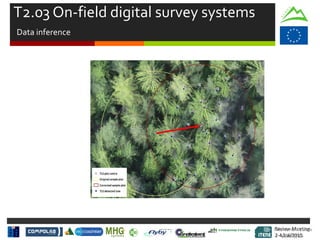
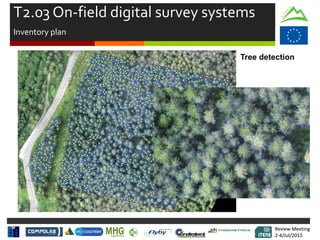
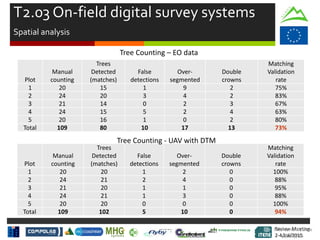


This document summarizes a review meeting for Project SLOPE Work Package 2 on forest information collection and analysis. The task involved defining a methodology to characterize forest status using remote sensing data from multiple sensors. Partners completed the task of determining useful vegetation indices from satellite, UAV, and laser scanning data to estimate biological parameters. The group analyzed parameters with increasing detail and resolved issues related to selecting case study sites with comparable satellite and UAV data. They concluded that the work established an integrated system to monitor forests and provided detailed tree-level information for management using different data sources.


