SlideShare a Scribd company logo
1 of 25
Download to read offline
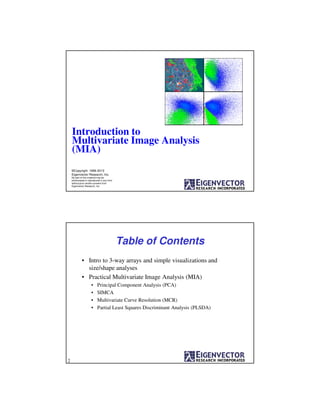
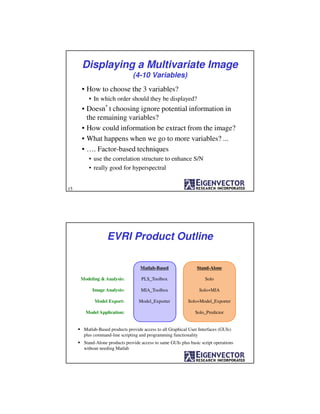
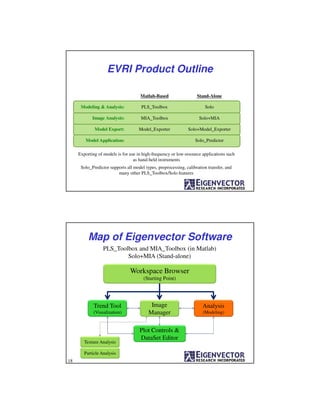
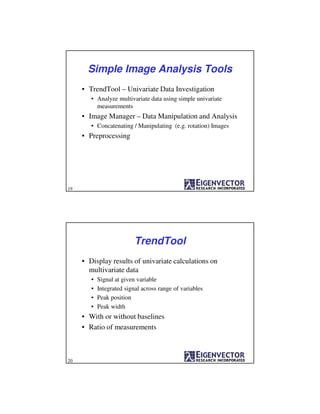
Introduction to
Multivariate Image Analysis
(MIA)
©Copyright 1996-2013
Eigenvector Research, Inc.
No part of this material may be
photocopied or reproduced in any form
without prior written consent from
Eigenvector Research, Inc.
Table of Contents
• Intro to 3-way arrays and simple visualizations and
size/shape analyses
• Practical Multivariate Image Analysis (MIA)
• Principal Component Analysis (PCA)
• SIMCA
• Multivariate Curve Resolution (MCR)
• Partial Least Squares Discriminant Analysis (PLSDA)
2
Eigenvector University
Our week long series of courses each spring
• May 10-15, 2015 Seattle, Washington, USA
• 6 full days and 3 evenings
• 15 hands-on courses
• 8 instructors (Eigenvector staff + Rasmus Bro)
• User poster session and group meeting
EigenU Europe
• Oct 5-8, 2015 Hillerød, DENMARK
• 4 full days
• 7 hands-on courses
Training
We offer standard and custom courses on a range of chemometric and
application topics:
Chemometrics Without Equations Series
Chemometrics Without Equations
Advanced Chemometrics Without Equations
Basic Chemometrics Series
Linear Algebra for Chemometricians
MATLAB for Chemometricians
Chemometrics I -- PCA
Chemometrics II -- Regression and PLS
Clustering and Classification
Advanced and Specialty Topics
Advanced Preprocessing
Applied Multiway Analysis
Multivariate Statistical Process Control for PAT
Calibration Model Maintenance
Calibration Transfer and Instrument Standardization
Chemometrics in Mass Spectrometry
Chemometrics in Metabolomics
Classical Least Squares (CLS) Methods
Common Mistakes in Chemometrics
Correlation Spectroscopy
Design of Experiments for QbD
Getting PLS_Toolbox/Solo Models Online
Hierarchical and Optimized Models
Implementing Chemometrics in PAT
Introduction to Multivariate Image Analysis
Modeling Fluorescence EEM Data
MSPC-Multivariate Statistical Process Control
Multi-block, Multi-set, and Data Fusion Methods
Multivariate Curve Resolution
Non-linear Methods for Calibration and Classification
PLS_Toolbox Beyond the Interfaces
Robust Methods
Variable Selection
Bring Your Own Data (BYOD)
And we're always adding more…
Resources
• Hyperspectral Image Analysis, eds. P. Geladi and H. Grahn, Wiley (2007), ISBN 978-0-470-01086-0
• Chemometrics, M.A. Sharaf, D.L. Illman and B.R. Kowalski, Wiley-Interscience (1986) ISBN 0-471-83106-9
• Multivariate Analysis, K.V. Mardia, J.I. Kent and J.M. Bibby, Academic Press, (1979) ISBN 0-12-471252-2
• Multivariate Calibration, H. Martens and T. Næs, John Wiley & Sons Ltd. (1989) ISBN 0-471-90979-3
• Chemometrics: a textbook, D.L. Massart et al., Elsevier (1988) ISBN 0-444-42660-4
• Chemometrics: A Practical Guide, K.R. Beebe, R.J. Pell, M.B. Seasholtz, Wiley (1998) ISBN 0-471-12451-6
• Multivariate Data Analysis In Practice, Kim H. Esbensen, CAMO ASA (2000), ISBN 82-993330-2-4
• A user-friendly guide to Multivariate Calibration and Classification, T. Næs, T. Isaksson, T. Fearn, T. Davies,
NIR Publications(2002), ISBN 0-9528666-2-5
• Journal of Chemometrics
• IEEE Trans. on Geosci. and Remote Sensing
• Chemometrics and Intelligent Laboratory Systems
• Analytical Chemistry
• Analytica Chemica Acta
• Applied Spectroscopy
• Critical Reviews in Analytical Chemistry
• Journal of Process Control
• Computers in Chemical Engineering
• Technometrics
• ....
5
Univariate Image
• Grey scale
• each pixel is an number defining an
intensity level e.g.,
• integer (0 to 255) unsigned 8-bit
• integer (0 to 4095)
• double (floating point)
100 200 300
100
200
300
400
500
600
y-pixels
x-pixels
MxxMy pixels
provides spatial
information
6
100 200 300
100
200
300
400
500
600
Multivariate Image
(3 Variables)
• Red/Green/Blue (RGB) (e.g. JPEG)
• each layer defines color intensity level
• much more information-rich
7
Image Analysis
• Many methods have been developed to examine
the spatial structure w/in an image
• the methods recognize spatial patterns within an image
• based on the light / dark contrast and continuity of regions
• edge detection, image sharpening, wavelets
• particle size distributions, machine vision, medical
applications, security, …
• MIA has been traditionally applied to the spectral
dimension first followed by spatial analysis
• some methods that examine both are appearing
8
Multivariate Image
(4-10 Variables)
• Measure at several wavelengths (e.g., Landstat)
blue
green
red
NIR
SWIR-1
SWIR-2
thermal
How should we display
a seven variable image?
9
Multivariate Image
(4-10 Variables)
• Choose 3 of 7 (Landstat)
Montana (blue/SWIR-1/thermal)
100 200 300 400 500
50
100
150
200
250
300
350
400
450
500
100 200 300 400 500
50
100
150
200
250
300
350
400
450
500
Paris (NIR/blue/SWIR-1)*
*contrast enhanced
10
Hyperspectral Image
(>10 Variables)
• Spectrum at each pixel
• could be 100-1000s of variables
• often floating point double 10-100s Mbytes
y ν
x
800 900 1000 1100 1200 1300 1400 1500 1600
0
0.5
1
1.5
Wavelength (nm)
Absorbance
each pixel is a spectrum
each voxel is a channel
in the spectrumPixels Spatial Information
Spectral Chemical Information
11
File Formats
Inherent Image Formats
• Cameca Ion-Tof BIF/BIF6 Image (BIF,BIF6)
• ENVI Image Format (HDR)
• Lispix Raw Formatted Image (RAW)
• Multi-layer TIFF files (TIFF)
• Physical Electronics RAW Image (RAW)
• Image standard (JPG, TIFF, GIF, BMP, PNG)
Non-Image Formats (add image context after load)
• Text (e.g. CSV)
• Thermo-Galactic SPC (binary)
12
Memory Considerations
• 512 x 512 pixels and 2048 variables
= 536 Million data points
= 4.3 GB memory (double precision)
BEFORE preprocessing!
• Larger images require 64-bit computers with 4GB
or more of memory
13
Multivariate Images
• Data array of dimension three (or more)
• where the first two dimensions are spatial and
• the last dimension(s) is a function of another variable
(e.g, spectroscopy).
• Chemical system(s) of interest include
• microscopic, medical, machine vision, process
monitoring crystallization, stand-off and remote
sensing, …
• vapors, liquids, solids (or combination)
• visible, infra-red, Raman, mass spectroscopy, …
14
Displaying a Multivariate Image
(4-10 Variables)
• How to choose the 3 variables?
• In which order should they be displayed?
• Doesn’t choosing ignore potential information in
the remaining variables?
• How could information be extract from the image?
• What happens when we go to more variables? ...
• …. Factor-based techniques
• use the correlation structure to enhance S/N
• really good for hyperspectral
15
Matlab-Based Stand-Alone
PLS_Toolbox SoloModeling & Analysis:
MIA_Toolbox Solo+MIAImage Analysis:
Model_Exporter Solo+Model_ExporterModel Export:
Solo_PredictorModel Application:
Matlab-Based products provide access to all Graphical User Interfaces (GUIs)
plus command-line scripting and programming functionality
Stand-Alone products provide access to same GUIs plus basic script operations
without needing Matlab
EVRI Product Outline
Matlab-Based Stand-Alone
PLS_Toolbox SoloModeling & Analysis:
MIA_Toolbox Solo+MIAImage Analysis:
Model_Exporter Solo+Model_ExporterModel Export:
Solo_PredictorModel Application:
Exporting of models is for use in high-frequency or low-resource applications such
as hand-held instruments
Solo_Predictor supports all model types, preprocessing, calibration transfer, and
many other PLS_Toolbox/Solo features
EVRI Product Outline
Map of Eigenvector Software
18
Workspace Browser
(Starting Point)
Trend Tool
(Visualization)
Plot Controls &
DataSet Editor
Image
Manager
Analysis
(Modeling)
PLS_Toolbox and MIA_Toolbox (in Matlab)
Solo+MIA (Stand-alone)
Particle Analysis
Texture Analysis
Simple Image Analysis Tools
• TrendTool – Univariate Data Investigation
• Analyze multivariate data using simple univariate
measurements
• Image Manager – Data Manipulation and Analysis
• Concatenating / Manipulating (e.g. rotation) Images
• Preprocessing
19
TrendTool
• Display results of univariate calculations on
multivariate data
• Signal at given variable
• Integrated signal across range of variables
• Peak position
• Peak width
• With or without baselines
• Ratio of measurements
20
Opening TrendTool
Image Manager Toolbar
Plot Controls WindowWorkspace Browser
21
TrendTool Windows: Data View
Use Data View to:
• Set analysis markers
• Choose analysis mode
• Select references and
baseline points
Hints:
• Right-click white space
to set marker or use
toolbar button
• Drag markers to move
• Right-click markers to
change types
• Use toolbar to save or
load marker sets
22
TrendTool Windows: Trend View
Results displayed in Trend View
• Single marker displays with
false-color
• Multiple markers display in
RGB
Toolbar Buttons:
• autoscale image
• select pixels to display in
Data View
• save or spawn plot of
results (respectively)
23
TrendTool Analysis Modes
• Height – gives response at position (single marker)
• Area – gives integrated response between markers
• Position – gives position of peak response between
markers
• Width – gives full width at half height between
markers
"Add Reference" to subtract a single point baseline.
Convert reference to baseline (via right-click) to do
two-point linear baseline.
"Normalize to Region" to normalize all regions to the
response of the selected region.
24
Opening Image Manager
Plot Toolbar
Plot Controls WindowWorkspace Browser
25
Currently Loaded
Images List
Load / Import
Images Controls
Image Manager &
Tools Settings
Image Manager Overview
26
Image Groups
Grouping allows you to:
• Combine images into a single DataSet for analysis
• Apply a univariate operation (rotate, crop, etc) to all images
Example: combining three slabs of RGB image
Image Group Controls
27
Image Groups
click to view
28
With all 3 images
loaded and grouped
Concatenating Images
29
Concatenating Images:
Spatial Domain
(768 x 1536) x 1
X, Y, Z, or tile…
30
Concatenating Images:
Variable Domain
(768 x 512) x 3
31
Group Manipulation Example:
Rotation
Hint: to apply an action to only ONE image, click the
"Apply Changes to Image Group" button until only one
thumbnail is outlined in the image group pane.
32
Image-Oriented Preprocessing
• Image-specific preprocessing operates in pixel-space
and are either Intensity or Binary based
• Intensity-Based Image Correction:
• Background Subtraction (Flatfield): Rolling-ball background subtraction
for images.
• Min: Min value over neighboring pixels. (filter out high-value pixels)
• Max: Max value over neighboring pixels. (filter out low-value pixels)
• Mean: Mean value over neighboring pixels. (filter out low/high pixels)
• Median: Median value over neighboring pixels. (robust filter of low/high
pixels)
• Trimmed Mean: Trimmed mean value over neighboring pixels.
• Trimmed Median: Trimmed median value over neighboring pixels.
• Smooth: Spatial smoothing for images. (a weighted mean)
33
Image-Oriented Preprocessing
• Binary-Based Image Correction
• Dilate: Perform dilation on a binary image.
• Erode: Perform erosion on a binary image.
• Close (Dilate+Erode): Perform dilation followed by erosion on a binary
image.
• Open (Erode+Dilate): Perform erosion followed by dilation on a binary
image.
• NOTE: Image-Oriented methods may break covariance (add
multivariate rank) because variable slabs handled separately
• Standard variable-space preprocessing can be used too, but are
spatially insensitive
34
MIA: PCA-Based Methods
• Many methods are based on the spectroscopic
information in an image
• although spatial information is ignored mathematically
• images are examined for spatial structure
• PCA (Principal Components Analysis)
• Exploratory analysis
• SIMCA (Soft Independent Method Class Analogy)
• Classification
35
Image PCA
• Matricizing
• PCA: scores, scores images, loadings
• unusual samples Q and T2
• score-score plots, density plots
• linking scores and image plane(s)
• contrast enhancement
36
Matricizing (a.k.a. Unfolding)
• PCA works on X (MxN) but the image is
MxxMyxN
• reshape by matricizing such that each pixel is a row in a
new MxMyxN matrix
…
…
Original Image
MxxMyxN
Matricized Image
MxMyxN
y
…
…
…
ν
x
ν
37
PCA Math Summary
• For a data matrix X with M samples and N variables
(generally assumed to be mean centered and properly
scaled), the PCA decomposition is
Where R ≤ min{M,N}, and the tkpk
T pairs are ordered by the
amount of variance captured.
• Generally, the model is truncated to K PCs, leaving some
small amount of variance in a residual matrix E:
• where T is MxK and P is NxK.
1 1 2 2
T T T T
K K= + + + + = +X t p t p t p E TP EK
1 1 2 2
T T T T
K K R R= + + + + +X t p t p t p t pK K
38
Properties of PCA
• tk,pk ordered by amount of variance captured
• λk are the eigenvalues of XTX → XTXpk = λkpk
• λk are ∝	variance	captured
• tk (scores) form an orthogonal set TK (MxK)
• describe relationship between samples → pixels (M = MxMy)
• pk (loadings) form an orthonormal set PK (NxK)
• describe relationship between variables
= t1
p1
T
+ t2
p2
T
+..+ tK
pK
T
+X E
39
0
2
4
6
0
2
4
6
0
2
4
6
8
PC 1
Variable3
Mean Vector
PC 2
PCA Graphically
40
Reshape Scores To Images
• PCA gives scores T (MxK) which is reshaped to
scores images (MxxMyxK)
• each score vector is a MxxMy scores image
…
…
Original Scores
MxMyxK
Scores Images
MxxMyxK
y
…
…
…
x
k
41
• scores and loadings plots are interpreted in pairs
• plot tk vs sample number
• find relationship between samples → pixels
• each MxMyx1 score vector is reshaped to a MxxMy matrix that
can be visualized as a "scores image" showing spatial
relationships between pixels
• pk vs variable number
• relationship between variables responsible for observations in
samples
• it is useful to plot tk+1 vs. tk and pk+1 vs. pk
• examine image and score / score plots
Plots / Images for PCA
42
Image PCA Conclusions
• Image PCA is a useful unsupervised pattern
recognition technique for exploring images
• scores and loadings are useful for determining what
original variables are responsible for differences
observed in an image
• score-score plots and linked score plots
• contrast enhancement might be needed to see small changes
• Image SIMCA is a useful supervised pattern
recognition technique
• find similar / dissimilar portions of an image very
quickly
43
MCR
• Based on the classical least squares (CLS) model,
attempt to estimate C and S given X:
X = CST
+ E
where
X is a MxN matrix of measured responses,
C is a MxK matrix of pure analyte contributions,
S is a NxK matrix of pure analyte spectra, and
E is a MxN matrix of residuals.
44
MCR Objective
• Decompose a data matrix into chemically
meaningful factors
• pure analyte spectra
• pure analyte concentrations
• Easy to interpret
• provides chemically / physically meaningful
information
• caveats:
• rotational and multiplicative ambiguity
• use of constraints
45
46
Linear Discriminant Analysis
• LDA seeks axis (in n-D space) which maximizes
ratio of between class to within class variance
X2
Projection onto axis
X1
X2
an axis
e.g., PC1
LDA
47
Partial Least Squares Discriminate
Analysis (PLS-DA)
• Exactly as with Linear Discriminant Analysis
(LDA), the objective is to determine an axis to
project data on that discriminates between classes
• choose axis so individual distributions are narrow
• choose axis so centers of distributions are far apart
• Determine axes from factor-based model of data
therefore more stable with high collinearity.
• Automatically attempts to identify directions of
interest!
48
• Use logicals (0,1) in Y-block to indicate if sample
belongs to a class or not dummy variables
• Develop PLS model to predict class block
• Thresholds must be set between 0 and 1 to indicate
if new samples are a member of
each class...
Can use Bayes theorem to set
threshold and include prior probability
of each class
Partial Least Squares Discriminate
Analysis (PLS-DA)
Regression
Vector
Threshold
Image PLSDA and
SIMCA Conclusions
• If classes (regions) are known, PLSDA is a useful
supervised pattern recognition technique for
exploring images
• can often bring out more contrast than PCA
• If only examples of one class are known, then
SIMCA (i.e. PCA models) should be used
49
Comments on Presenting Images
• Images are representations of spatial and chemical
information, …
• but they can be mis-used.
• users can control colors and contrasting and select
channels or PCs (or rotations thereof)
• as a result some things can be highlighted while others
can be hidden
• It is important to report how images were
constructed
• the work must be reproducible
50

More Related Content

What's hot

Going Smart and Deep on Materials at ALCF
Going Smart and Deep on Materials at ALCFGoing Smart and Deep on Materials at ALCF
Going Smart and Deep on Materials at ALCFIan Foster
 
The Face of Nanomaterials: Insightful Classification Using Deep Learning - An...
The Face of Nanomaterials: Insightful Classification Using Deep Learning - An...The Face of Nanomaterials: Insightful Classification Using Deep Learning - An...
The Face of Nanomaterials: Insightful Classification Using Deep Learning - An...PyData
 
CSense: A Stream-Processing Toolkit for Robust and High-Rate Mobile Sensing A...
CSense: A Stream-Processing Toolkit for Robust and High-Rate Mobile Sensing A...CSense: A Stream-Processing Toolkit for Robust and High-Rate Mobile Sensing A...
CSense: A Stream-Processing Toolkit for Robust and High-Rate Mobile Sensing A...Farley Lai
 
Static Memory Management for Efficient Mobile Sensing Applications
Static Memory Management for Efficient Mobile Sensing ApplicationsStatic Memory Management for Efficient Mobile Sensing Applications
Static Memory Management for Efficient Mobile Sensing ApplicationsFarley Lai
 
Overview of DuraMat software tool development
Overview of DuraMat software tool developmentOverview of DuraMat software tool development
Overview of DuraMat software tool developmentAnubhav Jain
 
High Performance Stream Processing and Optimizations
High Performance Stream Processing and OptimizationsHigh Performance Stream Processing and Optimizations
High Performance Stream Processing and OptimizationsFarley Lai
 
AdaM: an Adaptive Monitoring Framework for Sampling and Filtering on IoT Devices
AdaM: an Adaptive Monitoring Framework for Sampling and Filtering on IoT DevicesAdaM: an Adaptive Monitoring Framework for Sampling and Filtering on IoT Devices
AdaM: an Adaptive Monitoring Framework for Sampling and Filtering on IoT DevicesDemetris Trihinas
 
Core Objective 1: Highlights from the Central Data Resource
Core Objective 1: Highlights from the Central Data ResourceCore Objective 1: Highlights from the Central Data Resource
Core Objective 1: Highlights from the Central Data ResourceAnubhav Jain
 
Ieee gold 2010 resta
Ieee gold 2010 restaIeee gold 2010 resta
Ieee gold 2010 restagrssieee
 
Low-Cost Adaptive Monitoring Techniques for the Internet of Things
Low-Cost Adaptive Monitoring Techniques for the Internet of ThingsLow-Cost Adaptive Monitoring Techniques for the Internet of Things
Low-Cost Adaptive Monitoring Techniques for the Internet of ThingsDemetris Trihinas
 
Adam - Adaptive Monitoring in 5min
Adam - Adaptive Monitoring in 5minAdam - Adaptive Monitoring in 5min
Adam - Adaptive Monitoring in 5minDemetris Trihinas
 
Implementation Cost Analysis of the Interpolator for the Wimax Technology
Implementation Cost Analysis of the Interpolator for the Wimax TechnologyImplementation Cost Analysis of the Interpolator for the Wimax Technology
Implementation Cost Analysis of the Interpolator for the Wimax Technologyiosrjce
 
Performance Analysis of Fractional Sample Rate Converter Using Audio Applicat...
Performance Analysis of Fractional Sample Rate Converter Using Audio Applicat...Performance Analysis of Fractional Sample Rate Converter Using Audio Applicat...
Performance Analysis of Fractional Sample Rate Converter Using Audio Applicat...iosrjce
 
Semantically-Enabling the Web of Things: The W3C Semantic Sensor Network Onto...
Semantically-Enabling the Web of Things: The W3C Semantic Sensor Network Onto...Semantically-Enabling the Web of Things: The W3C Semantic Sensor Network Onto...
Semantically-Enabling the Web of Things: The W3C Semantic Sensor Network Onto...Laurent Lefort
 
Acoustic Scene Classification by using Combination of MODWPT and Spectral Fea...
Acoustic Scene Classification by using Combination of MODWPT and Spectral Fea...Acoustic Scene Classification by using Combination of MODWPT and Spectral Fea...
Acoustic Scene Classification by using Combination of MODWPT and Spectral Fea...ijtsrd
 
Extend Your Journey: Considering Signal Strength and Fluctuation in Location-...
Extend Your Journey: Considering Signal Strength and Fluctuation in Location-...Extend Your Journey: Considering Signal Strength and Fluctuation in Location-...
Extend Your Journey: Considering Signal Strength and Fluctuation in Location-...Chih-Chuan Cheng
 

What's hot (16)

Going Smart and Deep on Materials at ALCF
Going Smart and Deep on Materials at ALCFGoing Smart and Deep on Materials at ALCF
Going Smart and Deep on Materials at ALCF
 
The Face of Nanomaterials: Insightful Classification Using Deep Learning - An...
The Face of Nanomaterials: Insightful Classification Using Deep Learning - An...The Face of Nanomaterials: Insightful Classification Using Deep Learning - An...
The Face of Nanomaterials: Insightful Classification Using Deep Learning - An...
 
CSense: A Stream-Processing Toolkit for Robust and High-Rate Mobile Sensing A...
CSense: A Stream-Processing Toolkit for Robust and High-Rate Mobile Sensing A...CSense: A Stream-Processing Toolkit for Robust and High-Rate Mobile Sensing A...
CSense: A Stream-Processing Toolkit for Robust and High-Rate Mobile Sensing A...
 
Static Memory Management for Efficient Mobile Sensing Applications
Static Memory Management for Efficient Mobile Sensing ApplicationsStatic Memory Management for Efficient Mobile Sensing Applications
Static Memory Management for Efficient Mobile Sensing Applications
 
Overview of DuraMat software tool development
Overview of DuraMat software tool developmentOverview of DuraMat software tool development
Overview of DuraMat software tool development
 
High Performance Stream Processing and Optimizations
High Performance Stream Processing and OptimizationsHigh Performance Stream Processing and Optimizations
High Performance Stream Processing and Optimizations
 
AdaM: an Adaptive Monitoring Framework for Sampling and Filtering on IoT Devices
AdaM: an Adaptive Monitoring Framework for Sampling and Filtering on IoT DevicesAdaM: an Adaptive Monitoring Framework for Sampling and Filtering on IoT Devices
AdaM: an Adaptive Monitoring Framework for Sampling and Filtering on IoT Devices
 
Core Objective 1: Highlights from the Central Data Resource
Core Objective 1: Highlights from the Central Data ResourceCore Objective 1: Highlights from the Central Data Resource
Core Objective 1: Highlights from the Central Data Resource
 
Ieee gold 2010 resta
Ieee gold 2010 restaIeee gold 2010 resta
Ieee gold 2010 resta
 
Low-Cost Adaptive Monitoring Techniques for the Internet of Things
Low-Cost Adaptive Monitoring Techniques for the Internet of ThingsLow-Cost Adaptive Monitoring Techniques for the Internet of Things
Low-Cost Adaptive Monitoring Techniques for the Internet of Things
 
Adam - Adaptive Monitoring in 5min
Adam - Adaptive Monitoring in 5minAdam - Adaptive Monitoring in 5min
Adam - Adaptive Monitoring in 5min
 
Implementation Cost Analysis of the Interpolator for the Wimax Technology
Implementation Cost Analysis of the Interpolator for the Wimax TechnologyImplementation Cost Analysis of the Interpolator for the Wimax Technology
Implementation Cost Analysis of the Interpolator for the Wimax Technology
 
Performance Analysis of Fractional Sample Rate Converter Using Audio Applicat...
Performance Analysis of Fractional Sample Rate Converter Using Audio Applicat...Performance Analysis of Fractional Sample Rate Converter Using Audio Applicat...
Performance Analysis of Fractional Sample Rate Converter Using Audio Applicat...
 
Semantically-Enabling the Web of Things: The W3C Semantic Sensor Network Onto...
Semantically-Enabling the Web of Things: The W3C Semantic Sensor Network Onto...Semantically-Enabling the Web of Things: The W3C Semantic Sensor Network Onto...
Semantically-Enabling the Web of Things: The W3C Semantic Sensor Network Onto...
 
Acoustic Scene Classification by using Combination of MODWPT and Spectral Fea...
Acoustic Scene Classification by using Combination of MODWPT and Spectral Fea...Acoustic Scene Classification by using Combination of MODWPT and Spectral Fea...
Acoustic Scene Classification by using Combination of MODWPT and Spectral Fea...
 
Extend Your Journey: Considering Signal Strength and Fluctuation in Location-...
Extend Your Journey: Considering Signal Strength and Fluctuation in Location-...Extend Your Journey: Considering Signal Strength and Fluctuation in Location-...
Extend Your Journey: Considering Signal Strength and Fluctuation in Location-...
 

Viewers also liked

4th Technical Meeting - WP8
4th Technical Meeting - WP84th Technical Meeting - WP8
4th Technical Meeting - WP8SLOPE Project
 
2nd Technical Meeting - WP4
2nd Technical Meeting - WP42nd Technical Meeting - WP4
2nd Technical Meeting - WP4SLOPE Project
 
SLOPE 1st workshop - presentation 4
SLOPE 1st workshop - presentation 4SLOPE 1st workshop - presentation 4
SLOPE 1st workshop - presentation 4SLOPE Project
 
SLOPE 1st workshop - presentation 6
SLOPE 1st workshop - presentation 6SLOPE 1st workshop - presentation 6
SLOPE 1st workshop - presentation 6SLOPE Project
 
Mid-term Review Meeting - WP6
Mid-term Review Meeting - WP6Mid-term Review Meeting - WP6
Mid-term Review Meeting - WP6SLOPE Project
 
Kick-Off Meeting - WP1
Kick-Off Meeting - WP1Kick-Off Meeting - WP1
Kick-Off Meeting - WP1SLOPE Project
 
Kick-Off Meeting - WP8
Kick-Off Meeting - WP8Kick-Off Meeting - WP8
Kick-Off Meeting - WP8SLOPE Project
 
Mid-term Review Meeting - WP3
Mid-term Review Meeting - WP3Mid-term Review Meeting - WP3
Mid-term Review Meeting - WP3SLOPE Project
 
2nd Technical Meeting - WP6
2nd Technical Meeting - WP62nd Technical Meeting - WP6
2nd Technical Meeting - WP6SLOPE Project
 
Slope general introduction
Slope general introductionSlope general introduction
Slope general introductionSLOPE Project
 
SLOPE Final Conference - intelligent machines
SLOPE Final Conference - intelligent machinesSLOPE Final Conference - intelligent machines
SLOPE Final Conference - intelligent machinesSLOPE Project
 
SLOPE Final Conference - intelligent truck
SLOPE Final Conference - intelligent truckSLOPE Final Conference - intelligent truck
SLOPE Final Conference - intelligent truckSLOPE Project
 
3rd Technical Meeting - WP2
3rd Technical Meeting - WP23rd Technical Meeting - WP2
3rd Technical Meeting - WP2SLOPE Project
 
2nd Technical Meeting - WP8
2nd Technical Meeting - WP82nd Technical Meeting - WP8
2nd Technical Meeting - WP8SLOPE Project
 
Kick-Off Meeting - WP5
Kick-Off Meeting - WP5Kick-Off Meeting - WP5
Kick-Off Meeting - WP5SLOPE Project
 
Slope Final Review Meeting - WP2
Slope Final Review Meeting - WP2Slope Final Review Meeting - WP2
Slope Final Review Meeting - WP2SLOPE Project
 
Slope Final Review Meeting - WP7
Slope Final Review Meeting - WP7Slope Final Review Meeting - WP7
Slope Final Review Meeting - WP7SLOPE Project
 
SLOPE 2nd workshop - presentation 3
SLOPE 2nd workshop - presentation 3SLOPE 2nd workshop - presentation 3
SLOPE 2nd workshop - presentation 3SLOPE Project
 
1st Technical Meeting - WP5
1st Technical Meeting - WP51st Technical Meeting - WP5
1st Technical Meeting - WP5SLOPE Project
 
Slope Final Review Meeting - WP4
Slope Final Review Meeting - WP4Slope Final Review Meeting - WP4
Slope Final Review Meeting - WP4SLOPE Project
 

Viewers also liked (20)

4th Technical Meeting - WP8
4th Technical Meeting - WP84th Technical Meeting - WP8
4th Technical Meeting - WP8
 
2nd Technical Meeting - WP4
2nd Technical Meeting - WP42nd Technical Meeting - WP4
2nd Technical Meeting - WP4
 
SLOPE 1st workshop - presentation 4
SLOPE 1st workshop - presentation 4SLOPE 1st workshop - presentation 4
SLOPE 1st workshop - presentation 4
 
SLOPE 1st workshop - presentation 6
SLOPE 1st workshop - presentation 6SLOPE 1st workshop - presentation 6
SLOPE 1st workshop - presentation 6
 
Mid-term Review Meeting - WP6
Mid-term Review Meeting - WP6Mid-term Review Meeting - WP6
Mid-term Review Meeting - WP6
 
Kick-Off Meeting - WP1
Kick-Off Meeting - WP1Kick-Off Meeting - WP1
Kick-Off Meeting - WP1
 
Kick-Off Meeting - WP8
Kick-Off Meeting - WP8Kick-Off Meeting - WP8
Kick-Off Meeting - WP8
 
Mid-term Review Meeting - WP3
Mid-term Review Meeting - WP3Mid-term Review Meeting - WP3
Mid-term Review Meeting - WP3
 
2nd Technical Meeting - WP6
2nd Technical Meeting - WP62nd Technical Meeting - WP6
2nd Technical Meeting - WP6
 
Slope general introduction
Slope general introductionSlope general introduction
Slope general introduction
 
SLOPE Final Conference - intelligent machines
SLOPE Final Conference - intelligent machinesSLOPE Final Conference - intelligent machines
SLOPE Final Conference - intelligent machines
 
SLOPE Final Conference - intelligent truck
SLOPE Final Conference - intelligent truckSLOPE Final Conference - intelligent truck
SLOPE Final Conference - intelligent truck
 
3rd Technical Meeting - WP2
3rd Technical Meeting - WP23rd Technical Meeting - WP2
3rd Technical Meeting - WP2
 
2nd Technical Meeting - WP8
2nd Technical Meeting - WP82nd Technical Meeting - WP8
2nd Technical Meeting - WP8
 
Kick-Off Meeting - WP5
Kick-Off Meeting - WP5Kick-Off Meeting - WP5
Kick-Off Meeting - WP5
 
Slope Final Review Meeting - WP2
Slope Final Review Meeting - WP2Slope Final Review Meeting - WP2
Slope Final Review Meeting - WP2
 
Slope Final Review Meeting - WP7
Slope Final Review Meeting - WP7Slope Final Review Meeting - WP7
Slope Final Review Meeting - WP7
 
SLOPE 2nd workshop - presentation 3
SLOPE 2nd workshop - presentation 3SLOPE 2nd workshop - presentation 3
SLOPE 2nd workshop - presentation 3
 
1st Technical Meeting - WP5
1st Technical Meeting - WP51st Technical Meeting - WP5
1st Technical Meeting - WP5
 
Slope Final Review Meeting - WP4
Slope Final Review Meeting - WP4Slope Final Review Meeting - WP4
Slope Final Review Meeting - WP4
 

Similar to SLOPE 1st workshop - presentation 7

Customer Churn Analytics using Microsoft R Open
Customer Churn Analytics using Microsoft R OpenCustomer Churn Analytics using Microsoft R Open
Customer Churn Analytics using Microsoft R OpenPoo Kuan Hoong
 
SYNOPSIS on Parse representation and Linear SVM.
SYNOPSIS on Parse representation and Linear SVM.SYNOPSIS on Parse representation and Linear SVM.
SYNOPSIS on Parse representation and Linear SVM.bhavinecindus
 
Machine learning algorithm for classification of activity of daily life’s
Machine learning algorithm for classification of activity of daily life’sMachine learning algorithm for classification of activity of daily life’s
Machine learning algorithm for classification of activity of daily life’sSiddharth Chakravarty
 
Multispectral imaging in Plant Sciences with VideometerLab 3
Multispectral imaging in Plant Sciences with VideometerLab 3Multispectral imaging in Plant Sciences with VideometerLab 3
Multispectral imaging in Plant Sciences with VideometerLab 3Adrian Waltho
 
Machine learning and linear regression programming
Machine learning and linear regression programmingMachine learning and linear regression programming
Machine learning and linear regression programmingSoumya Mukherjee
 
Talk@rmit 09112017
Talk@rmit 09112017Talk@rmit 09112017
Talk@rmit 09112017Shuai Zhang
 
Metabolomic Data Analysis Workshop and Tutorials (2014)
Metabolomic Data Analysis Workshop and Tutorials (2014)Metabolomic Data Analysis Workshop and Tutorials (2014)
Metabolomic Data Analysis Workshop and Tutorials (2014)Dmitry Grapov
 
Comparative Study of Machine Learning Algorithms for Sentiment Analysis with ...
Comparative Study of Machine Learning Algorithms for Sentiment Analysis with ...Comparative Study of Machine Learning Algorithms for Sentiment Analysis with ...
Comparative Study of Machine Learning Algorithms for Sentiment Analysis with ...Sagar Deogirkar
 
The Power of Auto ML and How Does it Work
The Power of Auto ML and How Does it WorkThe Power of Auto ML and How Does it Work
The Power of Auto ML and How Does it WorkIvo Andreev
 
IRJET - Tumor Identification from X-Ray Images using SVM Kernels
IRJET -  	  Tumor Identification from X-Ray Images using SVM KernelsIRJET -  	  Tumor Identification from X-Ray Images using SVM Kernels
IRJET - Tumor Identification from X-Ray Images using SVM KernelsIRJET Journal
 
Handwritten mathematical symbol recognition
Handwritten mathematical symbol recognitionHandwritten mathematical symbol recognition
Handwritten mathematical symbol recognitionMeghana Kantharaj
 
introduction to Statistical Theory.pptx
 introduction to Statistical Theory.pptx introduction to Statistical Theory.pptx
introduction to Statistical Theory.pptxDr.Shweta
 
Machine Learning Essentials Demystified part2 | Big Data Demystified
Machine Learning Essentials Demystified part2 | Big Data DemystifiedMachine Learning Essentials Demystified part2 | Big Data Demystified
Machine Learning Essentials Demystified part2 | Big Data DemystifiedOmid Vahdaty
 
Surface features with nonparametric machine learning
Surface features with nonparametric machine learningSurface features with nonparametric machine learning
Surface features with nonparametric machine learningSylvain Ferrandiz
 

Similar to SLOPE 1st workshop - presentation 7 (20)

Customer Churn Analytics using Microsoft R Open
Customer Churn Analytics using Microsoft R OpenCustomer Churn Analytics using Microsoft R Open
Customer Churn Analytics using Microsoft R Open
 
Rapid Miner
Rapid MinerRapid Miner
Rapid Miner
 
SYNOPSIS on Parse representation and Linear SVM.
SYNOPSIS on Parse representation and Linear SVM.SYNOPSIS on Parse representation and Linear SVM.
SYNOPSIS on Parse representation and Linear SVM.
 
Machine learning algorithm for classification of activity of daily life’s
Machine learning algorithm for classification of activity of daily life’sMachine learning algorithm for classification of activity of daily life’s
Machine learning algorithm for classification of activity of daily life’s
 
Seminar nov2017
Seminar nov2017Seminar nov2017
Seminar nov2017
 
Medical 3D data retrieval
Medical 3D data retrievalMedical 3D data retrieval
Medical 3D data retrieval
 
Multispectral imaging in Plant Sciences with VideometerLab 3
Multispectral imaging in Plant Sciences with VideometerLab 3Multispectral imaging in Plant Sciences with VideometerLab 3
Multispectral imaging in Plant Sciences with VideometerLab 3
 
Machine learning and linear regression programming
Machine learning and linear regression programmingMachine learning and linear regression programming
Machine learning and linear regression programming
 
Talk@rmit 09112017
Talk@rmit 09112017Talk@rmit 09112017
Talk@rmit 09112017
 
Metabolomic Data Analysis Workshop and Tutorials (2014)
Metabolomic Data Analysis Workshop and Tutorials (2014)Metabolomic Data Analysis Workshop and Tutorials (2014)
Metabolomic Data Analysis Workshop and Tutorials (2014)
 
Comparative Study of Machine Learning Algorithms for Sentiment Analysis with ...
Comparative Study of Machine Learning Algorithms for Sentiment Analysis with ...Comparative Study of Machine Learning Algorithms for Sentiment Analysis with ...
Comparative Study of Machine Learning Algorithms for Sentiment Analysis with ...
 
The Power of Auto ML and How Does it Work
The Power of Auto ML and How Does it WorkThe Power of Auto ML and How Does it Work
The Power of Auto ML and How Does it Work
 
Random Forest Decision Tree.pptx
Random Forest Decision Tree.pptxRandom Forest Decision Tree.pptx
Random Forest Decision Tree.pptx
 
INTERNSHIP
INTERNSHIPINTERNSHIP
INTERNSHIP
 
IRJET - Tumor Identification from X-Ray Images using SVM Kernels
IRJET -  	  Tumor Identification from X-Ray Images using SVM KernelsIRJET -  	  Tumor Identification from X-Ray Images using SVM Kernels
IRJET - Tumor Identification from X-Ray Images using SVM Kernels
 
Handwritten mathematical symbol recognition
Handwritten mathematical symbol recognitionHandwritten mathematical symbol recognition
Handwritten mathematical symbol recognition
 
introduction to Statistical Theory.pptx
 introduction to Statistical Theory.pptx introduction to Statistical Theory.pptx
introduction to Statistical Theory.pptx
 
CAD using SVM
CAD using SVMCAD using SVM
CAD using SVM
 
Machine Learning Essentials Demystified part2 | Big Data Demystified
Machine Learning Essentials Demystified part2 | Big Data DemystifiedMachine Learning Essentials Demystified part2 | Big Data Demystified
Machine Learning Essentials Demystified part2 | Big Data Demystified
 
Surface features with nonparametric machine learning
Surface features with nonparametric machine learningSurface features with nonparametric machine learning
Surface features with nonparametric machine learning
 

More from SLOPE Project

Slope Final Review Meeting - WP8
Slope Final Review Meeting - WP8Slope Final Review Meeting - WP8
Slope Final Review Meeting - WP8SLOPE Project
 
Slope Final Review Meeting - Introduction
Slope Final Review Meeting - Introduction Slope Final Review Meeting - Introduction
Slope Final Review Meeting - Introduction SLOPE Project
 
Slope Final Review Meeting - WP6
Slope Final Review Meeting - WP6Slope Final Review Meeting - WP6
Slope Final Review Meeting - WP6SLOPE Project
 
Slope Final Review Meeting - WP5
Slope Final Review Meeting - WP5Slope Final Review Meeting - WP5
Slope Final Review Meeting - WP5SLOPE Project
 
Slope Final Review Meeting - WP3
Slope Final Review Meeting - WP3Slope Final Review Meeting - WP3
Slope Final Review Meeting - WP3SLOPE Project
 
Slope Final Review Meeting - WP1
Slope Final Review Meeting - WP1 Slope Final Review Meeting - WP1
Slope Final Review Meeting - WP1 SLOPE Project
 
SLOPE 2nd workshop - presentation 4
SLOPE 2nd workshop - presentation 4SLOPE 2nd workshop - presentation 4
SLOPE 2nd workshop - presentation 4SLOPE Project
 
SLOPE Final Conference - innovative cable yarder
SLOPE Final Conference - innovative cable yarderSLOPE Final Conference - innovative cable yarder
SLOPE Final Conference - innovative cable yarderSLOPE Project
 
SLOPE Final Conference - sensors for timber grading in forest
SLOPE Final Conference - sensors for timber grading in forestSLOPE Final Conference - sensors for timber grading in forest
SLOPE Final Conference - sensors for timber grading in forestSLOPE Project
 
SLOPE Final Conference - remote sensing systems
SLOPE Final Conference - remote sensing systemsSLOPE Final Conference - remote sensing systems
SLOPE Final Conference - remote sensing systemsSLOPE Project
 
SLOPE 3rd workshop - presentation 3
SLOPE 3rd workshop - presentation 3SLOPE 3rd workshop - presentation 3
SLOPE 3rd workshop - presentation 3SLOPE Project
 
SLOPE 3rd workshop - presentation 4
SLOPE 3rd workshop - presentation 4SLOPE 3rd workshop - presentation 4
SLOPE 3rd workshop - presentation 4SLOPE Project
 
SLOPE 3rd workshop - presentation 1
SLOPE 3rd workshop - presentation 1SLOPE 3rd workshop - presentation 1
SLOPE 3rd workshop - presentation 1SLOPE Project
 
SLOPE 4th workshop - presentation 5
SLOPE 4th workshop - presentation 5SLOPE 4th workshop - presentation 5
SLOPE 4th workshop - presentation 5SLOPE Project
 
SLOPE 4th workshop - presentation 4
SLOPE 4th workshop - presentation 4SLOPE 4th workshop - presentation 4
SLOPE 4th workshop - presentation 4SLOPE Project
 
SLOPE 4th workshop - presentation 2
SLOPE 4th workshop - presentation 2SLOPE 4th workshop - presentation 2
SLOPE 4th workshop - presentation 2SLOPE Project
 
SLOPE 4th workshop - presentation 1
SLOPE 4th workshop - presentation 1SLOPE 4th workshop - presentation 1
SLOPE 4th workshop - presentation 1SLOPE Project
 
SLOPE 2nd workshop - presentation 2
SLOPE 2nd workshop - presentation 2SLOPE 2nd workshop - presentation 2
SLOPE 2nd workshop - presentation 2SLOPE Project
 
SLOPE 2nd workshop - presentation 1
SLOPE 2nd workshop - presentation 1SLOPE 2nd workshop - presentation 1
SLOPE 2nd workshop - presentation 1SLOPE Project
 
SLOPE 1st workshop - presentation 5
SLOPE 1st workshop - presentation 5SLOPE 1st workshop - presentation 5
SLOPE 1st workshop - presentation 5SLOPE Project
 

More from SLOPE Project (20)

Slope Final Review Meeting - WP8
Slope Final Review Meeting - WP8Slope Final Review Meeting - WP8
Slope Final Review Meeting - WP8
 
Slope Final Review Meeting - Introduction
Slope Final Review Meeting - Introduction Slope Final Review Meeting - Introduction
Slope Final Review Meeting - Introduction
 
Slope Final Review Meeting - WP6
Slope Final Review Meeting - WP6Slope Final Review Meeting - WP6
Slope Final Review Meeting - WP6
 
Slope Final Review Meeting - WP5
Slope Final Review Meeting - WP5Slope Final Review Meeting - WP5
Slope Final Review Meeting - WP5
 
Slope Final Review Meeting - WP3
Slope Final Review Meeting - WP3Slope Final Review Meeting - WP3
Slope Final Review Meeting - WP3
 
Slope Final Review Meeting - WP1
Slope Final Review Meeting - WP1 Slope Final Review Meeting - WP1
Slope Final Review Meeting - WP1
 
SLOPE 2nd workshop - presentation 4
SLOPE 2nd workshop - presentation 4SLOPE 2nd workshop - presentation 4
SLOPE 2nd workshop - presentation 4
 
SLOPE Final Conference - innovative cable yarder
SLOPE Final Conference - innovative cable yarderSLOPE Final Conference - innovative cable yarder
SLOPE Final Conference - innovative cable yarder
 
SLOPE Final Conference - sensors for timber grading in forest
SLOPE Final Conference - sensors for timber grading in forestSLOPE Final Conference - sensors for timber grading in forest
SLOPE Final Conference - sensors for timber grading in forest
 
SLOPE Final Conference - remote sensing systems
SLOPE Final Conference - remote sensing systemsSLOPE Final Conference - remote sensing systems
SLOPE Final Conference - remote sensing systems
 
SLOPE 3rd workshop - presentation 3
SLOPE 3rd workshop - presentation 3SLOPE 3rd workshop - presentation 3
SLOPE 3rd workshop - presentation 3
 
SLOPE 3rd workshop - presentation 4
SLOPE 3rd workshop - presentation 4SLOPE 3rd workshop - presentation 4
SLOPE 3rd workshop - presentation 4
 
SLOPE 3rd workshop - presentation 1
SLOPE 3rd workshop - presentation 1SLOPE 3rd workshop - presentation 1
SLOPE 3rd workshop - presentation 1
 
SLOPE 4th workshop - presentation 5
SLOPE 4th workshop - presentation 5SLOPE 4th workshop - presentation 5
SLOPE 4th workshop - presentation 5
 
SLOPE 4th workshop - presentation 4
SLOPE 4th workshop - presentation 4SLOPE 4th workshop - presentation 4
SLOPE 4th workshop - presentation 4
 
SLOPE 4th workshop - presentation 2
SLOPE 4th workshop - presentation 2SLOPE 4th workshop - presentation 2
SLOPE 4th workshop - presentation 2
 
SLOPE 4th workshop - presentation 1
SLOPE 4th workshop - presentation 1SLOPE 4th workshop - presentation 1
SLOPE 4th workshop - presentation 1
 
SLOPE 2nd workshop - presentation 2
SLOPE 2nd workshop - presentation 2SLOPE 2nd workshop - presentation 2
SLOPE 2nd workshop - presentation 2
 
SLOPE 2nd workshop - presentation 1
SLOPE 2nd workshop - presentation 1SLOPE 2nd workshop - presentation 1
SLOPE 2nd workshop - presentation 1
 
SLOPE 1st workshop - presentation 5
SLOPE 1st workshop - presentation 5SLOPE 1st workshop - presentation 5
SLOPE 1st workshop - presentation 5
 

Recently uploaded

EPANDING THE CONTENT OF AN OUTLINE using notes.pptx
EPANDING THE CONTENT OF AN OUTLINE using notes.pptxEPANDING THE CONTENT OF AN OUTLINE using notes.pptx
EPANDING THE CONTENT OF AN OUTLINE using notes.pptxRaymartEstabillo3
 
HỌC TỐT TIẾNG ANH 11 THEO CHƯƠNG TRÌNH GLOBAL SUCCESS ĐÁP ÁN CHI TIẾT - CẢ NĂ...
HỌC TỐT TIẾNG ANH 11 THEO CHƯƠNG TRÌNH GLOBAL SUCCESS ĐÁP ÁN CHI TIẾT - CẢ NĂ...HỌC TỐT TIẾNG ANH 11 THEO CHƯƠNG TRÌNH GLOBAL SUCCESS ĐÁP ÁN CHI TIẾT - CẢ NĂ...
HỌC TỐT TIẾNG ANH 11 THEO CHƯƠNG TRÌNH GLOBAL SUCCESS ĐÁP ÁN CHI TIẾT - CẢ NĂ...Nguyen Thanh Tu Collection
 
Employee wellbeing at the workplace.pptx
Employee wellbeing at the workplace.pptxEmployee wellbeing at the workplace.pptx
Employee wellbeing at the workplace.pptxNirmalaLoungPoorunde1
 
Computed Fields and api Depends in the Odoo 17
Computed Fields and api Depends in the Odoo 17Computed Fields and api Depends in the Odoo 17
Computed Fields and api Depends in the Odoo 17Celine George
 
Keynote by Prof. Wurzer at Nordex about IP-design
Keynote by Prof. Wurzer at Nordex about IP-designKeynote by Prof. Wurzer at Nordex about IP-design
Keynote by Prof. Wurzer at Nordex about IP-designMIPLM
 
AmericanHighSchoolsprezentacijaoskolama.
AmericanHighSchoolsprezentacijaoskolama.AmericanHighSchoolsprezentacijaoskolama.
AmericanHighSchoolsprezentacijaoskolama.arsicmarija21
 
Introduction to AI in Higher Education_draft.pptx
Introduction to AI in Higher Education_draft.pptxIntroduction to AI in Higher Education_draft.pptx
Introduction to AI in Higher Education_draft.pptxpboyjonauth
 
AMERICAN LANGUAGE HUB_Level2_Student'sBook_Answerkey.pdf
AMERICAN LANGUAGE HUB_Level2_Student'sBook_Answerkey.pdfAMERICAN LANGUAGE HUB_Level2_Student'sBook_Answerkey.pdf
AMERICAN LANGUAGE HUB_Level2_Student'sBook_Answerkey.pdfphamnguyenenglishnb
 
Solving Puzzles Benefits Everyone (English).pptx
Solving Puzzles Benefits Everyone (English).pptxSolving Puzzles Benefits Everyone (English).pptx
Solving Puzzles Benefits Everyone (English).pptxOH TEIK BIN
 
DATA STRUCTURE AND ALGORITHM for beginners
DATA STRUCTURE AND ALGORITHM for beginnersDATA STRUCTURE AND ALGORITHM for beginners
DATA STRUCTURE AND ALGORITHM for beginnersSabitha Banu
 
Earth Day Presentation wow hello nice great
Earth Day Presentation wow hello nice greatEarth Day Presentation wow hello nice great
Earth Day Presentation wow hello nice greatYousafMalik24
 
Proudly South Africa powerpoint Thorisha.pptx
Proudly South Africa powerpoint Thorisha.pptxProudly South Africa powerpoint Thorisha.pptx
Proudly South Africa powerpoint Thorisha.pptxthorishapillay1
 
How to do quick user assign in kanban in Odoo 17 ERP
How to do quick user assign in kanban in Odoo 17 ERPHow to do quick user assign in kanban in Odoo 17 ERP
How to do quick user assign in kanban in Odoo 17 ERPCeline George
 
Alper Gobel In Media Res Media Component
Alper Gobel In Media Res Media ComponentAlper Gobel In Media Res Media Component
Alper Gobel In Media Res Media ComponentInMediaRes1
 
ROOT CAUSE ANALYSIS PowerPoint Presentation
ROOT CAUSE ANALYSIS PowerPoint PresentationROOT CAUSE ANALYSIS PowerPoint Presentation
ROOT CAUSE ANALYSIS PowerPoint PresentationAadityaSharma884161
 
Judging the Relevance and worth of ideas part 2.pptx
Judging the Relevance  and worth of ideas part 2.pptxJudging the Relevance  and worth of ideas part 2.pptx
Judging the Relevance and worth of ideas part 2.pptxSherlyMaeNeri
 
ENGLISH6-Q4-W3.pptxqurter our high choom
ENGLISH6-Q4-W3.pptxqurter our high choomENGLISH6-Q4-W3.pptxqurter our high choom
ENGLISH6-Q4-W3.pptxqurter our high choomnelietumpap1
 

Recently uploaded (20)

EPANDING THE CONTENT OF AN OUTLINE using notes.pptx
EPANDING THE CONTENT OF AN OUTLINE using notes.pptxEPANDING THE CONTENT OF AN OUTLINE using notes.pptx
EPANDING THE CONTENT OF AN OUTLINE using notes.pptx
 
HỌC TỐT TIẾNG ANH 11 THEO CHƯƠNG TRÌNH GLOBAL SUCCESS ĐÁP ÁN CHI TIẾT - CẢ NĂ...
HỌC TỐT TIẾNG ANH 11 THEO CHƯƠNG TRÌNH GLOBAL SUCCESS ĐÁP ÁN CHI TIẾT - CẢ NĂ...HỌC TỐT TIẾNG ANH 11 THEO CHƯƠNG TRÌNH GLOBAL SUCCESS ĐÁP ÁN CHI TIẾT - CẢ NĂ...
HỌC TỐT TIẾNG ANH 11 THEO CHƯƠNG TRÌNH GLOBAL SUCCESS ĐÁP ÁN CHI TIẾT - CẢ NĂ...
 
Employee wellbeing at the workplace.pptx
Employee wellbeing at the workplace.pptxEmployee wellbeing at the workplace.pptx
Employee wellbeing at the workplace.pptx
 
TataKelola dan KamSiber Kecerdasan Buatan v022.pdf
TataKelola dan KamSiber Kecerdasan Buatan v022.pdfTataKelola dan KamSiber Kecerdasan Buatan v022.pdf
TataKelola dan KamSiber Kecerdasan Buatan v022.pdf
 
Computed Fields and api Depends in the Odoo 17
Computed Fields and api Depends in the Odoo 17Computed Fields and api Depends in the Odoo 17
Computed Fields and api Depends in the Odoo 17
 
Keynote by Prof. Wurzer at Nordex about IP-design
Keynote by Prof. Wurzer at Nordex about IP-designKeynote by Prof. Wurzer at Nordex about IP-design
Keynote by Prof. Wurzer at Nordex about IP-design
 
AmericanHighSchoolsprezentacijaoskolama.
AmericanHighSchoolsprezentacijaoskolama.AmericanHighSchoolsprezentacijaoskolama.
AmericanHighSchoolsprezentacijaoskolama.
 
Introduction to AI in Higher Education_draft.pptx
Introduction to AI in Higher Education_draft.pptxIntroduction to AI in Higher Education_draft.pptx
Introduction to AI in Higher Education_draft.pptx
 
AMERICAN LANGUAGE HUB_Level2_Student'sBook_Answerkey.pdf
AMERICAN LANGUAGE HUB_Level2_Student'sBook_Answerkey.pdfAMERICAN LANGUAGE HUB_Level2_Student'sBook_Answerkey.pdf
AMERICAN LANGUAGE HUB_Level2_Student'sBook_Answerkey.pdf
 
Model Call Girl in Tilak Nagar Delhi reach out to us at 🔝9953056974🔝
Model Call Girl in Tilak Nagar Delhi reach out to us at 🔝9953056974🔝Model Call Girl in Tilak Nagar Delhi reach out to us at 🔝9953056974🔝
Model Call Girl in Tilak Nagar Delhi reach out to us at 🔝9953056974🔝
 
Raw materials used in Herbal Cosmetics.pptx
Raw materials used in Herbal Cosmetics.pptxRaw materials used in Herbal Cosmetics.pptx
Raw materials used in Herbal Cosmetics.pptx
 
Solving Puzzles Benefits Everyone (English).pptx
Solving Puzzles Benefits Everyone (English).pptxSolving Puzzles Benefits Everyone (English).pptx
Solving Puzzles Benefits Everyone (English).pptx
 
DATA STRUCTURE AND ALGORITHM for beginners
DATA STRUCTURE AND ALGORITHM for beginnersDATA STRUCTURE AND ALGORITHM for beginners
DATA STRUCTURE AND ALGORITHM for beginners
 
Earth Day Presentation wow hello nice great
Earth Day Presentation wow hello nice greatEarth Day Presentation wow hello nice great
Earth Day Presentation wow hello nice great
 
Proudly South Africa powerpoint Thorisha.pptx
Proudly South Africa powerpoint Thorisha.pptxProudly South Africa powerpoint Thorisha.pptx
Proudly South Africa powerpoint Thorisha.pptx
 
How to do quick user assign in kanban in Odoo 17 ERP
How to do quick user assign in kanban in Odoo 17 ERPHow to do quick user assign in kanban in Odoo 17 ERP
How to do quick user assign in kanban in Odoo 17 ERP
 
Alper Gobel In Media Res Media Component
Alper Gobel In Media Res Media ComponentAlper Gobel In Media Res Media Component
Alper Gobel In Media Res Media Component
 
ROOT CAUSE ANALYSIS PowerPoint Presentation
ROOT CAUSE ANALYSIS PowerPoint PresentationROOT CAUSE ANALYSIS PowerPoint Presentation
ROOT CAUSE ANALYSIS PowerPoint Presentation
 
Judging the Relevance and worth of ideas part 2.pptx
Judging the Relevance  and worth of ideas part 2.pptxJudging the Relevance  and worth of ideas part 2.pptx
Judging the Relevance and worth of ideas part 2.pptx
 
ENGLISH6-Q4-W3.pptxqurter our high choom
ENGLISH6-Q4-W3.pptxqurter our high choomENGLISH6-Q4-W3.pptxqurter our high choom
ENGLISH6-Q4-W3.pptxqurter our high choom
 

SLOPE 1st workshop - presentation 7

  • 1. Introduction to Multivariate Image Analysis (MIA) ©Copyright 1996-2013 Eigenvector Research, Inc. No part of this material may be photocopied or reproduced in any form without prior written consent from Eigenvector Research, Inc. Table of Contents • Intro to 3-way arrays and simple visualizations and size/shape analyses • Practical Multivariate Image Analysis (MIA) • Principal Component Analysis (PCA) • SIMCA • Multivariate Curve Resolution (MCR) • Partial Least Squares Discriminant Analysis (PLSDA) 2
  • 2. Eigenvector University Our week long series of courses each spring • May 10-15, 2015 Seattle, Washington, USA • 6 full days and 3 evenings • 15 hands-on courses • 8 instructors (Eigenvector staff + Rasmus Bro) • User poster session and group meeting EigenU Europe • Oct 5-8, 2015 Hillerød, DENMARK • 4 full days • 7 hands-on courses Training We offer standard and custom courses on a range of chemometric and application topics: Chemometrics Without Equations Series Chemometrics Without Equations Advanced Chemometrics Without Equations Basic Chemometrics Series Linear Algebra for Chemometricians MATLAB for Chemometricians Chemometrics I -- PCA Chemometrics II -- Regression and PLS Clustering and Classification Advanced and Specialty Topics Advanced Preprocessing Applied Multiway Analysis Multivariate Statistical Process Control for PAT Calibration Model Maintenance Calibration Transfer and Instrument Standardization Chemometrics in Mass Spectrometry Chemometrics in Metabolomics Classical Least Squares (CLS) Methods Common Mistakes in Chemometrics Correlation Spectroscopy Design of Experiments for QbD Getting PLS_Toolbox/Solo Models Online Hierarchical and Optimized Models Implementing Chemometrics in PAT Introduction to Multivariate Image Analysis Modeling Fluorescence EEM Data MSPC-Multivariate Statistical Process Control Multi-block, Multi-set, and Data Fusion Methods Multivariate Curve Resolution Non-linear Methods for Calibration and Classification PLS_Toolbox Beyond the Interfaces Robust Methods Variable Selection Bring Your Own Data (BYOD) And we're always adding more…
  • 3. Resources • Hyperspectral Image Analysis, eds. P. Geladi and H. Grahn, Wiley (2007), ISBN 978-0-470-01086-0 • Chemometrics, M.A. Sharaf, D.L. Illman and B.R. Kowalski, Wiley-Interscience (1986) ISBN 0-471-83106-9 • Multivariate Analysis, K.V. Mardia, J.I. Kent and J.M. Bibby, Academic Press, (1979) ISBN 0-12-471252-2 • Multivariate Calibration, H. Martens and T. Næs, John Wiley & Sons Ltd. (1989) ISBN 0-471-90979-3 • Chemometrics: a textbook, D.L. Massart et al., Elsevier (1988) ISBN 0-444-42660-4 • Chemometrics: A Practical Guide, K.R. Beebe, R.J. Pell, M.B. Seasholtz, Wiley (1998) ISBN 0-471-12451-6 • Multivariate Data Analysis In Practice, Kim H. Esbensen, CAMO ASA (2000), ISBN 82-993330-2-4 • A user-friendly guide to Multivariate Calibration and Classification, T. Næs, T. Isaksson, T. Fearn, T. Davies, NIR Publications(2002), ISBN 0-9528666-2-5 • Journal of Chemometrics • IEEE Trans. on Geosci. and Remote Sensing • Chemometrics and Intelligent Laboratory Systems • Analytical Chemistry • Analytica Chemica Acta • Applied Spectroscopy • Critical Reviews in Analytical Chemistry • Journal of Process Control • Computers in Chemical Engineering • Technometrics • .... 5 Univariate Image • Grey scale • each pixel is an number defining an intensity level e.g., • integer (0 to 255) unsigned 8-bit • integer (0 to 4095) • double (floating point) 100 200 300 100 200 300 400 500 600 y-pixels x-pixels MxxMy pixels provides spatial information 6
  • 4. 100 200 300 100 200 300 400 500 600 Multivariate Image (3 Variables) • Red/Green/Blue (RGB) (e.g. JPEG) • each layer defines color intensity level • much more information-rich 7 Image Analysis • Many methods have been developed to examine the spatial structure w/in an image • the methods recognize spatial patterns within an image • based on the light / dark contrast and continuity of regions • edge detection, image sharpening, wavelets • particle size distributions, machine vision, medical applications, security, … • MIA has been traditionally applied to the spectral dimension first followed by spatial analysis • some methods that examine both are appearing 8
  • 5. Multivariate Image (4-10 Variables) • Measure at several wavelengths (e.g., Landstat) blue green red NIR SWIR-1 SWIR-2 thermal How should we display a seven variable image? 9 Multivariate Image (4-10 Variables) • Choose 3 of 7 (Landstat) Montana (blue/SWIR-1/thermal) 100 200 300 400 500 50 100 150 200 250 300 350 400 450 500 100 200 300 400 500 50 100 150 200 250 300 350 400 450 500 Paris (NIR/blue/SWIR-1)* *contrast enhanced 10
  • 6. Hyperspectral Image (>10 Variables) • Spectrum at each pixel • could be 100-1000s of variables • often floating point double 10-100s Mbytes y ν x 800 900 1000 1100 1200 1300 1400 1500 1600 0 0.5 1 1.5 Wavelength (nm) Absorbance each pixel is a spectrum each voxel is a channel in the spectrumPixels Spatial Information Spectral Chemical Information 11 File Formats Inherent Image Formats • Cameca Ion-Tof BIF/BIF6 Image (BIF,BIF6) • ENVI Image Format (HDR) • Lispix Raw Formatted Image (RAW) • Multi-layer TIFF files (TIFF) • Physical Electronics RAW Image (RAW) • Image standard (JPG, TIFF, GIF, BMP, PNG) Non-Image Formats (add image context after load) • Text (e.g. CSV) • Thermo-Galactic SPC (binary) 12
  • 7. Memory Considerations • 512 x 512 pixels and 2048 variables = 536 Million data points = 4.3 GB memory (double precision) BEFORE preprocessing! • Larger images require 64-bit computers with 4GB or more of memory 13 Multivariate Images • Data array of dimension three (or more) • where the first two dimensions are spatial and • the last dimension(s) is a function of another variable (e.g, spectroscopy). • Chemical system(s) of interest include • microscopic, medical, machine vision, process monitoring crystallization, stand-off and remote sensing, … • vapors, liquids, solids (or combination) • visible, infra-red, Raman, mass spectroscopy, … 14
  • 8. Displaying a Multivariate Image (4-10 Variables) • How to choose the 3 variables? • In which order should they be displayed? • Doesn’t choosing ignore potential information in the remaining variables? • How could information be extract from the image? • What happens when we go to more variables? ... • …. Factor-based techniques • use the correlation structure to enhance S/N • really good for hyperspectral 15 Matlab-Based Stand-Alone PLS_Toolbox SoloModeling & Analysis: MIA_Toolbox Solo+MIAImage Analysis: Model_Exporter Solo+Model_ExporterModel Export: Solo_PredictorModel Application: Matlab-Based products provide access to all Graphical User Interfaces (GUIs) plus command-line scripting and programming functionality Stand-Alone products provide access to same GUIs plus basic script operations without needing Matlab EVRI Product Outline
  • 9. Matlab-Based Stand-Alone PLS_Toolbox SoloModeling & Analysis: MIA_Toolbox Solo+MIAImage Analysis: Model_Exporter Solo+Model_ExporterModel Export: Solo_PredictorModel Application: Exporting of models is for use in high-frequency or low-resource applications such as hand-held instruments Solo_Predictor supports all model types, preprocessing, calibration transfer, and many other PLS_Toolbox/Solo features EVRI Product Outline Map of Eigenvector Software 18 Workspace Browser (Starting Point) Trend Tool (Visualization) Plot Controls & DataSet Editor Image Manager Analysis (Modeling) PLS_Toolbox and MIA_Toolbox (in Matlab) Solo+MIA (Stand-alone) Particle Analysis Texture Analysis
  • 10. Simple Image Analysis Tools • TrendTool – Univariate Data Investigation • Analyze multivariate data using simple univariate measurements • Image Manager – Data Manipulation and Analysis • Concatenating / Manipulating (e.g. rotation) Images • Preprocessing 19 TrendTool • Display results of univariate calculations on multivariate data • Signal at given variable • Integrated signal across range of variables • Peak position • Peak width • With or without baselines • Ratio of measurements 20
  • 11. Opening TrendTool Image Manager Toolbar Plot Controls WindowWorkspace Browser 21 TrendTool Windows: Data View Use Data View to: • Set analysis markers • Choose analysis mode • Select references and baseline points Hints: • Right-click white space to set marker or use toolbar button • Drag markers to move • Right-click markers to change types • Use toolbar to save or load marker sets 22
  • 12. TrendTool Windows: Trend View Results displayed in Trend View • Single marker displays with false-color • Multiple markers display in RGB Toolbar Buttons: • autoscale image • select pixels to display in Data View • save or spawn plot of results (respectively) 23 TrendTool Analysis Modes • Height – gives response at position (single marker) • Area – gives integrated response between markers • Position – gives position of peak response between markers • Width – gives full width at half height between markers "Add Reference" to subtract a single point baseline. Convert reference to baseline (via right-click) to do two-point linear baseline. "Normalize to Region" to normalize all regions to the response of the selected region. 24
  • 13. Opening Image Manager Plot Toolbar Plot Controls WindowWorkspace Browser 25 Currently Loaded Images List Load / Import Images Controls Image Manager & Tools Settings Image Manager Overview 26
  • 14. Image Groups Grouping allows you to: • Combine images into a single DataSet for analysis • Apply a univariate operation (rotate, crop, etc) to all images Example: combining three slabs of RGB image Image Group Controls 27 Image Groups click to view 28
  • 15. With all 3 images loaded and grouped Concatenating Images 29 Concatenating Images: Spatial Domain (768 x 1536) x 1 X, Y, Z, or tile… 30
  • 16. Concatenating Images: Variable Domain (768 x 512) x 3 31 Group Manipulation Example: Rotation Hint: to apply an action to only ONE image, click the "Apply Changes to Image Group" button until only one thumbnail is outlined in the image group pane. 32
  • 17. Image-Oriented Preprocessing • Image-specific preprocessing operates in pixel-space and are either Intensity or Binary based • Intensity-Based Image Correction: • Background Subtraction (Flatfield): Rolling-ball background subtraction for images. • Min: Min value over neighboring pixels. (filter out high-value pixels) • Max: Max value over neighboring pixels. (filter out low-value pixels) • Mean: Mean value over neighboring pixels. (filter out low/high pixels) • Median: Median value over neighboring pixels. (robust filter of low/high pixels) • Trimmed Mean: Trimmed mean value over neighboring pixels. • Trimmed Median: Trimmed median value over neighboring pixels. • Smooth: Spatial smoothing for images. (a weighted mean) 33 Image-Oriented Preprocessing • Binary-Based Image Correction • Dilate: Perform dilation on a binary image. • Erode: Perform erosion on a binary image. • Close (Dilate+Erode): Perform dilation followed by erosion on a binary image. • Open (Erode+Dilate): Perform erosion followed by dilation on a binary image. • NOTE: Image-Oriented methods may break covariance (add multivariate rank) because variable slabs handled separately • Standard variable-space preprocessing can be used too, but are spatially insensitive 34
  • 18. MIA: PCA-Based Methods • Many methods are based on the spectroscopic information in an image • although spatial information is ignored mathematically • images are examined for spatial structure • PCA (Principal Components Analysis) • Exploratory analysis • SIMCA (Soft Independent Method Class Analogy) • Classification 35 Image PCA • Matricizing • PCA: scores, scores images, loadings • unusual samples Q and T2 • score-score plots, density plots • linking scores and image plane(s) • contrast enhancement 36
  • 19. Matricizing (a.k.a. Unfolding) • PCA works on X (MxN) but the image is MxxMyxN • reshape by matricizing such that each pixel is a row in a new MxMyxN matrix … … Original Image MxxMyxN Matricized Image MxMyxN y … … … ν x ν 37 PCA Math Summary • For a data matrix X with M samples and N variables (generally assumed to be mean centered and properly scaled), the PCA decomposition is Where R ≤ min{M,N}, and the tkpk T pairs are ordered by the amount of variance captured. • Generally, the model is truncated to K PCs, leaving some small amount of variance in a residual matrix E: • where T is MxK and P is NxK. 1 1 2 2 T T T T K K= + + + + = +X t p t p t p E TP EK 1 1 2 2 T T T T K K R R= + + + + +X t p t p t p t pK K 38
  • 20. Properties of PCA • tk,pk ordered by amount of variance captured • λk are the eigenvalues of XTX → XTXpk = λkpk • λk are ∝ variance captured • tk (scores) form an orthogonal set TK (MxK) • describe relationship between samples → pixels (M = MxMy) • pk (loadings) form an orthonormal set PK (NxK) • describe relationship between variables = t1 p1 T + t2 p2 T +..+ tK pK T +X E 39 0 2 4 6 0 2 4 6 0 2 4 6 8 PC 1 Variable3 Mean Vector PC 2 PCA Graphically 40
  • 21. Reshape Scores To Images • PCA gives scores T (MxK) which is reshaped to scores images (MxxMyxK) • each score vector is a MxxMy scores image … … Original Scores MxMyxK Scores Images MxxMyxK y … … … x k 41 • scores and loadings plots are interpreted in pairs • plot tk vs sample number • find relationship between samples → pixels • each MxMyx1 score vector is reshaped to a MxxMy matrix that can be visualized as a "scores image" showing spatial relationships between pixels • pk vs variable number • relationship between variables responsible for observations in samples • it is useful to plot tk+1 vs. tk and pk+1 vs. pk • examine image and score / score plots Plots / Images for PCA 42
  • 22. Image PCA Conclusions • Image PCA is a useful unsupervised pattern recognition technique for exploring images • scores and loadings are useful for determining what original variables are responsible for differences observed in an image • score-score plots and linked score plots • contrast enhancement might be needed to see small changes • Image SIMCA is a useful supervised pattern recognition technique • find similar / dissimilar portions of an image very quickly 43 MCR • Based on the classical least squares (CLS) model, attempt to estimate C and S given X: X = CST + E where X is a MxN matrix of measured responses, C is a MxK matrix of pure analyte contributions, S is a NxK matrix of pure analyte spectra, and E is a MxN matrix of residuals. 44
  • 23. MCR Objective • Decompose a data matrix into chemically meaningful factors • pure analyte spectra • pure analyte concentrations • Easy to interpret • provides chemically / physically meaningful information • caveats: • rotational and multiplicative ambiguity • use of constraints 45 46 Linear Discriminant Analysis • LDA seeks axis (in n-D space) which maximizes ratio of between class to within class variance X2 Projection onto axis X1 X2 an axis e.g., PC1 LDA
  • 24. 47 Partial Least Squares Discriminate Analysis (PLS-DA) • Exactly as with Linear Discriminant Analysis (LDA), the objective is to determine an axis to project data on that discriminates between classes • choose axis so individual distributions are narrow • choose axis so centers of distributions are far apart • Determine axes from factor-based model of data therefore more stable with high collinearity. • Automatically attempts to identify directions of interest! 48 • Use logicals (0,1) in Y-block to indicate if sample belongs to a class or not dummy variables • Develop PLS model to predict class block • Thresholds must be set between 0 and 1 to indicate if new samples are a member of each class... Can use Bayes theorem to set threshold and include prior probability of each class Partial Least Squares Discriminate Analysis (PLS-DA) Regression Vector Threshold
  • 25. Image PLSDA and SIMCA Conclusions • If classes (regions) are known, PLSDA is a useful supervised pattern recognition technique for exploring images • can often bring out more contrast than PCA • If only examples of one class are known, then SIMCA (i.e. PCA models) should be used 49 Comments on Presenting Images • Images are representations of spatial and chemical information, … • but they can be mis-used. • users can control colors and contrasting and select channels or PCs (or rotations thereof) • as a result some things can be highlighted while others can be hidden • It is important to report how images were constructed • the work must be reproducible 50