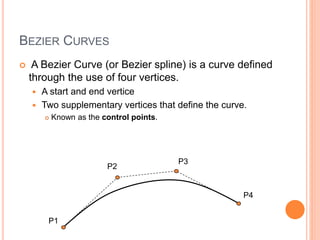
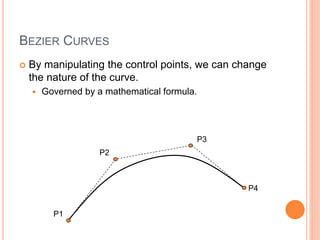
3D Display Methods:
In this section, we focus on a subgoals of realistic picture. This co-ordinate reference defines the position and orientation for the planeof the camera, as shown in next slide.This plane must be used to display a view of the object; its description has to transferred to thecamera reference co-ordinates and projected onto the selected display plane. Then we can displayobject in wire frame form or we can apply lighting and surface rendering techniques to shade thevisible surfaces
All the information regarding 3D viewing is here. The whole presentation consists mainly of 3D viewing pipeline. This slide will make you clear about how one can have a 3d viewing of an object.
it is a Visible surface detection method is also known as depth buffer method. In this method detect the visible surface by using the distance of the object from the projections plane.
http://goo.gl/lZ2R4v Drawing with linear perspective is a technique that portrays objects as
having visual depth.
Linear perspective involves parallel lines converging at a point on an
horizon line, called the vanishing point.
These parallel lines are used to gauge the size of objects. The nearer you
get to the vanishing point, the smaller your objects become, and the
further away from the vanishing point, the larger your objects become.
Using this example code in Xcode, please help with this project wher.pdfamirthagiftsmadurai
Using this example code in Xcode, please help with this project where you need to build a simple
but intuitive tool to draw curves on an image, for a painting tool, which is a core function of
many graphics/image designing tools, such as Coreldraw, Photoshop. You are required to draw
curves by using the Bezier Spline rule. Your software allows users to draw as many splines as
needed. Every spline is created by four points via left mouse click. The 1st and 4th points are the
fixed points that the curve passes through. The 2nd and 3rd points are considered as the
controlling points that determine the tangent direction at point 1 and 4. So your mouse can drag
these two points to different positions to modify the shape of the curve. There are 7 requirements
for this project:
1.) Correct Bezier spline drawing
Draw the curve based on users 4 points input.
Use Bezier matrix to multiple the 4 points to obtain the correct coefficients (ax,
bx, cx, dx; ay, by, cy, dy).
Correctly plot the curves based on the coefficients.
As long as one Bezier spline is drawn correctly, you will get the credits.
(2) Bezier controlling point editing to change the shape (20%)
User can drag the controlling points freely to change the point position.
The two corresponding straight lines change dynamically according to the new
positions of the controlling points.
The curve splines shape changes dynamically according to the new positions of
the controlling points.
Again, as long as you can have the controlling points of one Bezier spline work,
you will get the credits.
(3) Multiple spline drawing
Your code allows user to draw as many splines as needed and able to edit any of them.
User can also right-click mouse button to remove spline point and thus remove the corresponding
spline.
(4) Correct spline highlight
Draw a little square around the center of each spline in grey color, e.g. (200, 200, 200). You can
make this square size 30x30 pixels
When the mouse moves into the spline editing region, this region should turn to green (0, 200,
0).
When the mouse moves out of the region, the square should turn back to grey.
(5) Translation operation
Successfully move the spline to any position by mouse dragging
(6) Coloring operation
Successfully change the spline to any color when a spline is highlighted
(7) Thickness operation
Successfully adjust the spline with any thickness
I attached the sample code that these 7 requirements should be added onto. Please help asap!
Thanks!.
Here in this presentation we will be dealing with Nurbs and the major difference between polygons and nurbs, modelling, technical specifications, basic control points, general equations of nurbs and nurb surfaces, nurb manpulating, knob removal
Chapter summary and solutions to end-of-chapter exercises for "Data Visualization: Principles and Practice" book by Alexandru C. Telea
In this chapter author discusses a number of popular visualization methods for vector datasets: vector glyphs, vector color-coding, displacement plots, stream objects, texture-based vector visualization, and the simplified representation of vector fields.
Section 6.5 presents stream objects, which use integral techniques to construct paths in vector fields. Section 6.7 discusses a number of strategies for simplified representation of vector datasets. Section 6.8 presents a number of illustrative visualization techniques for vector fields, which offer an alternative mechanism for simplified representation to the techniques discussed in Section 6.7 Chapter presents also feature detection methods, algorithm for computing separatrices on field’s topology, and top-down and bottom-up field decomposition methods.
Here in this presentation we will be getting to know about Implicit Interpolation Analytical Curves related to Manufacturing and Designing, Design criteria, we'll be going through interpolating Curves and Equations, interpolating Matrices and Blending Functions
Meeple centred design - Board Game AccessibilityMichael Heron
Delivered at the UK Games Expo on Friday 1st of June, 2018 . In this seminar, Dr Michael Heron and Pauline Belford of Meeple Like Us discuss the topic of board game accessibility and why support for people with disabilities within the tabletop gaming community is important - not just for its own sake, but for all of us.
Pages referenced here:
Meeple Like Us: http://meeplelikeus.co.uk
The Game Accessibility Guidelines: http://gameaccessibilityguidelines.com/
Eighteen Months of Meeple Like Us:
http://meeplelikeus.co.uk/eighteen-months-of-meeple-like-us-an-exploration-into-the-state-of-board-game-accessibility/
Meeple Centred Design: http://meeplelikeus.co.uk/meeple-centred-design-a-heuristic-toolkit-for-evaluating-the-accessibility-of-tabletop-games/
This is an intermediate conversion course for C++, suitable for second year computing students who may have learned Java or another language in first year.
UiPath Test Automation using UiPath Test Suite series, part 3DianaGray10
Welcome to UiPath Test Automation using UiPath Test Suite series part 3. In this session, we will cover desktop automation along with UI automation.
Topics covered:
UI automation Introduction,
UI automation Sample
Desktop automation flow
Pradeep Chinnala, Senior Consultant Automation Developer @WonderBotz and UiPath MVP
Deepak Rai, Automation Practice Lead, Boundaryless Group and UiPath MVP
State of ICS and IoT Cyber Threat Landscape Report 2024 previewPrayukth K V
The IoT and OT threat landscape report has been prepared by the Threat Research Team at Sectrio using data from Sectrio, cyber threat intelligence farming facilities spread across over 85 cities around the world. In addition, Sectrio also runs AI-based advanced threat and payload engagement facilities that serve as sinks to attract and engage sophisticated threat actors, and newer malware including new variants and latent threats that are at an earlier stage of development.
The latest edition of the OT/ICS and IoT security Threat Landscape Report 2024 also covers:
State of global ICS asset and network exposure
Sectoral targets and attacks as well as the cost of ransom
Global APT activity, AI usage, actor and tactic profiles, and implications
Rise in volumes of AI-powered cyberattacks
Major cyber events in 2024
Malware and malicious payload trends
Cyberattack types and targets
Vulnerability exploit attempts on CVEs
Attacks on counties – USA
Expansion of bot farms – how, where, and why
In-depth analysis of the cyber threat landscape across North America, South America, Europe, APAC, and the Middle East
Why are attacks on smart factories rising?
Cyber risk predictions
Axis of attacks – Europe
Systemic attacks in the Middle East
Download the full report from here:
https://sectrio.com/resources/ot-threat-landscape-reports/sectrio-releases-ot-ics-and-iot-security-threat-landscape-report-2024/
JMeter webinar - integration with InfluxDB and GrafanaRTTS
Watch this recorded webinar about real-time monitoring of application performance. See how to integrate Apache JMeter, the open-source leader in performance testing, with InfluxDB, the open-source time-series database, and Grafana, the open-source analytics and visualization application.
In this webinar, we will review the benefits of leveraging InfluxDB and Grafana when executing load tests and demonstrate how these tools are used to visualize performance metrics.
Length: 30 minutes
Session Overview
-------------------------------------------
During this webinar, we will cover the following topics while demonstrating the integrations of JMeter, InfluxDB and Grafana:
- What out-of-the-box solutions are available for real-time monitoring JMeter tests?
- What are the benefits of integrating InfluxDB and Grafana into the load testing stack?
- Which features are provided by Grafana?
- Demonstration of InfluxDB and Grafana using a practice web application
To view the webinar recording, go to:
https://www.rttsweb.com/jmeter-integration-webinar
Epistemic Interaction - tuning interfaces to provide information for AI supportAlan Dix
Paper presented at SYNERGY workshop at AVI 2024, Genoa, Italy. 3rd June 2024
https://alandix.com/academic/papers/synergy2024-epistemic/
As machine learning integrates deeper into human-computer interactions, the concept of epistemic interaction emerges, aiming to refine these interactions to enhance system adaptability. This approach encourages minor, intentional adjustments in user behaviour to enrich the data available for system learning. This paper introduces epistemic interaction within the context of human-system communication, illustrating how deliberate interaction design can improve system understanding and adaptation. Through concrete examples, we demonstrate the potential of epistemic interaction to significantly advance human-computer interaction by leveraging intuitive human communication strategies to inform system design and functionality, offering a novel pathway for enriching user-system engagements.
Encryption in Microsoft 365 - ExpertsLive Netherlands 2024Albert Hoitingh
In this session I delve into the encryption technology used in Microsoft 365 and Microsoft Purview. Including the concepts of Customer Key and Double Key Encryption.
Essentials of Automations: Optimizing FME Workflows with ParametersSafe Software
Are you looking to streamline your workflows and boost your projects’ efficiency? Do you find yourself searching for ways to add flexibility and control over your FME workflows? If so, you’re in the right place.
Join us for an insightful dive into the world of FME parameters, a critical element in optimizing workflow efficiency. This webinar marks the beginning of our three-part “Essentials of Automation” series. This first webinar is designed to equip you with the knowledge and skills to utilize parameters effectively: enhancing the flexibility, maintainability, and user control of your FME projects.
Here’s what you’ll gain:
- Essentials of FME Parameters: Understand the pivotal role of parameters, including Reader/Writer, Transformer, User, and FME Flow categories. Discover how they are the key to unlocking automation and optimization within your workflows.
- Practical Applications in FME Form: Delve into key user parameter types including choice, connections, and file URLs. Allow users to control how a workflow runs, making your workflows more reusable. Learn to import values and deliver the best user experience for your workflows while enhancing accuracy.
- Optimization Strategies in FME Flow: Explore the creation and strategic deployment of parameters in FME Flow, including the use of deployment and geometry parameters, to maximize workflow efficiency.
- Pro Tips for Success: Gain insights on parameterizing connections and leveraging new features like Conditional Visibility for clarity and simplicity.
We’ll wrap up with a glimpse into future webinars, followed by a Q&A session to address your specific questions surrounding this topic.
Don’t miss this opportunity to elevate your FME expertise and drive your projects to new heights of efficiency.
Neuro-symbolic is not enough, we need neuro-*semantic*Frank van Harmelen
Neuro-symbolic (NeSy) AI is on the rise. However, simply machine learning on just any symbolic structure is not sufficient to really harvest the gains of NeSy. These will only be gained when the symbolic structures have an actual semantics. I give an operational definition of semantics as “predictable inference”.
All of this illustrated with link prediction over knowledge graphs, but the argument is general.
Generating a custom Ruby SDK for your web service or Rails API using Smithyg2nightmarescribd
Have you ever wanted a Ruby client API to communicate with your web service? Smithy is a protocol-agnostic language for defining services and SDKs. Smithy Ruby is an implementation of Smithy that generates a Ruby SDK using a Smithy model. In this talk, we will explore Smithy and Smithy Ruby to learn how to generate custom feature-rich SDKs that can communicate with any web service, such as a Rails JSON API.
Slack (or Teams) Automation for Bonterra Impact Management (fka Social Soluti...Jeffrey Haguewood
Sidekick Solutions uses Bonterra Impact Management (fka Social Solutions Apricot) and automation solutions to integrate data for business workflows.
We believe integration and automation are essential to user experience and the promise of efficient work through technology. Automation is the critical ingredient to realizing that full vision. We develop integration products and services for Bonterra Case Management software to support the deployment of automations for a variety of use cases.
This video focuses on the notifications, alerts, and approval requests using Slack for Bonterra Impact Management. The solutions covered in this webinar can also be deployed for Microsoft Teams.
Interested in deploying notification automations for Bonterra Impact Management? Contact us at sales@sidekicksolutionsllc.com to discuss next steps.
Transcript: Selling digital books in 2024: Insights from industry leaders - T...BookNet Canada
The publishing industry has been selling digital audiobooks and ebooks for over a decade and has found its groove. What’s changed? What has stayed the same? Where do we go from here? Join a group of leading sales peers from across the industry for a conversation about the lessons learned since the popularization of digital books, best practices, digital book supply chain management, and more.
Link to video recording: https://bnctechforum.ca/sessions/selling-digital-books-in-2024-insights-from-industry-leaders/
Presented by BookNet Canada on May 28, 2024, with support from the Department of Canadian Heritage.
UiPath Test Automation using UiPath Test Suite series, part 4DianaGray10
Welcome to UiPath Test Automation using UiPath Test Suite series part 4. In this session, we will cover Test Manager overview along with SAP heatmap.
The UiPath Test Manager overview with SAP heatmap webinar offers a concise yet comprehensive exploration of the role of a Test Manager within SAP environments, coupled with the utilization of heatmaps for effective testing strategies.
Participants will gain insights into the responsibilities, challenges, and best practices associated with test management in SAP projects. Additionally, the webinar delves into the significance of heatmaps as a visual aid for identifying testing priorities, areas of risk, and resource allocation within SAP landscapes. Through this session, attendees can expect to enhance their understanding of test management principles while learning practical approaches to optimize testing processes in SAP environments using heatmap visualization techniques
What will you get from this session?
1. Insights into SAP testing best practices
2. Heatmap utilization for testing
3. Optimization of testing processes
4. Demo
Topics covered:
Execution from the test manager
Orchestrator execution result
Defect reporting
SAP heatmap example with demo
Speaker:
Deepak Rai, Automation Practice Lead, Boundaryless Group and UiPath MVP
Elevating Tactical DDD Patterns Through Object CalisthenicsDorra BARTAGUIZ
After immersing yourself in the blue book and its red counterpart, attending DDD-focused conferences, and applying tactical patterns, you're left with a crucial question: How do I ensure my design is effective? Tactical patterns within Domain-Driven Design (DDD) serve as guiding principles for creating clear and manageable domain models. However, achieving success with these patterns requires additional guidance. Interestingly, we've observed that a set of constraints initially designed for training purposes remarkably aligns with effective pattern implementation, offering a more ‘mechanical’ approach. Let's explore together how Object Calisthenics can elevate the design of your tactical DDD patterns, offering concrete help for those venturing into DDD for the first time!
Dev Dives: Train smarter, not harder – active learning and UiPath LLMs for do...UiPathCommunity
💥 Speed, accuracy, and scaling – discover the superpowers of GenAI in action with UiPath Document Understanding and Communications Mining™:
See how to accelerate model training and optimize model performance with active learning
Learn about the latest enhancements to out-of-the-box document processing – with little to no training required
Get an exclusive demo of the new family of UiPath LLMs – GenAI models specialized for processing different types of documents and messages
This is a hands-on session specifically designed for automation developers and AI enthusiasts seeking to enhance their knowledge in leveraging the latest intelligent document processing capabilities offered by UiPath.
Speakers:
👨🏫 Andras Palfi, Senior Product Manager, UiPath
👩🏫 Lenka Dulovicova, Product Program Manager, UiPath
Kubernetes & AI - Beauty and the Beast !?! @KCD Istanbul 2024Tobias Schneck
As AI technology is pushing into IT I was wondering myself, as an “infrastructure container kubernetes guy”, how get this fancy AI technology get managed from an infrastructure operational view? Is it possible to apply our lovely cloud native principals as well? What benefit’s both technologies could bring to each other?
Let me take this questions and provide you a short journey through existing deployment models and use cases for AI software. On practical examples, we discuss what cloud/on-premise strategy we may need for applying it to our own infrastructure to get it to work from an enterprise perspective. I want to give an overview about infrastructure requirements and technologies, what could be beneficial or limiting your AI use cases in an enterprise environment. An interactive Demo will give you some insides, what approaches I got already working for real.
2. INTRODUCTION
In the last lecture we talked about the processes we
go through to build a 3D object.
We focused primarily on the polymesh.
In this lecture we are going to look at alternate
representations.
Bezier curves
Bezier Patches
NURBS surfaces
Constructive Solid Geometry
3. BEZIER CURVES
A Bezier Curve (or Bezier spline) is a curve defined
through the use of four vertices.
A start and end vertice
Two supplementary vertices that define the curve.
Known as the control points.
P1
P2
P3
P4
4. BEZIER CURVES
By manipulating the control points, we can change
the nature of the curve.
Governed by a mathematical formula.
P1
P2
P3
P4
5. BEZIER CURVES
Bezier curves are used for:
Modelling smooth curves
In a way that cannot be done with a polymesh
Curves appear smooth at all scales
Font representation
Vector/Outline fonts
Animation
Used to define smooth, realistic paths for movement.
6. BEZIER PATCHES
Related to the idea of a Bezier curve is a Bezier
patch.
Curves are 2D, patches are 3D
Bezier patches are shaped nets, the appearance of
which are determined by control points.
Control points act like gravity spots on underlying
shape.
The define the topology of the shape through mathematical
modelling of attraction
8. BEZIER PATCHES
Bezier patches offer several advantages
Integrity of representation
Continuity across boundaries
Awareness of neighbours
Fluid representation
Exact representation
Can measure volumes and surfaces
Economical
A single patch can represent many polygonal equivalents.
9. BEZIER PATCHES
However, they also have drawbacks.
Simple patch has 16 control points.
Rendering with a Bezier patch is expensive.
Around 10 times slower than equivalent polymesh
But this does not take into account the difference in time
requirements to model a polymesh correctly.
Large number of perspectives required to render
properly.
10. NURBS
Non-Uniform Rational B-Splines
Yikes!
Extension of the idea of a Bezier curve
Defined by control points.
Each control point has a weight
Defines how much that control point influences the
curve.
NURBS have knots
Vectors that describe how the resulting curve is
influenced by the control points.
NURBS have an order
How closely the curve follows the lines between control
points.
11. CONSTRUCTIVE SOLID GEOMETRY
Complex shapes modeled by using simple shapes.
To these shapes we add or subtract other simple
shapes.
Combination of shapes using boolean operators
and set theory allows for new and interesting
complex topographies.
Unions, Intersections, etc
12. CSG EXAMPLES
Images here show boolean operations – union, intersection, and
difference.
http://www.student.cs.uwaterloo.ca/~cs488/Contrib/f02/a5/djbigham/
13. INTERSECTIONS
When two primitives intersect, the new object is the
volume shared by both shapes
15. UNION
A union is both shapes together.
A merge, in other words.
The new object can be treated as a single new
shape
And be transformed as a holistic unit.
16. VOXEL REPRESENTATION
Sometimes need to represent 3D space as voxels.
3D Pixels
3D space broken up into three dimensional arrays
of voxels.
Each voxel labeled according to its object
occupancy.
17. VOXEL REPRESENTATION
Voxel arrays are:
Costly in terms of memory
Entire object space must be separated down into cubic
elements
Labelled according to object occupancy
Space subdivision
Frequently used in:
Game representations of terrain
Medical imagery
Ray tracing
18. SPACE SUBDIVISION
Process of space subdivision common to 2D and
3D graphics.
Easier to understand in 3D.
Start with a 1x1 square representing entire image.
Then recursively subdivide squares.
Stop when each pixel inside a subdivided square
has a single colour.
21. VOLUME SUBDIVISON
Works the same way in 3D as in 2D
We start with cubes
Recursive subdivide cubes
From our cube, subdivide into eight smaller cubes.
Can represent space/volume subdivision as a tree
data structure.
Easy to navigate and store
Offers greater efficiency of representation.
Advancement over simple voxel array.
22. SUMMARY
Various ways to represent 3D graphics beyond
polymeshes.
Bezier Curves
Bezier Patches
NURBS
CSG
Space Subdivision
Each technique has its real life applications.
The nature of the intended destination will dictate the
appropriate tool.