This document provides an overview of demand, supply, and equilibrium in markets. It defines key concepts such as:
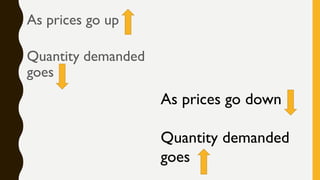
- The law of demand, which states that as price increases, quantity demanded decreases.
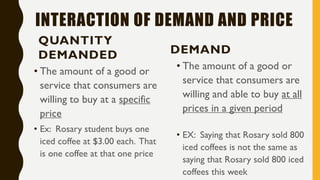
- Demand curves, which show the relationship between price and quantity demanded.
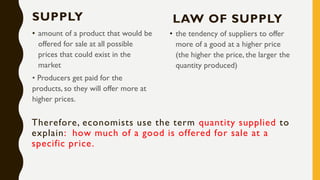
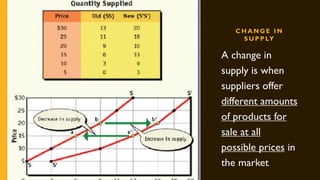
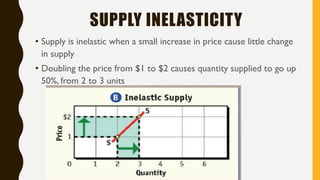
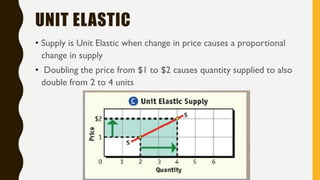
- Supply curves, which show the relationship between price and quantity supplied.
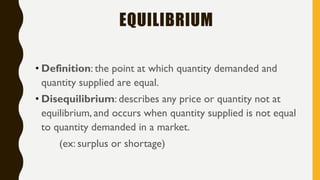
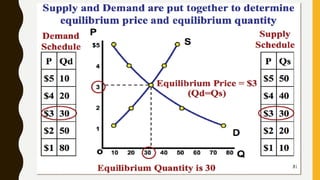
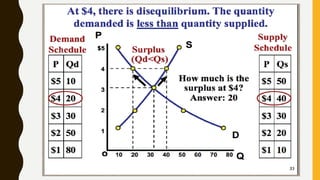
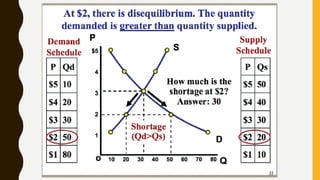
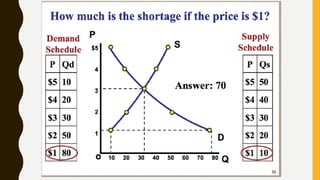
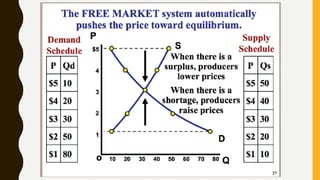
- Equilibrium, which is reached at the price where quantity demanded equals quantity supplied.
It also discusses factors that can cause demand and supply to shift, and the relationship between price elasticity and consumers' responsiveness to price changes.