SlideShare a Scribd company logo
1 of 15
Download to read offline
Impro
Enviro
Ogidi,
Departm
Michael O
Email: ar
© 2016. O
Noncomme
distribution
Inter
Volume 1
Type: Do
Host: Afr
Journal S
Publisher
Abstract
theory on
State is n
However,
data, wa
environm
the mana
disrupt p
enterpris
agribusin
environm
as a rem
business
influence
decreasin
Manager
business
control o
academic
economic
Key wor
oving
onment
, Armstr
ment of Agrib
Okpara Univ
rmstrongogid
gidi, A.E. This
rcial 3.0 Unpor
, and reproduct
rnation
11, Issue 1, p
uble Blind P
rica Research
Series: Acade
r: Internatio
t – The objec
n catfish prod
not more tha
r, a general (f
as adopted.
mental perturb
ager, but lon
production in
es were able
ness environm
ment remote c
ote, complex
environment
ed by the man
ng return to
rs should ens
environment
over the input
cs and mana
c, natural, sup
rds: Business
Catfish
t Remo
ong Emm
business & M
versity of Ag
di@gmail.co
is a research/re
rted License htt
ion in any mediu
nal Jour
pages 12‐25,
Peer Reviewe
h Corps (ww
emic Scholar
nal Academ
ctive of this s
duction in Be
an 198, the st
(full specifica
The catfish
bation. Howe
ng term scar
n stage 2, ca
to remotely c
ment. Thus,
control” as ob
x entity that c
t. The study
nager, but ad
scale is rem
sure that bus
t perturbation
ts resources w
gers to ident
ppliers, etc, th
environment,
Produ
te Cont
manuel
Management
griculture, Um
om | Phone:
eview paper, d
tp://creativecom
um, provided th
rnal of
, February, 2
ed Internatio
ww.africarese
rs Publishing
ic Journal fo
study is to ex
enue State, N
tudy deemed
ation) stochas
h farms wer
ever, immedia
rcity of inputs
an be remot
control the bu
the pheno
bserved by th
can be cajole
concluded th
dditional chan
motely contro
iness maneuv
ns arising fro
within the ca
tify other env
hat could pos
t, catfish prod
uction
trol The
(PhD St
t
mudike, P.M
0803622867
istributed unde
mmons.org/licen
e original work i
f Schola
2016
onal Researc
earchcorps.c
g League (AS
or Global Res
xamine the im
igeria. Since
d it adequate
stic frontier p
re able to c
ate control of
s within the
tely controlle
usiness enviro
menon gave
his study. This
d so as to red
hat immedia
nge in the leve
olled by the
vers and dec
om the busine
atfish busines
vironmental f
se serious thre
duction, imme
by U
eory
udent)
M.B. 7267, Um
71; 0705724
er the terms of
nses/by‐nc/3.0/)
is properly cited
arly Re
ch Journal
com)
SPL)
search (iajgr
mportance of
the populatio
e to use the p
production fu
cushion their
f the resourc
business env
ed. The study
onment by str
e rise to a
s term person
duce the full
ate control of
el of inputs, w
business env
cisions should
ess environm
s environmen
factors such
eats.
ediate control
tilizing
muahia, Abi
40174
f the Creative C
, permitting all
d.
esearch
r) Publishing
f business env
on of catfish
population as
unction for th
r catfish en
ces can easily
vironment, w
y found out
rategizing an
situation t
nifies the busi
wrath of the
f the resourc
which will sub
vironment. C
d be taken to
ent. In order
nt, efforts sho
as governme
l, remote con
Busin
a State, Nige
Commons Attrib
non‐commerci
h
(USA)
vironment co
farmers in B
s the sample
he cross‐sect
terprises ag
y be influence
which could e
that the ca
d adjusting to
termed “bus
iness environm
e threats from
ces can easil
bsequently lea
Catfish Produ
o mimic or re
to have effe
ould be mad
ent/political/l
ntrol
ess
eria |
bution‐
al use,
ontrol
enue
size.
ional
ainst
ed by
easily
atfish
o the
iness
ment
m the
ly be
ad to
ction
educe
ective
de by
legal,
Im
Michael
Abstract:
theory on
State is n
However,
data, wa
environm
manager,
productio
able to re
environm
control” a
entity tha
The study
but additi
remotely
business
perturbat
resources
to identify
etc, that c
Keywords
1. Intro
The Bus
accommo
internal
external
analysis
determin
(Ottih, 2
and activ
the ente
mproving Cat
Improv
E
Okpara Univ
Email: ar
The objectiv
n catfish prod
not more tha
a general (f
as adopted.
ental perturb
but long ter
on in stage 2,
emotely cont
ent. Thus, th
as observed b
at can be cajo
y concluded t
ional change
controlled b
maneuvers
tions arising f
within the ca
y other enviro
could pose se
s: Business en
duction
siness envir
odates both
environmen
environmen
(Ogidi, 201
ning the suc
006). Busine
vities of catf
rprise (Ogidi
tfish Productio
aspljo
ving Catf
Environm
Ogidi, A
Depart
versity of Ag
mstrongogid
ve of this stu
duction in Be
n 198, the st
(full specifica
The catfish
bation. Howev
rm scarcity of
can be remo
trol the busin
he phenomen
by this study.
oled so as to
that immedia
in the level o
by the busine
and decision
from the bus
atfish busines
onmental fac
rious threats.
nvironment, c
ronment of
h the intern
nt presents
nt presents e
16). This im
ccess, failure
ess environm
fish enterpr
i, 2016). How
In
on by Utilizin
ournals@afr
fish Prod
ment Re
rmstrong E
tment of Ag
griculture, Um
di@gmail.co
udy is to exa
nue State, N
tudy deemed
tion) stochas
farms wer
ver, immediat
of inputs with
otely controlle
ness environm
non gave rise
This term pe
reduce the f
ate control of
of inputs, whi
ess environm
ns should b
iness environ
ss environme
ctors such as
.
catfish produc
f agribusine
nal and ext
enterprise
environment
mplies that
e and even
ment is seen
ise producti
wever, the e
nternationa
ng Business E
ricaresearch
duction b
emote Co
Emmanuel
ribusiness &
mudike, P.M
om | Phone:
amine the im
Nigeria. Since
d it adequate
stic frontier p
re able to
te control of t
hin the busine
ed. The study
ment by stra
e to a situat
rsonifies the
full wrath of
f the resource
ich will subse
ment. Catfish
be taken to
nment. In ord
ent, efforts sh
government/
ction, immedi
ess from t
ternal comp
strengths a
tal opportun
the environ
continued
n to contain
on units – a
environment
l Journal of S
Volume 11,
Environment R
hcorps.com
by Utiliz
ontrol T
l (PhD Stud
& Manageme
M.B. 7267, Um
0803622867
mportance of
the populati
e to use the p
production fu
cushion thei
the resources
ess environm
y found out th
ategizing and
tion termed
business envi
the threats fr
es can easily
quently lead
Production
mimic or
der to have ef
hould be mad
/political/lega
iate control, r
he broader
ponents (Og
and enterpr
nities and en
nment facto
existence o
n factors tha
also referred
t of agribusi
Scholarly Re
Issue 1, (Feb
ww
Remote Cont
zing Busi
Theory
dent)
ent
muahia, Abi
71; 0705724
f business en
ion of catfish
population a
unction for t
ir catfish en
s can easily be
ment, which co
hat the catfish
d adjusting to
“business en
ironment as a
from the busi
be influenced
to decreasing
Managers sh
reduce busin
ffective contr
de by academ
al, economic,
remote contro
r, all inclus
gidi and Um
rises weakn
nvironmenta
or plays a
of the busin
at influence
d to as the t
ness can be
esearch (ASP
bruary, 2016
ww.africares
trol Theory
12 | P
iness
a State, Nige
40174
vironment co
farmers in B
s the sample
the cross‐sec
nterprises ag
e influenced b
ould easily di
h enterprises
o the agribus
vironment re
a remote, com
iness environm
d by the man
g return to sc
hould ensure
ness environ
rol over the i
mics and man
natural, supp
ol
sive perspe
meh, 2015).
esses; while
l threats – S
decisive ro
ness organiz
e policy deci
technical co
defined as t
PL Journal Se
6) pages 12
searchcorps.
a g e
eria |
ontrol
Benue
e size.
tional
gainst
by the
isrupt
were
siness
emote
mplex
ment.
nager,
cale is
e that
nment
inputs
nagers
pliers,
ective
. The
e the
SWOT
ole in
ation
sions
ore of
those
ries)
– 25
com
Improving Catfish Production by Utilizing Business Environment Remote Control Theory
aspljournals@africaresearchcorps.com 13 | P a g e
factors, institutions and infrastructures that exist outside the agribusiness firm that affects
decisions, objectives and activities of the business (Ogidi, 2016). Under the business
environment concept, three forces that constitute threat or opportunity to the catfish
enterprise were examined in this study. These forces are: physical, social and institutional
factors.
2. Theoretical Framework
2.1. Business environment complexity theory
Complexity theory offers a conceptual framework that incorporates the essential
unpredictability of economic and environmental systems with the emergence of distinctive and
contingently stable patterns (Ormerod, 1998; Anderson, 1999). Complexity was originally
developed through advances in non‐linear mathematics (Thom, 1975), thermodynamics
(Prigogine and Glansdorf, 1971), and computational sciences (Simon, 1962). These ideas were
quickly adapted to social systems (Ulrich and Probtst, 1984) and during the 1990s interest
exploded in relation to management and organizations (Ashmos and Huber, 1987; Levy, 1994;
Merry, 1995). Complexity theory goes beyond systems perspectives through advances in
deterministic chaos theory (Lorenz, 1963; Kiel and Elliott, 1996), power‐law phenomena
(Andriani and McKelvey, 2009) and computational methodologies (Kauff man, 1993; Davis,
Eisenhardt and Bingham, 2007). Complexity theory recognizes that economic and
environmental systems comprise a multitude of agents, from individuals to large organizations,
with distinctive properties at each level. The economy, for example, comprises individual
consumers and workers, firms, markets, industries, and national economies. While all these
levels are interdependent, higher‐level aggregations exhibit “emergent” properties that cannot
easily be reduced to the interaction of lower levels (Holland, 1998). Macroeconomics, for
example, relies on constructs and theories that differ from those relating to individual firms and
consumers.
Understanding business environment complexity has been a long‐standing concern of
organization theory (Simon, 1962). It offers insights into the emergence of patterned structure
and order in higher‐level systems, such as the Earth’s climate, economic organizations and
social institutions, but also provides methods for finding fundamental relationships and
simplicity behind complex phenomena. Complexity helps explain how systems can evolve in
unexpected ways, exhibiting dramatic instability (Rudolph and Repenning, 2002) and even
collapse (McKelvey, 1999). The weather, the global climate, and the economy are complex
systems that exhibit such chaotic behavior (Brock, Hsieh and LeBaron, 1991).
2.2. Chaos theory
This is a core science of complexity. It explores systems in which the recursive application of
non‐linear functions gives rise to highly complex yet patterned behavior. Chaotic systems have
several notable characteristics. First, they are unpredictable in the longer term, even though
they are driven by deterministic rules. Weather conditions, for example, evolve due to well‐
understood interactions among variables such as humidity, air pressure, and temperature;
however, the non‐linear nature of these interactions makes it impossible to predict the long‐
term evolution of the weather system. The trajectory of chaotic systems such as these is highly
Improving Catfish Production by Utilizing Business Environment Remote Control Theory
aspljournals@africaresearchcorps.com 14 | P a g e
dependent on initial starting conditions: the proverbial butterfly could theoretically cause
perturbations that are amplified through successive interactions and reverberate throughout
the entire weather system.
An important corollary is that, although chaotic systems never return to the same
precise state, the outcomes have predictable boundaries that generate well‐known patterns
(Dooley and Van De Ven, 1999). Hurricanes emerge in late summer, though we never know
their exact timing, path, or strength. Industries exhibit typical patterns of growth and maturity,
yet evolve in unpredictable ways. These patterns are shaped by “strange attractors,” structural
features of systems that constrain and mold their evolution. The patterns reflect macro‐level
emergent properties: hurricanes, economic recessions, and social movements exhibit system‐
wide patterns that are distinct from the properties of the components from which these
systems emerge.
Another important feature of complex systems is that change can be endogenous;
under certain conditions interactions can cascade into system transformation (Cheng and Van
De Ven, 1996). Similarly, a stock market collapse can be caused by positive feedback
mechanisms affecting investor confidence, liquidity constraints, and computer driven trading.
Moreover, systems do not necessarily recover their original pattern after a collapse; rather,
they can shit to a new pattern around a different attractor.
The economy can become mired in a self‐perpetuating depression, and the climate can
become locked in an ice age. Crucially, these critical thresholds are hard to predict. Some
relatively large perturbations might peter out while smaller ones can propagate into larger‐
scale shit s. Despite this unpredictability, however, the pattern of sudden shits, from
earthquakes to stock market crashes, tends to follow a power law (Andriani and McKelvey,
2009), such that the frequency of large‐scale events is inversely related to their magnitude.
These features of chaotic systems provide an important basis for understanding the links
between the economy and the environment.
2.3. A theory of change in turbulent environments
Within the resource‐based view, resources are the basic units of analysis. A firm’s resources are
often classified as financial, human, intangible, organizational, physical, and technological
(Bogner, Mahoney and Thomas, 1998). Resources are the stocks of available productive factors
owned or controlled by the firm (Madhok, 1996). Often what makes resources economically
valuable is the way in which these resources are deployed and developed (Kor and Leblebici,
2005). For resources to be utilized in production and to provide a firm’s distinctive productive
services (Penrose, 1959), certain organizational processes must be developed. Capabilities
represent the organizational processes by which resources are assimilated and productively
deployed. These information‐based organizational processes tend to be firm specific and are
developed over substantial time periods through complex interactions among the firm’s
resources (Amit and Schoemaker, 1993). Capabilities are high‐level routines that provide an
organization’s management a set of decision options for producing an array of outputs (Nelson
and Winter, 1982). They are also typically substantial in scale, representing a large number of
activities that produce outputs that increase the likelihood of the firm’s survival and prosperity
(Winter, 2000). Further, dynamic capabilities involve the organizational processes by which
Improving Catfish Production by Utilizing Business Environment Remote Control Theory
aspljournals@africaresearchcorps.com 15 | P a g e
resources are utilized to create growth and adaptation within changing environments
(Eisenhardt and Martin, 2000; Lado, Boyd, Wright and Kroll, 2006; Teece, Pisano and Shuen,
1997). Dynamic capabilities pertain to the organization’s competencies to integrate, build, and
reconfigure resource positions in rapidly changing environments. They also reflect
organizational competencies to achieve new and innovative forms of competitive advantage
despite constraints of path dependencies and previous market positions (Arthur, 1994; Gruca
and Nath, 1994; Leonard‐Barton, 1992). Dynamic capabilities result from complicated
organizational and strategic routines (Zollo and Winter, 2002) through which managers
reconfigure and renew a firm’s resource base to generate economically value‐creating
strategies (Foss, 1996; Pisano, 1994). Thus, these capabilities are the fundamental drivers of the
creation, evolution, and recombination of other resources to provide new sources of growth
(Henderson, 1994; Henderson and Cockburn, 1994; Zander and Kogut, 1995). Dynamic
capabilities evolve in important ways that we have only begun to explain. Following Helfat and
Peteraf (2003), the current paper’s analysis describes the pattern of capability development
using the resource‐based view (Penrose, 1959; Wernerfelt, 1984) and the dynamic capabilities
approach (Eisenhardt and Martin, 2000; Teece, Pisano, and Shuen, 1997).
2.4. Contingency theory
According to contingency theory, the characteristics of the environment affect an
organization’s ability to obtain resources (Burns and Stalker, 1961). Managers must allow an
organization’s department to organize and control their activities in ways most likely to allow
them obtain resources; given the constraints of the particular environment they face (Lawrence
and Lorsch, 1969).
2.5. Production theory
The unit of analysis is the firm. This firm attempts to maximize output with given cost outlay
and given quantum of resources; the production function is a mathematical method for the
description of relationship between resources and output which is the basis for theory of
production (Umeh et al. 2013). Implicitly we express it as follows: Y=f(X1, X2…Xn). Within the
firm, there are three basic physical relationships that form the basis for theory of production;
these are: 1) factor‐product relationship, 2) factor‐factor relationship and 3) product‐product
relationship. However, this study is a factor‐product relationship study.
3. Methodology
3.1. Population and Sampling Procedure
The sampled population of the study is basically of catfish farmers in Benue State. A first
attempt at a comprehensive, nationwide inventory of inland water resources was made by the
Aquaculture and Inland Fisheries Project (AIFP) of the National Special Program for Food
Security (NSPFS). According to this inventory, Benue State has 198 Catfish farms – the highest
compared to other Northern States in Nigeria (FAO, 2007). Since the population of catfish
farmers in Benue State is not more than 198, the study deemed it adequate to use the
population as the sample size. Therefore, the sample size for this study remains 198 catfish
farmers. The list of catfish farmers in Benue State obtained from FAO (2007) and Benue State
Ministry of Agriculture was distributed across the zones as follows: 36 catfish farmers from
Improving Catfish Production by Utilizing Business Environment Remote Control Theory
aspljournals@africaresearchcorps.com 16 | P a g e
Zone A, 119 catfish farmers from Zone B, and 43 catfish farmers from Zone C.
3.2. Data Collection Techniques
Primary data were utilized in this study, through the use of structured questionnaire. The
primary data used in this study come from a questionnaire survey of 198 catfish producers in
Benue State for the production year 2013/2014. The questionnaire set was carefully structured
by taking into consideration factors critical to the quality of instrument developed. Secondary
data from literature (FAO, 2007) were used to determine the population size for this study.
3.3. Data Analytical Techniques
The stochastic frontier model was originally proposed for the analysis of the panel data by
Battese and Coelli (1995). However, a general (full specification) stochastic frontier production
function for the cross‐sectional data, which is considered in this paper, is defined by
Where:
= denotes the output for the ith sample farm (kg)
= represents a vector whose values are functions of inputs and other explanatory
variables for the ith farm
= is a vector of unknown parameters to be estimated are assumed to be independent
and identically distributed random
s = are assumed to be independent and identically distributed random errors which have
normal distribution with mean zero and unknown variance and
s = are non‐negative unobservable random variables associated with the technical
inefficiency of production, such that for a given technology and levels of inputs, the
observed output falls short of its potential.
Technical inefficiency effect model proposed by Battese and Coelli (1995) is described by
Where:
= is a vector of explanatory variables associated with the technical inefficiency
effects of the tth
farmer
= is an vector of unknown parameters to be estimated
Battese and Coelli (1988) considered the maximum likelihood estimator which involves
specification of the distribution of Vi and Ui. The random variables Vi and Ui are assumed to be
mutually independent and independent of the input variables in the model. If Ui = 0, the
assumed distribution is half‐normal. Where outputs are expressed in logarithms, the technical
efficiency of the ith
farm is estimated as a ratio of the observed to maximum feasible output,
where the latter is provided by the stochastic frontier production. The measure of technical
efficiency is given by
Improving Catfish Production by Utilizing Business Environment Remote Control Theory
aspljournals@africaresearchcorps.com 17 | P a g e
/
If Ui = 0, the farm were 100 percent efficient. Maximum‐likelihood estimates of the parameters
in the model were obtained. The parametric model is estimated in terms of the variance
parameters, and / (Umeh et al. 2013). In case of cross‐sectional
data, the technical inefficiency model can only be estimated if the inefficiency effects Ui’s are
stochastic and have particular distributional properties (Battese and Coelli, 1995). Therefore it
is of interest to test the null hypotheses that technical inefficiency effects, , are non‐
stochastic. The parameter, , has a value between zero and one, in such a way that it is
desirable to test the null hypothesis of Ho: = 0 whether traditional production function is an
adequate representation of the sample data. If so, the non‐negative random variable is
absent from the model. The generalized likelihood‐ratio test statistic can be calculated from the
logarithms of the likelihood function associated with the unrestricted and restricted maximum
likelihood estimates for the special case in which the appropriate parameter is zero.
The structure of the General Model is imbedded in the equation linking catfish output to
resources (inputs) on one hand (Model 1) and inefficiency model (Model 2) on the other. In the
inefficiency model, inefficiency effect is linked with the business environment. Business
environment factors are captured, through variables that influence the welfare or performance
of the catfish production in the study area. This study will focus on the following business
environment factors, i.e. physical, social and institutional factors.
∑
………………………………………………………………………………................. (Model 1)
Where:
Log or ln = natural logarithm;
I = sample of catfish enterprises
j = number of inputs and farm‐specific variables
Y = represents yield of the catfish enterprises in kg
= fingerlings used in production (kg); a priori expectation is positive
= quantity of standard feeds used (kg); a priori expectation is positive
= labor requirements (man‐days); a priori expectation is positive
= pond size of fish enterprise (m2
); a priori expectation is positive
s = parameters of linear terms; j = 0, 1... 4 are parameters to be estimated
= Log of estimated values of inputs, output and error term
s = statistical errors and random shocks such as faulty equipments, low quality fish feed,
errors in measurement; are assumed to be independent and identically distributed N (0, )
random variables
Improving Catfish Production by Utilizing Business Environment Remote Control Theory
aspljournals@africaresearchcorps.com 18 | P a g e
s = error term measuring the level of inefficiency in production; are assumed to be
independent and identically distributed non‐negative truncations of the N (, ) distribution.
The inefficiency model for the study is shown below;
∑
⋯ ………………… (Model 2)
Where:
= inefficiency effect
= Explanatory variables for the technical inefficiency effects for the ith
farmer,
s = parameters of demographic and environment of business variables
= Accessible roads to production unit [AROADS] (Dummy: accessible roads to production unit
=1, bad roads to production unit=0); a priori expectation is positive
= Cost of energy [COSTPF] (N); a priori expectation is negative
= Cost of water storage [COSTSF] (N); a priori expectation is negative
= Number of years spent acquiring formal education [EDUCAT] (yrs); a priori expectation is
negative
= Years of experience in catfish production business [EXPERI] (yrs); a priori expectation is
negative
= Collaboration with model catfish farmers [COLLABO] (Dummy: access to
consultants/vets=1, No access to consultants/vets=0); a priori expectation is positive
= Credit obtained from financial institutions [CREDIT] (N); a priori expectation is negative
= Cost of innovation/technology in fish production from research institutions [COSTIN] (N); a
priori expectation is negative
= Availability of market intermediaries for catfish output [AVLMKT] (Dummy: access to
market institution/intermediaries = 1, scarce markets = 0); a priori expectation is positive
The generalized likelihood ratio statistic is computed as  2 / ,
where, and are the likelihood functions evaluated at the restricted and
unrestricted maximum likelihood estimator for the parameters. If the null hypothesis, , is
true, then the statistics has approximately a chi‐squared distribution with parameter equal to
the number of restriction imposed by and with the degree of freedom equal to the
difference between the parameter estimated under and respectively. The value of the γ
indicates the relative magnitude of the variance associated, with the distribution of inefficiency
effects, . If in the stochastic frontier are not present or alternatively, if the variance
parameter, γ, associated with the distribution of, , has zero value, then, , in (model1) –
(model 2) is zero and the model reduces to a traditional function with the variables, fingerlings,
feeds, labor and pond size, all included in the production function meaning that inefficiency
effects are not stochastic.
4. Results and Discussion
4.1. The Return to Scale
The Return to Scale (RTS) from the general model consisting of both Cobb‐Douglass Stochastic
Improving Catfish Production by Utilizing Business Environment Remote Control Theory
aspljournals@africaresearchcorps.com 19 | P a g e
Production Frontier model and the inefficiency model is 0.9797, on the catfish enterprise. This
was largely influenced by inefficiency effects from the business environment. Comparing this
with the three restricted models (see Table 1, Columns 3, 4 and 5), the RTS values are: 1.0669,
0.9877 and 1.0692. The RTS attained in the pooled data and the Social effects model shows that
the catfish farms were producing at stage 2 of the production function also known as the
decreasing returns to scale stage (rational stage). Table 2 shows that fingerlings, feeds, labor
and pond size are operating in stage 2, i.e. they are increasing at a decreasing rate and are
operating in the rational stage of production. This study’s result is in tandem with the findings
of Ogundari, Ojo and Brummer (2005) in a study of aquaculture in Oyo State with RTS of 0.841.
This current study’s RTS (0.9797) is also in accordance with the RTS (0.664) of Emokaro and
Ekunwe (2009).
Table 1: Elasticities of Production Frontier and Returns to Scale (RTS)
Output Elasticities of the Frontier
Variables General
Model
Physical Effects
Only
Social Effects
Only
Institutional
Effects Only
FING (kg/m2
) 0.171 0.220 0.176 0.236
FEED (kg/m2
) 0.0534 0.0571 0.0626 0.0636
LABO (man days/m2
) 0.0353 0.0258 0.0361 0.0236
POSI (m2
) 0.720 0.764 0.713 0.746
Returns to Scale (RTS) 0.9797 1.0669 0.9877 1.0692
Note: RTS for the following studies are as follows: Emokaro and Ekunme (2009) is 0.664 and Ogundari, Ojo and Brummer (2005)
is 0.841
The frontier result has helped to identify the technical efficiency implications arising
from the effect of business environment on catfish production in Benue State, Nigeria. The
study would explain the business maneuvers and decisions taken by the catfish producer to
mimic or reduce business environment perturbations arising from the business environment.
4.2. Business Environment Remote Control Theory
The physical effects only model, the institutional effects only model, social and institutional
Improving Catfish Production by Utilizing Business Environment Remote Control Theory
aspljournals@africaresearchcorps.com 20 | P a g e
combinations model, physical and institutional combinations model are operating in stage 1 of
the production function also known as the increasing returns stage which is also the irrational
stage. In theory, this stage is perceived to under utilize input resources.
Note: S = Social Factors, P = Physical Factors, I = Institutional Factors, RTS = Return to Scale, Es = Environments, Ep
= Elasticities of Production
Figure 1: Business Environment Remote Control Effect on Return to Scale (RTS)
The restricted state (that is, social effects only), the combination of physical and social
effects model and the entire business environment variables are operating in stage 2 (rational
stage) of the production function which is the state of decreasing returns (see Figure 1 above).
In practice, the catfish producers in our study area are operating in stage 2 – the rational stage.
This is because, the farmers were able to identify business environment variable items and
Ep = 0
Ep > 1 Ep = 1 Ep < 0
DRAMATIC
INSTABILITY
REMOTE
CONTROL EFFECT
Social E RTS = 0.9877
S & I E – RTS = 1.0035 P & S E – RTS = 0.9835
Business E RTS = 0.9797
P & I E – RTS = 1.0459
Physical E RTS = 1.0669
Institutional E RTS = 1.0692
INCREASING
RETURNS
STAGE 1
(IRRATIONAL)
DECREASING
NEGATIVE
RETURNS
STAGE 3
(IRRATIONAL)
DEREASING RETURNS
STAGE 2
(RATIONAL)
Improving Catfish Production by Utilizing Business Environment Remote Control Theory
aspljournals@africaresearchcorps.com 21 | P a g e
succeeded in strategizing and controlling the environment to avoid producing outside stage 2 of
the production function. This finding is in cognizance with Ogundari, Ojo and Brummer (2006)
and Emekaro and Ekume (2009). Thus, the more business environment variables that are
identified and controlled, the more likelihood of the catfish manager to produce within stage 2.
The catfish farms were able to cushion their catfish enterprises against environmental
perturbation. However, immediate control of the resources can easily be influenced by the
manager, but long term scarcity of inputs within the business environment, which could easily
disrupt production in stage 2, can be remotely controlled. The study found out that the catfish
enterprises were able to remotely control the business environment by strategizing and
adjusting to the agribusiness environment. Thus, the phenomenon gives rise to a situation
termed “business environment remote control” as observed by this study. This term personifies
the business environment as a remote, complex entity that can be cajoled so as to reduce the
full wrath of the threats from the business environment. Our theory is in line with Rudolph and
Repenning (2002)’s Disaster Dynamics or Business Environment Complexity Theory –
complexity helps explain how systems can evolve in unexpected ways, exhibiting dramatic
instability. This theory is depicted by Figure 1, which indicates that the RTS of the Business
Environment is closer to the border line between stage 2 and stage 3. On the other hand, the
RTS of the Social, Physical and Institutional Factors and their combinations are either in stage 1
or stage 2, however, they are not close to the border line between stage 2 and stage 3.
Table 2: Cobb–Douglas Production Frontier Functions with Log Likelihood Estimates and LR
Test of the One Sided Error (n=174)
Cobb‐
Douglas
Frontier
Production
Function
General
Model
Physical
Factors are
Excluded
Social
Factors are
Excluded
Institutional
Factors are
Excluded
Variable
Frontier Production
Function
Constant ‐42.882
(27.303)
0.391**
(0.177)
0.372**
(0.161)
0.274***
(0.151)
0.389**
(0.170)
FING (kg/m2
) 25.370**
(8.291)
0.171**
(0.07661)
0.202
(0.123)
0.215**
(0.072)
0.169**
(0.0752)
FEED (kg/m2
) 0.00876
(0.00638)
0.0534*
(0.0166)
0.0601*
(0.0165)
0.0590*
(0.0152)
0.0577*
(0.0154)
LABO (man days/m2
) 0.0113
(0.00638)
0.0353
(0.0207)
0.0304
(0.0262)
0.0319
(0.0208)
0.0398***
(0.0203)
Improving Catfish Production by Utilizing Business Environment Remote Control Theory
aspljournals@africaresearchcorps.com 22 | P a g e
POSI (m2
) 0.7554*
(0.0772)
0.720*
(0.0779)
0.711*
(0.0714)
0.740*
(0.0688)
0.717*
(0.0765)
Inefficiency effects model
Constant 0.141***
(0.0713)
0.128
(0.119)
0.0320**
(0.0122)
0.174*
(0.550)
AROADS (dummy) 0.0127
(0.0133)
0.0117
(0.0140)
0.0124
(0.00801)
COSTPF (N) ‐0.00216
(0.00344)
0.000207
(0.000921)
0.000362
(0.00247)
COSTSF(N) ‐0.00175
(0.00263)
‐0.00539
(0.00451)
‐0.00292
(0.00193)
EDUCAT (yrs) ‐0.0506
(0.541)
‐0.0416
(0.0809)
‐0.0661
(0.0410)
EXPERI (yrs) ‐0.0127
(0.0263)
‐0.0185
(0.0280)
‐0.0108
(0.0202)
ACONS (dummy) ‐0.0631*
(0.0182)
‐0.0572**
(0.0226)
‐0.0577*
(0.0136)
CREDIT (N) ‐0.00207
(0.0031)
‐0.00149
(0.361)
‐0.00326*
(0.000765)
COSTIN (N) ‐0.00315
(0.00252)
‐0.00199
(0.00641)
‐0.0115*
(0.00435)
AVLMKT (dummy) 0.00908
(0.00943)
‐0.0218
(0.0617)
‐0.0166*
(0.00430)
Variance parameters
Sigma‐squared 9181.350*
(55.470)
0.00222*
(0.000286)
0.00226*
(0.000354)
0.00242*
(0.000255)
0.00227*
(0.000232)
Gamma 0.0258
(0.133)
0.000311**
(0.000137)
0.00835
(0.192)
0.0248
(0.000979)
0.00118
(0.0547)
Log Likelihood LLF ‐1038.077 283.723 278.740 279.785 282.634
LR test of the one sided
error
LR 30.612 20.647 22.736 28.434
*,** and *** indicate that the parameter is significant at the 1, 5 and 10%, respectively, figures
in parenthesis are error values
Improving Catfish Production by Utilizing Business Environment Remote Control Theory
aspljournals@africaresearchcorps.com 23 | P a g e
5. Conclusion and Recommendations
5.1. Conclusion
The study concludes that immediate control of resources can easily be influenced by the
manager, but additional change in the level of inputs, which will subsequently lead to
decreasing return to scale is remotely controlled by the business environment. Thus, the study
came up with the conclusion that, business environment (i.e. physical, social and institutional)
factors do have effect on catfish production in Benue State, Nigeria.
5.2. Recommendations
Based on the findings of this study, the following recommendations are appropriate:
i. However, the agribusiness manager or catfish producer needs to make meaning of the
frontier statistics.
ii. Catfish Production Managers should ensure that business maneuvers and decisions
should be taken to mimic or reduce business environment perturbations arising from
the business environment.
iii. In order to have effective control over the inputs resources within the catfish business
environment, efforts should be made by academics and managers to identify other
environmental factors such as government/political/legal, economic, natural, suppliers,
etc, that could pose serious threats.
References
Amit, R. and Schoemaker, P. (1993). Strategic Assets and Organizational Rent. Strategic
Management Journal, 14: 33‐46.
Anderson, P. (1999). Introduction to the Special Issue: Application of Complexity Theory to
Organization Science. Organization Science, 10(3):233‐236.
Andriani, P. and McKelvey, B. (2009). From Gaussian to Paretian Thinking: Causes and
Implications of Power Laws in Organizations. Organization Science, 20:1053‐1071.
Arthur, W. B. (1994) Increasing Returns and Path Dependence in the Economy. Ann Arbor, MI:
University of Michigan Press. 47 pp.
Ashmos, D. and Huber, G. (1987). The System Paradigm in Organization Theory: Correcting the
Record and Suggesting the Future. Academy of Management Review, 12:607‐621.
Battese, G.E. and Coelli, T. (1988). Prediction of Firm‐Level Technical Efficiencies with a
Generalized Frontier Production Function and Panel Data. Journal of Econometrics, 38:
387‐399.
Battese, G.E. and Coelli, T.J. (1995). Frontier Production Functions, Technical Efficiency and
Panel Data: With Application to Paddy farmers in India. Journal of Productivity Analysis,
3: 153‐208.
Improving Catfish Production by Utilizing Business Environment Remote Control Theory
aspljournals@africaresearchcorps.com 24 | P a g e
Bogner, W. C., Mahoney, J. T. and Thomas, H. (1998). Paradigm shift: Parallels in the Origin,
Evolution and Function of the Strategic Group Concept and the Resource‐based Theory
of the Firm. Advances in Strategic Management, 14: 63‐102.
Brock, W.A., Hsieh, D.A. and LeBaron, B. (1991). Nonlinear Dynamics, Chaos, and Instability:
Statistical Theory and Economic Evidence . Cambridge, MA: M.I.T. Press. 189 pp.
Cheng, Y. and Van De Ven, A. (1996). The Innovation Journey: Order out of Chaos?
Organization Science, 6: 593‐614.
Davis, J., Eisenhardt, K. and Bingham, C. (2007). Developing Theory through Simulation
Methods. Academy of Management Review, 32:480‐499.
Dooley, K. and Van De Ven, A. (1999). Explaining Complex Organizational Dynamics.
Organization Science, 10(3): 358‐372.
Eisenhardt, K. and Martin, J. (2000). Dynamic capabilities. Strategic Management Journal, 21:
1105‐1121.
Emokaro, C.O and Ekunwe, P.A. (2009). Efficiency of Resource‐use and Elasticity of production
among catfish farmers in Kaduna, Nigeria. Journal of Applied Sciences Research,
5(7):776‐779.
Food and Agriculture Organization (FAO) (2007). Fish Country Profile – The Federal Republic
of Nigeria. Rome: Author. 49 pp.
Foss, N. J. (1996). Knowledge‐based Approach to the Theory of the Firm: Some Critical
Comments. Organization Science, 7 (5): 470‐476.
Gruca, T. and Nath, D. (1994). Regulatory Change, Constraints on Adaptation and
Organizational Failure: An Empirical Analysis of Acute Care Hospitals. Strategic
Management Journal, 15: 345‐363.
Helfat, C. and Peteraf, M. (2003). The Dynamic RBV: Capability Lifecycles. Strategic
Management Journal, 24: 999‐1010.
Henderson, R. (1994). The Evolution of Integrative Capability and Innovation in
Cardiovasculardrug Discovery. Industrial and Corporate Change, 3 (3): 607‐630.
Henderson, R. and Cockburn, I. (1994). Measuring Competence? Exploring Firm Effects in
Pharmaceutical Research. Strategic Management Journal, 15: 63‐84.
Kauff man, S. (1993). The Origins of Order. New York, NY: Oxford University Press. 47 pp.
Kor, Y.Y. and Leblebici, H. (2005). How do Interdependencies among Human‐Capital
Deployment, Development, and Diversification Strategies Affect Firms’ Financial
Performance? Strategic Management Journal, 26 (10): 967‐985.
Lado, A., Boyd, N., Wright, P. and Kroll, M. (2006). Paradox and Theorizing within the
Resource Based View. Academy of Management Review, 31: 115‐131.
Leonard‐Barton, D. (1992). Core Capabilities and Core Rigidities: A Paradox in Managing New
Product Development. Strategic Management Journal, 13: 111‐125.
Levy, D. L. (1994). Chaos Theory and Strategy: Theory, Application, and Managerial
Implications. Strategic Management Journal, 15: 167‐178.
Madhok, A. (1996). The Organization of Economic Activity: Transaction Costs, Firm
Capabilities and the Nature of Governance. Organization Science, 7 (5): 578‐590.
McKelvey, B. (1998). Avoiding Complexity Catastrophe in Co‐evolutionary Pockets: Strategies
Improving Catfish Production by Utilizing Business Environment Remote Control Theory
aspljournals@africaresearchcorps.com 25 | P a g e
for Rugged Landscapes. Organization Science , 10(3):294‐321.
Nelson, R. R. and Winter, S. G. (1982). An Evolutionary Theory of Economic Change.
Cambridge, MA: Belknap Press of Harvard University Press. 332 pp.
Ogidi, A.E., Adekitan, R. and Odiba, R.I. (2013). Environmental Analysis and Diagnosis of Catfish
Enterprises. Journal of Business and Management, 6(6):09‐17.
Ogidi, A. E. and Umeh, J.C. (2015). Effect of Business Environment on Catfish Production in
Zone C, Benue State, Nigeria. International Academic Journal of Empirical Research,
1(1):37‐47.
Ogidi, A. E. (2016). Environment of Agribusiness. Nigeria: Africa Research Corps Publishing.
Ogundari, K., Ojo, S.O. and Brummer, B. (2005). Productivity Potential and Technical
Efficiency of Aquaculture Production in Alleviating Poverty: Empirical
Evidence from Nigeria. J. Fish. Int. 1(1‐2): 21‐26.
Ottih, L.O. (2006). General Management: Strategy, Implementation and Control. (3rd
Ed.).
Nigeria. Port Harcourt: Pearl Publishers. 246 pp.
Penrose, E. T. (1959). The Theory of the Growth of the Firm. New York, NY: John Wiley & Sons.
135 pp.
Pisano, G. (1994). Knowledge, Integration, and the Locus of Learning: An Empirical Analysis of
Process Development. Strategic Management Journal, 15 (Special Issue): 85‐100.
Prigogine, I. and Glansdorff , P. (1971). Thermodynamic Theory of Structure, Stability, and
Fluctuations. New York: Wiley & Sons. 361 pp.
Rudolph, J. and Repenning, N. (2002). Disaster Dynamics: Understanding the Role of Quantity
in Organizational Collapse. Administrative Science Quarterly, 47, 1‐30.
Teece, D. J., Rumelt, R., Dosi, G. and Winter, S. (1997). Understanding Corporate Coherence:
Theory and Evidence. Journal of Economic Behavior and Organization, 23: 1‐30.
Umeh, J.C., Asogwa, B.C. and Ater, P.I. (2013). Production Economics: Some Analytical
Perspectives. Nigeria, Enugu State: El’Demak Ltd. 233pp
Wernerfelt, B. (1984). A resource‐based view of the firm. Strategic Management Journal, 5(2):
171‐180.
Winter, S. G. (2000). The satisfying principle in capability learning. Strategic Management
Journal, 21: 981‐996.
Zander, U., B. Kogut. (1995). Knowledge and the Speed of Transfer and Imitation of
Organizational Capabilities: An Empirical Test. Organization Science 6, (1): 76‐82. Zollo,
M. and Winter, S. (2002). Deliberate Learning and the Evolution of Dynamic Capabilities.
Organization Science, 13: 339‐351.

More Related Content

Similar to Improving Catfish Production By Utilizing Business Environment Remote Control Theory

Research needs for the advancement of integrated crop-livestock-tree uses
Research needs for the advancement of integrated crop-livestock-tree usesResearch needs for the advancement of integrated crop-livestock-tree uses
Research needs for the advancement of integrated crop-livestock-tree usesWorld Agroforestry (ICRAF)
 
Disaster Management and Local Knowledge
Disaster Management and Local KnowledgeDisaster Management and Local Knowledge
Disaster Management and Local KnowledgeSadia Razzaq
 
Riding perfect storm - TRIPLE STRENGTH PORTFOLIO Healthy, Sustainable Economi...
Riding perfect storm - TRIPLE STRENGTH PORTFOLIO Healthy, Sustainable Economi...Riding perfect storm - TRIPLE STRENGTH PORTFOLIO Healthy, Sustainable Economi...
Riding perfect storm - TRIPLE STRENGTH PORTFOLIO Healthy, Sustainable Economi...Michael P Totten
 
Adverse Environment and Pest Management for Sustainable Plant Production
Adverse Environment and Pest Management for Sustainable Plant ProductionAdverse Environment and Pest Management for Sustainable Plant Production
Adverse Environment and Pest Management for Sustainable Plant ProductionRahulGupta2015
 
GreenATP ucla anderson business school mp totten 06 11
GreenATP ucla anderson business school mp totten 06 11GreenATP ucla anderson business school mp totten 06 11
GreenATP ucla anderson business school mp totten 06 11Michael P Totten
 
Dissertation for Dr. Mike D'Gatlwakdit
Dissertation for Dr. Mike D'GatlwakditDissertation for Dr. Mike D'Gatlwakdit
Dissertation for Dr. Mike D'GatlwakditDeng Mike Gatluak
 
1066_Avoiding ecological constraints in wind energy_revised draft_final
1066_Avoiding ecological constraints in wind energy_revised draft_final1066_Avoiding ecological constraints in wind energy_revised draft_final
1066_Avoiding ecological constraints in wind energy_revised draft_finalgenevieve hayes
 
(Full Report) Water-Agriculture Nexus.pdf
(Full Report) Water-Agriculture Nexus.pdf(Full Report) Water-Agriculture Nexus.pdf
(Full Report) Water-Agriculture Nexus.pdfryotarot
 
session2-planetary boundaries.pdf
session2-planetary boundaries.pdfsession2-planetary boundaries.pdf
session2-planetary boundaries.pdfSHREYASHTIWARI29
 
Biophysical Foundations of Production and Consumption of Human Economy Source...
Biophysical Foundations of Production and Consumption of Human Economy Source...Biophysical Foundations of Production and Consumption of Human Economy Source...
Biophysical Foundations of Production and Consumption of Human Economy Source...ijtsrd
 
PNAS-2016-Lubchenco-1604982113
PNAS-2016-Lubchenco-1604982113PNAS-2016-Lubchenco-1604982113
PNAS-2016-Lubchenco-1604982113Jessica Reimer
 
Insect Modeling by Muhammad Qasim, Aroj Bashir
Insect Modeling by Muhammad Qasim, Aroj BashirInsect Modeling by Muhammad Qasim, Aroj Bashir
Insect Modeling by Muhammad Qasim, Aroj BashirMuhammad Qasim
 
10. ilri 9june2010
10. ilri 9june201010. ilri 9june2010
10. ilri 9june2010aagw2010
 
Strategies for managing climate risk: a case study of smallholder farmers in ...
Strategies for managing climate risk: a case study of smallholder farmers in ...Strategies for managing climate risk: a case study of smallholder farmers in ...
Strategies for managing climate risk: a case study of smallholder farmers in ...Premier Publishers
 

Similar to Improving Catfish Production By Utilizing Business Environment Remote Control Theory (20)

Research needs for the advancement of integrated crop-livestock-tree uses
Research needs for the advancement of integrated crop-livestock-tree usesResearch needs for the advancement of integrated crop-livestock-tree uses
Research needs for the advancement of integrated crop-livestock-tree uses
 
Disaster Management and Local Knowledge
Disaster Management and Local KnowledgeDisaster Management and Local Knowledge
Disaster Management and Local Knowledge
 
Can Australia's peanut value chains transform to adapt to future climates - P...
Can Australia's peanut value chains transform to adapt to future climates - P...Can Australia's peanut value chains transform to adapt to future climates - P...
Can Australia's peanut value chains transform to adapt to future climates - P...
 
Can Australia’s peanut value chains transform to adapt to future climates? - ...
Can Australia’s peanut value chains transform to adapt to future climates? - ...Can Australia’s peanut value chains transform to adapt to future climates? - ...
Can Australia’s peanut value chains transform to adapt to future climates? - ...
 
MEAS TN Scaling - Brent
MEAS TN Scaling - BrentMEAS TN Scaling - Brent
MEAS TN Scaling - Brent
 
Riding perfect storm - TRIPLE STRENGTH PORTFOLIO Healthy, Sustainable Economi...
Riding perfect storm - TRIPLE STRENGTH PORTFOLIO Healthy, Sustainable Economi...Riding perfect storm - TRIPLE STRENGTH PORTFOLIO Healthy, Sustainable Economi...
Riding perfect storm - TRIPLE STRENGTH PORTFOLIO Healthy, Sustainable Economi...
 
Day2_Plenary_Linxiu Zhang
Day2_Plenary_Linxiu ZhangDay2_Plenary_Linxiu Zhang
Day2_Plenary_Linxiu Zhang
 
Adverse Environment and Pest Management for Sustainable Plant Production
Adverse Environment and Pest Management for Sustainable Plant ProductionAdverse Environment and Pest Management for Sustainable Plant Production
Adverse Environment and Pest Management for Sustainable Plant Production
 
GreenATP ucla anderson business school mp totten 06 11
GreenATP ucla anderson business school mp totten 06 11GreenATP ucla anderson business school mp totten 06 11
GreenATP ucla anderson business school mp totten 06 11
 
Dissertation for Dr. Mike D'Gatlwakdit
Dissertation for Dr. Mike D'GatlwakditDissertation for Dr. Mike D'Gatlwakdit
Dissertation for Dr. Mike D'Gatlwakdit
 
1066_Avoiding ecological constraints in wind energy_revised draft_final
1066_Avoiding ecological constraints in wind energy_revised draft_final1066_Avoiding ecological constraints in wind energy_revised draft_final
1066_Avoiding ecological constraints in wind energy_revised draft_final
 
(Full Report) Water-Agriculture Nexus.pdf
(Full Report) Water-Agriculture Nexus.pdf(Full Report) Water-Agriculture Nexus.pdf
(Full Report) Water-Agriculture Nexus.pdf
 
session2-planetary boundaries.pdf
session2-planetary boundaries.pdfsession2-planetary boundaries.pdf
session2-planetary boundaries.pdf
 
Biophysical Foundations of Production and Consumption of Human Economy Source...
Biophysical Foundations of Production and Consumption of Human Economy Source...Biophysical Foundations of Production and Consumption of Human Economy Source...
Biophysical Foundations of Production and Consumption of Human Economy Source...
 
PNAS-2016-Lubchenco-1604982113
PNAS-2016-Lubchenco-1604982113PNAS-2016-Lubchenco-1604982113
PNAS-2016-Lubchenco-1604982113
 
Insect Modeling by Muhammad Qasim, Aroj Bashir
Insect Modeling by Muhammad Qasim, Aroj BashirInsect Modeling by Muhammad Qasim, Aroj Bashir
Insect Modeling by Muhammad Qasim, Aroj Bashir
 
E1 08-00-00
E1 08-00-00E1 08-00-00
E1 08-00-00
 
Toward a more inclusive interpretation of climate smart agriculture
Toward a more inclusive interpretation of climate smart agricultureToward a more inclusive interpretation of climate smart agriculture
Toward a more inclusive interpretation of climate smart agriculture
 
10. ilri 9june2010
10. ilri 9june201010. ilri 9june2010
10. ilri 9june2010
 
Strategies for managing climate risk: a case study of smallholder farmers in ...
Strategies for managing climate risk: a case study of smallholder farmers in ...Strategies for managing climate risk: a case study of smallholder farmers in ...
Strategies for managing climate risk: a case study of smallholder farmers in ...
 

More from Rochelle Schear

Descriptive Essay Argument Analysis Essay
Descriptive Essay Argument Analysis EssayDescriptive Essay Argument Analysis Essay
Descriptive Essay Argument Analysis EssayRochelle Schear
 
How To Write A 5 Paragraph Essay Dog
How To Write A 5 Paragraph Essay DogHow To Write A 5 Paragraph Essay Dog
How To Write A 5 Paragraph Essay DogRochelle Schear
 
How To Find Good Sources For A Research Paper - CI
How To Find Good Sources For A Research Paper - CIHow To Find Good Sources For A Research Paper - CI
How To Find Good Sources For A Research Paper - CIRochelle Schear
 
Making Connections Lab Report Answers
Making Connections Lab Report AnswersMaking Connections Lab Report Answers
Making Connections Lab Report AnswersRochelle Schear
 
How To Write A Research Paper 12 Steps (With Pictu
How To Write A Research Paper 12 Steps (With PictuHow To Write A Research Paper 12 Steps (With Pictu
How To Write A Research Paper 12 Steps (With PictuRochelle Schear
 
Debatable Topics For Persuasive Essays - DEBE
Debatable Topics For Persuasive Essays - DEBEDebatable Topics For Persuasive Essays - DEBE
Debatable Topics For Persuasive Essays - DEBERochelle Schear
 
Pay Someone To Write My Paper In 2021 Write My P
Pay Someone To Write My Paper In 2021 Write My PPay Someone To Write My Paper In 2021 Write My P
Pay Someone To Write My Paper In 2021 Write My PRochelle Schear
 
How To Write A Synthesis Essay Effective Tips And Tricks - How To ...
How To Write A Synthesis Essay Effective Tips And Tricks  - How To ...How To Write A Synthesis Essay Effective Tips And Tricks  - How To ...
How To Write A Synthesis Essay Effective Tips And Tricks - How To ...Rochelle Schear
 
Example Of An Hypothesis For
Example Of An Hypothesis ForExample Of An Hypothesis For
Example Of An Hypothesis ForRochelle Schear
 
9 Best Images Of Printable Journal Paper With Lines -
9 Best Images Of Printable Journal Paper With Lines -9 Best Images Of Printable Journal Paper With Lines -
9 Best Images Of Printable Journal Paper With Lines -Rochelle Schear
 
Writing A Descriptive Essay Help! Essay On
Writing A Descriptive Essay Help! Essay OnWriting A Descriptive Essay Help! Essay On
Writing A Descriptive Essay Help! Essay OnRochelle Schear
 
How To Write A Research Paper On Childhood Obesity
How To Write A Research Paper On Childhood ObesityHow To Write A Research Paper On Childhood Obesity
How To Write A Research Paper On Childhood ObesityRochelle Schear
 
Writing A Descriptive Essay About A Place
Writing A Descriptive Essay About A PlaceWriting A Descriptive Essay About A Place
Writing A Descriptive Essay About A PlaceRochelle Schear
 
Essay College Scholarships
Essay College ScholarshipsEssay College Scholarships
Essay College ScholarshipsRochelle Schear
 
Help Writing A College Essay
Help Writing A College EssayHelp Writing A College Essay
Help Writing A College EssayRochelle Schear
 
Things To Write A Persuasive Essay About
Things To Write A Persuasive Essay AboutThings To Write A Persuasive Essay About
Things To Write A Persuasive Essay AboutRochelle Schear
 
Persuasive Essay Writing Tips
Persuasive Essay Writing TipsPersuasive Essay Writing Tips
Persuasive Essay Writing TipsRochelle Schear
 
Help With Writing Research Papers
Help With Writing Research PapersHelp With Writing Research Papers
Help With Writing Research PapersRochelle Schear
 

More from Rochelle Schear (20)

Descriptive Essay Argument Analysis Essay
Descriptive Essay Argument Analysis EssayDescriptive Essay Argument Analysis Essay
Descriptive Essay Argument Analysis Essay
 
How To Write A 5 Paragraph Essay Dog
How To Write A 5 Paragraph Essay DogHow To Write A 5 Paragraph Essay Dog
How To Write A 5 Paragraph Essay Dog
 
How To Find Good Sources For A Research Paper - CI
How To Find Good Sources For A Research Paper - CIHow To Find Good Sources For A Research Paper - CI
How To Find Good Sources For A Research Paper - CI
 
Making Connections Lab Report Answers
Making Connections Lab Report AnswersMaking Connections Lab Report Answers
Making Connections Lab Report Answers
 
How To Write A Research Paper 12 Steps (With Pictu
How To Write A Research Paper 12 Steps (With PictuHow To Write A Research Paper 12 Steps (With Pictu
How To Write A Research Paper 12 Steps (With Pictu
 
Debatable Topics For Persuasive Essays - DEBE
Debatable Topics For Persuasive Essays - DEBEDebatable Topics For Persuasive Essays - DEBE
Debatable Topics For Persuasive Essays - DEBE
 
Pay Someone To Write My Paper In 2021 Write My P
Pay Someone To Write My Paper In 2021 Write My PPay Someone To Write My Paper In 2021 Write My P
Pay Someone To Write My Paper In 2021 Write My P
 
How To Write A Synthesis Essay Effective Tips And Tricks - How To ...
How To Write A Synthesis Essay Effective Tips And Tricks  - How To ...How To Write A Synthesis Essay Effective Tips And Tricks  - How To ...
How To Write A Synthesis Essay Effective Tips And Tricks - How To ...
 
Example Of An Hypothesis For
Example Of An Hypothesis ForExample Of An Hypothesis For
Example Of An Hypothesis For
 
9 Best Images Of Printable Journal Paper With Lines -
9 Best Images Of Printable Journal Paper With Lines -9 Best Images Of Printable Journal Paper With Lines -
9 Best Images Of Printable Journal Paper With Lines -
 
Writing A Descriptive Essay Help! Essay On
Writing A Descriptive Essay Help! Essay OnWriting A Descriptive Essay Help! Essay On
Writing A Descriptive Essay Help! Essay On
 
How To Write A Research Paper On Childhood Obesity
How To Write A Research Paper On Childhood ObesityHow To Write A Research Paper On Childhood Obesity
How To Write A Research Paper On Childhood Obesity
 
Writing A Descriptive Essay About A Place
Writing A Descriptive Essay About A PlaceWriting A Descriptive Essay About A Place
Writing A Descriptive Essay About A Place
 
Essay College Scholarships
Essay College ScholarshipsEssay College Scholarships
Essay College Scholarships
 
Help Writing A College Essay
Help Writing A College EssayHelp Writing A College Essay
Help Writing A College Essay
 
Things To Write A Persuasive Essay About
Things To Write A Persuasive Essay AboutThings To Write A Persuasive Essay About
Things To Write A Persuasive Essay About
 
Persuasive Essay Writing Tips
Persuasive Essay Writing TipsPersuasive Essay Writing Tips
Persuasive Essay Writing Tips
 
Help With Writing Research Papers
Help With Writing Research PapersHelp With Writing Research Papers
Help With Writing Research Papers
 
Essay Writing Styles
Essay Writing StylesEssay Writing Styles
Essay Writing Styles
 
Write A Position Paper
Write A Position PaperWrite A Position Paper
Write A Position Paper
 

Recently uploaded

Z Score,T Score, Percential Rank and Box Plot Graph
Z Score,T Score, Percential Rank and Box Plot GraphZ Score,T Score, Percential Rank and Box Plot Graph
Z Score,T Score, Percential Rank and Box Plot GraphThiyagu K
 
Accessible design: Minimum effort, maximum impact
Accessible design: Minimum effort, maximum impactAccessible design: Minimum effort, maximum impact
Accessible design: Minimum effort, maximum impactdawncurless
 
Presentation by Andreas Schleicher Tackling the School Absenteeism Crisis 30 ...
Presentation by Andreas Schleicher Tackling the School Absenteeism Crisis 30 ...Presentation by Andreas Schleicher Tackling the School Absenteeism Crisis 30 ...
Presentation by Andreas Schleicher Tackling the School Absenteeism Crisis 30 ...EduSkills OECD
 
Introduction to Nonprofit Accounting: The Basics
Introduction to Nonprofit Accounting: The BasicsIntroduction to Nonprofit Accounting: The Basics
Introduction to Nonprofit Accounting: The BasicsTechSoup
 
Measures of Central Tendency: Mean, Median and Mode
Measures of Central Tendency: Mean, Median and ModeMeasures of Central Tendency: Mean, Median and Mode
Measures of Central Tendency: Mean, Median and ModeThiyagu K
 
Nutritional Needs Presentation - HLTH 104
Nutritional Needs Presentation - HLTH 104Nutritional Needs Presentation - HLTH 104
Nutritional Needs Presentation - HLTH 104misteraugie
 
Beyond the EU: DORA and NIS 2 Directive's Global Impact
Beyond the EU: DORA and NIS 2 Directive's Global ImpactBeyond the EU: DORA and NIS 2 Directive's Global Impact
Beyond the EU: DORA and NIS 2 Directive's Global ImpactPECB
 
Sports & Fitness Value Added Course FY..
Sports & Fitness Value Added Course FY..Sports & Fitness Value Added Course FY..
Sports & Fitness Value Added Course FY..Disha Kariya
 
The basics of sentences session 2pptx copy.pptx
The basics of sentences session 2pptx copy.pptxThe basics of sentences session 2pptx copy.pptx
The basics of sentences session 2pptx copy.pptxheathfieldcps1
 
Mastering the Unannounced Regulatory Inspection
Mastering the Unannounced Regulatory InspectionMastering the Unannounced Regulatory Inspection
Mastering the Unannounced Regulatory InspectionSafetyChain Software
 
Measures of Dispersion and Variability: Range, QD, AD and SD
Measures of Dispersion and Variability: Range, QD, AD and SDMeasures of Dispersion and Variability: Range, QD, AD and SD
Measures of Dispersion and Variability: Range, QD, AD and SDThiyagu K
 
BAG TECHNIQUE Bag technique-a tool making use of public health bag through wh...
BAG TECHNIQUE Bag technique-a tool making use of public health bag through wh...BAG TECHNIQUE Bag technique-a tool making use of public health bag through wh...
BAG TECHNIQUE Bag technique-a tool making use of public health bag through wh...Sapna Thakur
 
APM Welcome, APM North West Network Conference, Synergies Across Sectors
APM Welcome, APM North West Network Conference, Synergies Across SectorsAPM Welcome, APM North West Network Conference, Synergies Across Sectors
APM Welcome, APM North West Network Conference, Synergies Across SectorsAssociation for Project Management
 
1029-Danh muc Sach Giao Khoa khoi 6.pdf
1029-Danh muc Sach Giao Khoa khoi  6.pdf1029-Danh muc Sach Giao Khoa khoi  6.pdf
1029-Danh muc Sach Giao Khoa khoi 6.pdfQucHHunhnh
 
SOCIAL AND HISTORICAL CONTEXT - LFTVD.pptx
SOCIAL AND HISTORICAL CONTEXT - LFTVD.pptxSOCIAL AND HISTORICAL CONTEXT - LFTVD.pptx
SOCIAL AND HISTORICAL CONTEXT - LFTVD.pptxiammrhaywood
 
Software Engineering Methodologies (overview)
Software Engineering Methodologies (overview)Software Engineering Methodologies (overview)
Software Engineering Methodologies (overview)eniolaolutunde
 
Arihant handbook biology for class 11 .pdf
Arihant handbook biology for class 11 .pdfArihant handbook biology for class 11 .pdf
Arihant handbook biology for class 11 .pdfchloefrazer622
 

Recently uploaded (20)

Z Score,T Score, Percential Rank and Box Plot Graph
Z Score,T Score, Percential Rank and Box Plot GraphZ Score,T Score, Percential Rank and Box Plot Graph
Z Score,T Score, Percential Rank and Box Plot Graph
 
Accessible design: Minimum effort, maximum impact
Accessible design: Minimum effort, maximum impactAccessible design: Minimum effort, maximum impact
Accessible design: Minimum effort, maximum impact
 
Presentation by Andreas Schleicher Tackling the School Absenteeism Crisis 30 ...
Presentation by Andreas Schleicher Tackling the School Absenteeism Crisis 30 ...Presentation by Andreas Schleicher Tackling the School Absenteeism Crisis 30 ...
Presentation by Andreas Schleicher Tackling the School Absenteeism Crisis 30 ...
 
INDIA QUIZ 2024 RLAC DELHI UNIVERSITY.pptx
INDIA QUIZ 2024 RLAC DELHI UNIVERSITY.pptxINDIA QUIZ 2024 RLAC DELHI UNIVERSITY.pptx
INDIA QUIZ 2024 RLAC DELHI UNIVERSITY.pptx
 
Introduction to Nonprofit Accounting: The Basics
Introduction to Nonprofit Accounting: The BasicsIntroduction to Nonprofit Accounting: The Basics
Introduction to Nonprofit Accounting: The Basics
 
Measures of Central Tendency: Mean, Median and Mode
Measures of Central Tendency: Mean, Median and ModeMeasures of Central Tendency: Mean, Median and Mode
Measures of Central Tendency: Mean, Median and Mode
 
Nutritional Needs Presentation - HLTH 104
Nutritional Needs Presentation - HLTH 104Nutritional Needs Presentation - HLTH 104
Nutritional Needs Presentation - HLTH 104
 
Beyond the EU: DORA and NIS 2 Directive's Global Impact
Beyond the EU: DORA and NIS 2 Directive's Global ImpactBeyond the EU: DORA and NIS 2 Directive's Global Impact
Beyond the EU: DORA and NIS 2 Directive's Global Impact
 
Sports & Fitness Value Added Course FY..
Sports & Fitness Value Added Course FY..Sports & Fitness Value Added Course FY..
Sports & Fitness Value Added Course FY..
 
The basics of sentences session 2pptx copy.pptx
The basics of sentences session 2pptx copy.pptxThe basics of sentences session 2pptx copy.pptx
The basics of sentences session 2pptx copy.pptx
 
Mattingly "AI & Prompt Design: The Basics of Prompt Design"
Mattingly "AI & Prompt Design: The Basics of Prompt Design"Mattingly "AI & Prompt Design: The Basics of Prompt Design"
Mattingly "AI & Prompt Design: The Basics of Prompt Design"
 
Mastering the Unannounced Regulatory Inspection
Mastering the Unannounced Regulatory InspectionMastering the Unannounced Regulatory Inspection
Mastering the Unannounced Regulatory Inspection
 
Measures of Dispersion and Variability: Range, QD, AD and SD
Measures of Dispersion and Variability: Range, QD, AD and SDMeasures of Dispersion and Variability: Range, QD, AD and SD
Measures of Dispersion and Variability: Range, QD, AD and SD
 
BAG TECHNIQUE Bag technique-a tool making use of public health bag through wh...
BAG TECHNIQUE Bag technique-a tool making use of public health bag through wh...BAG TECHNIQUE Bag technique-a tool making use of public health bag through wh...
BAG TECHNIQUE Bag technique-a tool making use of public health bag through wh...
 
APM Welcome, APM North West Network Conference, Synergies Across Sectors
APM Welcome, APM North West Network Conference, Synergies Across SectorsAPM Welcome, APM North West Network Conference, Synergies Across Sectors
APM Welcome, APM North West Network Conference, Synergies Across Sectors
 
1029-Danh muc Sach Giao Khoa khoi 6.pdf
1029-Danh muc Sach Giao Khoa khoi  6.pdf1029-Danh muc Sach Giao Khoa khoi  6.pdf
1029-Danh muc Sach Giao Khoa khoi 6.pdf
 
SOCIAL AND HISTORICAL CONTEXT - LFTVD.pptx
SOCIAL AND HISTORICAL CONTEXT - LFTVD.pptxSOCIAL AND HISTORICAL CONTEXT - LFTVD.pptx
SOCIAL AND HISTORICAL CONTEXT - LFTVD.pptx
 
Software Engineering Methodologies (overview)
Software Engineering Methodologies (overview)Software Engineering Methodologies (overview)
Software Engineering Methodologies (overview)
 
Código Creativo y Arte de Software | Unidad 1
Código Creativo y Arte de Software | Unidad 1Código Creativo y Arte de Software | Unidad 1
Código Creativo y Arte de Software | Unidad 1
 
Arihant handbook biology for class 11 .pdf
Arihant handbook biology for class 11 .pdfArihant handbook biology for class 11 .pdf
Arihant handbook biology for class 11 .pdf
 

Improving Catfish Production By Utilizing Business Environment Remote Control Theory

  • 1. Impro Enviro Ogidi, Departm Michael O Email: ar © 2016. O Noncomme distribution Inter Volume 1 Type: Do Host: Afr Journal S Publisher Abstract theory on State is n However, data, wa environm the mana disrupt p enterpris agribusin environm as a rem business influence decreasin Manager business control o academic economic Key wor oving onment , Armstr ment of Agrib Okpara Univ rmstrongogid gidi, A.E. This rcial 3.0 Unpor , and reproduct rnation 11, Issue 1, p uble Blind P rica Research Series: Acade r: Internatio t – The objec n catfish prod not more tha r, a general (f as adopted. mental perturb ager, but lon production in es were able ness environm ment remote c ote, complex environment ed by the man ng return to rs should ens environment over the input cs and mana c, natural, sup rds: Business Catfish t Remo ong Emm business & M versity of Ag di@gmail.co is a research/re rted License htt ion in any mediu nal Jour pages 12‐25, Peer Reviewe h Corps (ww emic Scholar nal Academ ctive of this s duction in Be an 198, the st (full specifica The catfish bation. Howe ng term scar n stage 2, ca to remotely c ment. Thus, control” as ob x entity that c t. The study nager, but ad scale is rem sure that bus t perturbation ts resources w gers to ident ppliers, etc, th environment, Produ te Cont manuel Management griculture, Um om | Phone: eview paper, d tp://creativecom um, provided th rnal of , February, 2 ed Internatio ww.africarese rs Publishing ic Journal fo study is to ex enue State, N tudy deemed ation) stochas h farms wer ever, immedia rcity of inputs an be remot control the bu the pheno bserved by th can be cajole concluded th dditional chan motely contro iness maneuv ns arising fro within the ca tify other env hat could pos t, catfish prod uction trol The (PhD St t mudike, P.M 0803622867 istributed unde mmons.org/licen e original work i f Schola 2016 onal Researc earchcorps.c g League (AS or Global Res xamine the im igeria. Since d it adequate stic frontier p re able to c ate control of s within the tely controlle usiness enviro menon gave his study. This d so as to red hat immedia nge in the leve olled by the vers and dec om the busine atfish busines vironmental f se serious thre duction, imme by U eory udent) M.B. 7267, Um 71; 0705724 er the terms of nses/by‐nc/3.0/) is properly cited arly Re ch Journal com) SPL) search (iajgr mportance of the populatio e to use the p production fu cushion their f the resourc business env ed. The study onment by str e rise to a s term person duce the full ate control of el of inputs, w business env cisions should ess environm s environmen factors such eats. ediate control tilizing muahia, Abi 40174 f the Creative C , permitting all d. esearch r) Publishing f business env on of catfish population as unction for th r catfish en ces can easily vironment, w y found out rategizing an situation t nifies the busi wrath of the f the resourc which will sub vironment. C d be taken to ent. In order nt, efforts sho as governme l, remote con Busin a State, Nige Commons Attrib non‐commerci h (USA) vironment co farmers in B s the sample he cross‐sect terprises ag y be influence which could e that the ca d adjusting to termed “bus iness environm e threats from ces can easil bsequently lea Catfish Produ o mimic or re to have effe ould be mad ent/political/l ntrol ess eria | bution‐ al use, ontrol enue size. ional ainst ed by easily atfish o the iness ment m the ly be ad to ction educe ective de by legal,
  • 2. Im Michael Abstract: theory on State is n However, data, wa environm manager, productio able to re environm control” a entity tha The study but additi remotely business perturbat resources to identify etc, that c Keywords 1. Intro The Bus accommo internal external analysis determin (Ottih, 2 and activ the ente mproving Cat Improv E Okpara Univ Email: ar The objectiv n catfish prod not more tha a general (f as adopted. ental perturb but long ter on in stage 2, emotely cont ent. Thus, th as observed b at can be cajo y concluded t ional change controlled b maneuvers tions arising f within the ca y other enviro could pose se s: Business en duction siness envir odates both environmen environmen (Ogidi, 201 ning the suc 006). Busine vities of catf rprise (Ogidi tfish Productio aspljo ving Catf Environm Ogidi, A Depart versity of Ag mstrongogid ve of this stu duction in Be n 198, the st (full specifica The catfish bation. Howev rm scarcity of can be remo trol the busin he phenomen by this study. oled so as to that immedia in the level o by the busine and decision from the bus atfish busines onmental fac rious threats. nvironment, c ronment of h the intern nt presents nt presents e 16). This im ccess, failure ess environm fish enterpr i, 2016). How In on by Utilizin ournals@afr fish Prod ment Re rmstrong E tment of Ag griculture, Um di@gmail.co udy is to exa nue State, N tudy deemed tion) stochas farms wer ver, immediat of inputs with otely controlle ness environm non gave rise This term pe reduce the f ate control of of inputs, whi ess environm ns should b iness environ ss environme ctors such as . catfish produc f agribusine nal and ext enterprise environment mplies that e and even ment is seen ise producti wever, the e nternationa ng Business E ricaresearch duction b emote Co Emmanuel ribusiness & mudike, P.M om | Phone: amine the im Nigeria. Since d it adequate stic frontier p re able to te control of t hin the busine ed. The study ment by stra e to a situat rsonifies the full wrath of f the resource ich will subse ment. Catfish be taken to nment. In ord ent, efforts sh government/ ction, immedi ess from t ternal comp strengths a tal opportun the environ continued n to contain on units – a environment l Journal of S Volume 11, Environment R hcorps.com by Utiliz ontrol T l (PhD Stud & Manageme M.B. 7267, Um 0803622867 mportance of the populati e to use the p production fu cushion thei the resources ess environm y found out th ategizing and tion termed business envi the threats fr es can easily quently lead Production mimic or der to have ef hould be mad /political/lega iate control, r he broader ponents (Og and enterpr nities and en nment facto existence o n factors tha also referred t of agribusi Scholarly Re Issue 1, (Feb ww Remote Cont zing Busi Theory dent) ent muahia, Abi 71; 0705724 f business en ion of catfish population a unction for t ir catfish en s can easily be ment, which co hat the catfish d adjusting to “business en ironment as a from the busi be influenced to decreasing Managers sh reduce busin ffective contr de by academ al, economic, remote contro r, all inclus gidi and Um rises weakn nvironmenta or plays a of the busin at influence d to as the t ness can be esearch (ASP bruary, 2016 ww.africares trol Theory 12 | P iness a State, Nige 40174 vironment co farmers in B s the sample the cross‐sec nterprises ag e influenced b ould easily di h enterprises o the agribus vironment re a remote, com iness environm d by the man g return to sc hould ensure ness environ rol over the i mics and man natural, supp ol sive perspe meh, 2015). esses; while l threats – S decisive ro ness organiz e policy deci technical co defined as t PL Journal Se 6) pages 12 searchcorps. a g e eria | ontrol Benue e size. tional gainst by the isrupt were siness emote mplex ment. nager, cale is e that nment inputs nagers pliers, ective . The e the SWOT ole in ation sions ore of those ries) – 25 com
  • 3. Improving Catfish Production by Utilizing Business Environment Remote Control Theory aspljournals@africaresearchcorps.com 13 | P a g e factors, institutions and infrastructures that exist outside the agribusiness firm that affects decisions, objectives and activities of the business (Ogidi, 2016). Under the business environment concept, three forces that constitute threat or opportunity to the catfish enterprise were examined in this study. These forces are: physical, social and institutional factors. 2. Theoretical Framework 2.1. Business environment complexity theory Complexity theory offers a conceptual framework that incorporates the essential unpredictability of economic and environmental systems with the emergence of distinctive and contingently stable patterns (Ormerod, 1998; Anderson, 1999). Complexity was originally developed through advances in non‐linear mathematics (Thom, 1975), thermodynamics (Prigogine and Glansdorf, 1971), and computational sciences (Simon, 1962). These ideas were quickly adapted to social systems (Ulrich and Probtst, 1984) and during the 1990s interest exploded in relation to management and organizations (Ashmos and Huber, 1987; Levy, 1994; Merry, 1995). Complexity theory goes beyond systems perspectives through advances in deterministic chaos theory (Lorenz, 1963; Kiel and Elliott, 1996), power‐law phenomena (Andriani and McKelvey, 2009) and computational methodologies (Kauff man, 1993; Davis, Eisenhardt and Bingham, 2007). Complexity theory recognizes that economic and environmental systems comprise a multitude of agents, from individuals to large organizations, with distinctive properties at each level. The economy, for example, comprises individual consumers and workers, firms, markets, industries, and national economies. While all these levels are interdependent, higher‐level aggregations exhibit “emergent” properties that cannot easily be reduced to the interaction of lower levels (Holland, 1998). Macroeconomics, for example, relies on constructs and theories that differ from those relating to individual firms and consumers. Understanding business environment complexity has been a long‐standing concern of organization theory (Simon, 1962). It offers insights into the emergence of patterned structure and order in higher‐level systems, such as the Earth’s climate, economic organizations and social institutions, but also provides methods for finding fundamental relationships and simplicity behind complex phenomena. Complexity helps explain how systems can evolve in unexpected ways, exhibiting dramatic instability (Rudolph and Repenning, 2002) and even collapse (McKelvey, 1999). The weather, the global climate, and the economy are complex systems that exhibit such chaotic behavior (Brock, Hsieh and LeBaron, 1991). 2.2. Chaos theory This is a core science of complexity. It explores systems in which the recursive application of non‐linear functions gives rise to highly complex yet patterned behavior. Chaotic systems have several notable characteristics. First, they are unpredictable in the longer term, even though they are driven by deterministic rules. Weather conditions, for example, evolve due to well‐ understood interactions among variables such as humidity, air pressure, and temperature; however, the non‐linear nature of these interactions makes it impossible to predict the long‐ term evolution of the weather system. The trajectory of chaotic systems such as these is highly
  • 4. Improving Catfish Production by Utilizing Business Environment Remote Control Theory aspljournals@africaresearchcorps.com 14 | P a g e dependent on initial starting conditions: the proverbial butterfly could theoretically cause perturbations that are amplified through successive interactions and reverberate throughout the entire weather system. An important corollary is that, although chaotic systems never return to the same precise state, the outcomes have predictable boundaries that generate well‐known patterns (Dooley and Van De Ven, 1999). Hurricanes emerge in late summer, though we never know their exact timing, path, or strength. Industries exhibit typical patterns of growth and maturity, yet evolve in unpredictable ways. These patterns are shaped by “strange attractors,” structural features of systems that constrain and mold their evolution. The patterns reflect macro‐level emergent properties: hurricanes, economic recessions, and social movements exhibit system‐ wide patterns that are distinct from the properties of the components from which these systems emerge. Another important feature of complex systems is that change can be endogenous; under certain conditions interactions can cascade into system transformation (Cheng and Van De Ven, 1996). Similarly, a stock market collapse can be caused by positive feedback mechanisms affecting investor confidence, liquidity constraints, and computer driven trading. Moreover, systems do not necessarily recover their original pattern after a collapse; rather, they can shit to a new pattern around a different attractor. The economy can become mired in a self‐perpetuating depression, and the climate can become locked in an ice age. Crucially, these critical thresholds are hard to predict. Some relatively large perturbations might peter out while smaller ones can propagate into larger‐ scale shit s. Despite this unpredictability, however, the pattern of sudden shits, from earthquakes to stock market crashes, tends to follow a power law (Andriani and McKelvey, 2009), such that the frequency of large‐scale events is inversely related to their magnitude. These features of chaotic systems provide an important basis for understanding the links between the economy and the environment. 2.3. A theory of change in turbulent environments Within the resource‐based view, resources are the basic units of analysis. A firm’s resources are often classified as financial, human, intangible, organizational, physical, and technological (Bogner, Mahoney and Thomas, 1998). Resources are the stocks of available productive factors owned or controlled by the firm (Madhok, 1996). Often what makes resources economically valuable is the way in which these resources are deployed and developed (Kor and Leblebici, 2005). For resources to be utilized in production and to provide a firm’s distinctive productive services (Penrose, 1959), certain organizational processes must be developed. Capabilities represent the organizational processes by which resources are assimilated and productively deployed. These information‐based organizational processes tend to be firm specific and are developed over substantial time periods through complex interactions among the firm’s resources (Amit and Schoemaker, 1993). Capabilities are high‐level routines that provide an organization’s management a set of decision options for producing an array of outputs (Nelson and Winter, 1982). They are also typically substantial in scale, representing a large number of activities that produce outputs that increase the likelihood of the firm’s survival and prosperity (Winter, 2000). Further, dynamic capabilities involve the organizational processes by which
  • 5. Improving Catfish Production by Utilizing Business Environment Remote Control Theory aspljournals@africaresearchcorps.com 15 | P a g e resources are utilized to create growth and adaptation within changing environments (Eisenhardt and Martin, 2000; Lado, Boyd, Wright and Kroll, 2006; Teece, Pisano and Shuen, 1997). Dynamic capabilities pertain to the organization’s competencies to integrate, build, and reconfigure resource positions in rapidly changing environments. They also reflect organizational competencies to achieve new and innovative forms of competitive advantage despite constraints of path dependencies and previous market positions (Arthur, 1994; Gruca and Nath, 1994; Leonard‐Barton, 1992). Dynamic capabilities result from complicated organizational and strategic routines (Zollo and Winter, 2002) through which managers reconfigure and renew a firm’s resource base to generate economically value‐creating strategies (Foss, 1996; Pisano, 1994). Thus, these capabilities are the fundamental drivers of the creation, evolution, and recombination of other resources to provide new sources of growth (Henderson, 1994; Henderson and Cockburn, 1994; Zander and Kogut, 1995). Dynamic capabilities evolve in important ways that we have only begun to explain. Following Helfat and Peteraf (2003), the current paper’s analysis describes the pattern of capability development using the resource‐based view (Penrose, 1959; Wernerfelt, 1984) and the dynamic capabilities approach (Eisenhardt and Martin, 2000; Teece, Pisano, and Shuen, 1997). 2.4. Contingency theory According to contingency theory, the characteristics of the environment affect an organization’s ability to obtain resources (Burns and Stalker, 1961). Managers must allow an organization’s department to organize and control their activities in ways most likely to allow them obtain resources; given the constraints of the particular environment they face (Lawrence and Lorsch, 1969). 2.5. Production theory The unit of analysis is the firm. This firm attempts to maximize output with given cost outlay and given quantum of resources; the production function is a mathematical method for the description of relationship between resources and output which is the basis for theory of production (Umeh et al. 2013). Implicitly we express it as follows: Y=f(X1, X2…Xn). Within the firm, there are three basic physical relationships that form the basis for theory of production; these are: 1) factor‐product relationship, 2) factor‐factor relationship and 3) product‐product relationship. However, this study is a factor‐product relationship study. 3. Methodology 3.1. Population and Sampling Procedure The sampled population of the study is basically of catfish farmers in Benue State. A first attempt at a comprehensive, nationwide inventory of inland water resources was made by the Aquaculture and Inland Fisheries Project (AIFP) of the National Special Program for Food Security (NSPFS). According to this inventory, Benue State has 198 Catfish farms – the highest compared to other Northern States in Nigeria (FAO, 2007). Since the population of catfish farmers in Benue State is not more than 198, the study deemed it adequate to use the population as the sample size. Therefore, the sample size for this study remains 198 catfish farmers. The list of catfish farmers in Benue State obtained from FAO (2007) and Benue State Ministry of Agriculture was distributed across the zones as follows: 36 catfish farmers from
  • 6. Improving Catfish Production by Utilizing Business Environment Remote Control Theory aspljournals@africaresearchcorps.com 16 | P a g e Zone A, 119 catfish farmers from Zone B, and 43 catfish farmers from Zone C. 3.2. Data Collection Techniques Primary data were utilized in this study, through the use of structured questionnaire. The primary data used in this study come from a questionnaire survey of 198 catfish producers in Benue State for the production year 2013/2014. The questionnaire set was carefully structured by taking into consideration factors critical to the quality of instrument developed. Secondary data from literature (FAO, 2007) were used to determine the population size for this study. 3.3. Data Analytical Techniques The stochastic frontier model was originally proposed for the analysis of the panel data by Battese and Coelli (1995). However, a general (full specification) stochastic frontier production function for the cross‐sectional data, which is considered in this paper, is defined by Where: = denotes the output for the ith sample farm (kg) = represents a vector whose values are functions of inputs and other explanatory variables for the ith farm = is a vector of unknown parameters to be estimated are assumed to be independent and identically distributed random s = are assumed to be independent and identically distributed random errors which have normal distribution with mean zero and unknown variance and s = are non‐negative unobservable random variables associated with the technical inefficiency of production, such that for a given technology and levels of inputs, the observed output falls short of its potential. Technical inefficiency effect model proposed by Battese and Coelli (1995) is described by Where: = is a vector of explanatory variables associated with the technical inefficiency effects of the tth farmer = is an vector of unknown parameters to be estimated Battese and Coelli (1988) considered the maximum likelihood estimator which involves specification of the distribution of Vi and Ui. The random variables Vi and Ui are assumed to be mutually independent and independent of the input variables in the model. If Ui = 0, the assumed distribution is half‐normal. Where outputs are expressed in logarithms, the technical efficiency of the ith farm is estimated as a ratio of the observed to maximum feasible output, where the latter is provided by the stochastic frontier production. The measure of technical efficiency is given by
  • 7. Improving Catfish Production by Utilizing Business Environment Remote Control Theory aspljournals@africaresearchcorps.com 17 | P a g e / If Ui = 0, the farm were 100 percent efficient. Maximum‐likelihood estimates of the parameters in the model were obtained. The parametric model is estimated in terms of the variance parameters, and / (Umeh et al. 2013). In case of cross‐sectional data, the technical inefficiency model can only be estimated if the inefficiency effects Ui’s are stochastic and have particular distributional properties (Battese and Coelli, 1995). Therefore it is of interest to test the null hypotheses that technical inefficiency effects, , are non‐ stochastic. The parameter, , has a value between zero and one, in such a way that it is desirable to test the null hypothesis of Ho: = 0 whether traditional production function is an adequate representation of the sample data. If so, the non‐negative random variable is absent from the model. The generalized likelihood‐ratio test statistic can be calculated from the logarithms of the likelihood function associated with the unrestricted and restricted maximum likelihood estimates for the special case in which the appropriate parameter is zero. The structure of the General Model is imbedded in the equation linking catfish output to resources (inputs) on one hand (Model 1) and inefficiency model (Model 2) on the other. In the inefficiency model, inefficiency effect is linked with the business environment. Business environment factors are captured, through variables that influence the welfare or performance of the catfish production in the study area. This study will focus on the following business environment factors, i.e. physical, social and institutional factors. ∑ ………………………………………………………………………………................. (Model 1) Where: Log or ln = natural logarithm; I = sample of catfish enterprises j = number of inputs and farm‐specific variables Y = represents yield of the catfish enterprises in kg = fingerlings used in production (kg); a priori expectation is positive = quantity of standard feeds used (kg); a priori expectation is positive = labor requirements (man‐days); a priori expectation is positive = pond size of fish enterprise (m2 ); a priori expectation is positive s = parameters of linear terms; j = 0, 1... 4 are parameters to be estimated = Log of estimated values of inputs, output and error term s = statistical errors and random shocks such as faulty equipments, low quality fish feed, errors in measurement; are assumed to be independent and identically distributed N (0, ) random variables
  • 8. Improving Catfish Production by Utilizing Business Environment Remote Control Theory aspljournals@africaresearchcorps.com 18 | P a g e s = error term measuring the level of inefficiency in production; are assumed to be independent and identically distributed non‐negative truncations of the N (, ) distribution. The inefficiency model for the study is shown below; ∑ ⋯ ………………… (Model 2) Where: = inefficiency effect = Explanatory variables for the technical inefficiency effects for the ith farmer, s = parameters of demographic and environment of business variables = Accessible roads to production unit [AROADS] (Dummy: accessible roads to production unit =1, bad roads to production unit=0); a priori expectation is positive = Cost of energy [COSTPF] (N); a priori expectation is negative = Cost of water storage [COSTSF] (N); a priori expectation is negative = Number of years spent acquiring formal education [EDUCAT] (yrs); a priori expectation is negative = Years of experience in catfish production business [EXPERI] (yrs); a priori expectation is negative = Collaboration with model catfish farmers [COLLABO] (Dummy: access to consultants/vets=1, No access to consultants/vets=0); a priori expectation is positive = Credit obtained from financial institutions [CREDIT] (N); a priori expectation is negative = Cost of innovation/technology in fish production from research institutions [COSTIN] (N); a priori expectation is negative = Availability of market intermediaries for catfish output [AVLMKT] (Dummy: access to market institution/intermediaries = 1, scarce markets = 0); a priori expectation is positive The generalized likelihood ratio statistic is computed as  2 / , where, and are the likelihood functions evaluated at the restricted and unrestricted maximum likelihood estimator for the parameters. If the null hypothesis, , is true, then the statistics has approximately a chi‐squared distribution with parameter equal to the number of restriction imposed by and with the degree of freedom equal to the difference between the parameter estimated under and respectively. The value of the γ indicates the relative magnitude of the variance associated, with the distribution of inefficiency effects, . If in the stochastic frontier are not present or alternatively, if the variance parameter, γ, associated with the distribution of, , has zero value, then, , in (model1) – (model 2) is zero and the model reduces to a traditional function with the variables, fingerlings, feeds, labor and pond size, all included in the production function meaning that inefficiency effects are not stochastic. 4. Results and Discussion 4.1. The Return to Scale The Return to Scale (RTS) from the general model consisting of both Cobb‐Douglass Stochastic
  • 9. Improving Catfish Production by Utilizing Business Environment Remote Control Theory aspljournals@africaresearchcorps.com 19 | P a g e Production Frontier model and the inefficiency model is 0.9797, on the catfish enterprise. This was largely influenced by inefficiency effects from the business environment. Comparing this with the three restricted models (see Table 1, Columns 3, 4 and 5), the RTS values are: 1.0669, 0.9877 and 1.0692. The RTS attained in the pooled data and the Social effects model shows that the catfish farms were producing at stage 2 of the production function also known as the decreasing returns to scale stage (rational stage). Table 2 shows that fingerlings, feeds, labor and pond size are operating in stage 2, i.e. they are increasing at a decreasing rate and are operating in the rational stage of production. This study’s result is in tandem with the findings of Ogundari, Ojo and Brummer (2005) in a study of aquaculture in Oyo State with RTS of 0.841. This current study’s RTS (0.9797) is also in accordance with the RTS (0.664) of Emokaro and Ekunwe (2009). Table 1: Elasticities of Production Frontier and Returns to Scale (RTS) Output Elasticities of the Frontier Variables General Model Physical Effects Only Social Effects Only Institutional Effects Only FING (kg/m2 ) 0.171 0.220 0.176 0.236 FEED (kg/m2 ) 0.0534 0.0571 0.0626 0.0636 LABO (man days/m2 ) 0.0353 0.0258 0.0361 0.0236 POSI (m2 ) 0.720 0.764 0.713 0.746 Returns to Scale (RTS) 0.9797 1.0669 0.9877 1.0692 Note: RTS for the following studies are as follows: Emokaro and Ekunme (2009) is 0.664 and Ogundari, Ojo and Brummer (2005) is 0.841 The frontier result has helped to identify the technical efficiency implications arising from the effect of business environment on catfish production in Benue State, Nigeria. The study would explain the business maneuvers and decisions taken by the catfish producer to mimic or reduce business environment perturbations arising from the business environment. 4.2. Business Environment Remote Control Theory The physical effects only model, the institutional effects only model, social and institutional
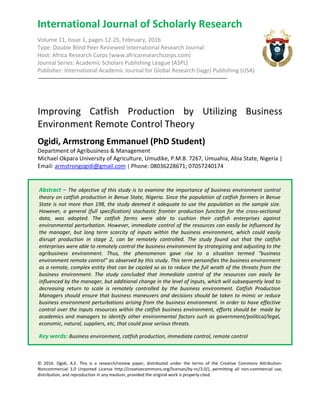
  • 10. Improving Catfish Production by Utilizing Business Environment Remote Control Theory aspljournals@africaresearchcorps.com 20 | P a g e combinations model, physical and institutional combinations model are operating in stage 1 of the production function also known as the increasing returns stage which is also the irrational stage. In theory, this stage is perceived to under utilize input resources. Note: S = Social Factors, P = Physical Factors, I = Institutional Factors, RTS = Return to Scale, Es = Environments, Ep = Elasticities of Production Figure 1: Business Environment Remote Control Effect on Return to Scale (RTS) The restricted state (that is, social effects only), the combination of physical and social effects model and the entire business environment variables are operating in stage 2 (rational stage) of the production function which is the state of decreasing returns (see Figure 1 above). In practice, the catfish producers in our study area are operating in stage 2 – the rational stage. This is because, the farmers were able to identify business environment variable items and Ep = 0 Ep > 1 Ep = 1 Ep < 0 DRAMATIC INSTABILITY REMOTE CONTROL EFFECT Social E RTS = 0.9877 S & I E – RTS = 1.0035 P & S E – RTS = 0.9835 Business E RTS = 0.9797 P & I E – RTS = 1.0459 Physical E RTS = 1.0669 Institutional E RTS = 1.0692 INCREASING RETURNS STAGE 1 (IRRATIONAL) DECREASING NEGATIVE RETURNS STAGE 3 (IRRATIONAL) DEREASING RETURNS STAGE 2 (RATIONAL)
  • 11. Improving Catfish Production by Utilizing Business Environment Remote Control Theory aspljournals@africaresearchcorps.com 21 | P a g e succeeded in strategizing and controlling the environment to avoid producing outside stage 2 of the production function. This finding is in cognizance with Ogundari, Ojo and Brummer (2006) and Emekaro and Ekume (2009). Thus, the more business environment variables that are identified and controlled, the more likelihood of the catfish manager to produce within stage 2. The catfish farms were able to cushion their catfish enterprises against environmental perturbation. However, immediate control of the resources can easily be influenced by the manager, but long term scarcity of inputs within the business environment, which could easily disrupt production in stage 2, can be remotely controlled. The study found out that the catfish enterprises were able to remotely control the business environment by strategizing and adjusting to the agribusiness environment. Thus, the phenomenon gives rise to a situation termed “business environment remote control” as observed by this study. This term personifies the business environment as a remote, complex entity that can be cajoled so as to reduce the full wrath of the threats from the business environment. Our theory is in line with Rudolph and Repenning (2002)’s Disaster Dynamics or Business Environment Complexity Theory – complexity helps explain how systems can evolve in unexpected ways, exhibiting dramatic instability. This theory is depicted by Figure 1, which indicates that the RTS of the Business Environment is closer to the border line between stage 2 and stage 3. On the other hand, the RTS of the Social, Physical and Institutional Factors and their combinations are either in stage 1 or stage 2, however, they are not close to the border line between stage 2 and stage 3. Table 2: Cobb–Douglas Production Frontier Functions with Log Likelihood Estimates and LR Test of the One Sided Error (n=174) Cobb‐ Douglas Frontier Production Function General Model Physical Factors are Excluded Social Factors are Excluded Institutional Factors are Excluded Variable Frontier Production Function Constant ‐42.882 (27.303) 0.391** (0.177) 0.372** (0.161) 0.274*** (0.151) 0.389** (0.170) FING (kg/m2 ) 25.370** (8.291) 0.171** (0.07661) 0.202 (0.123) 0.215** (0.072) 0.169** (0.0752) FEED (kg/m2 ) 0.00876 (0.00638) 0.0534* (0.0166) 0.0601* (0.0165) 0.0590* (0.0152) 0.0577* (0.0154) LABO (man days/m2 ) 0.0113 (0.00638) 0.0353 (0.0207) 0.0304 (0.0262) 0.0319 (0.0208) 0.0398*** (0.0203)
  • 12. Improving Catfish Production by Utilizing Business Environment Remote Control Theory aspljournals@africaresearchcorps.com 22 | P a g e POSI (m2 ) 0.7554* (0.0772) 0.720* (0.0779) 0.711* (0.0714) 0.740* (0.0688) 0.717* (0.0765) Inefficiency effects model Constant 0.141*** (0.0713) 0.128 (0.119) 0.0320** (0.0122) 0.174* (0.550) AROADS (dummy) 0.0127 (0.0133) 0.0117 (0.0140) 0.0124 (0.00801) COSTPF (N) ‐0.00216 (0.00344) 0.000207 (0.000921) 0.000362 (0.00247) COSTSF(N) ‐0.00175 (0.00263) ‐0.00539 (0.00451) ‐0.00292 (0.00193) EDUCAT (yrs) ‐0.0506 (0.541) ‐0.0416 (0.0809) ‐0.0661 (0.0410) EXPERI (yrs) ‐0.0127 (0.0263) ‐0.0185 (0.0280) ‐0.0108 (0.0202) ACONS (dummy) ‐0.0631* (0.0182) ‐0.0572** (0.0226) ‐0.0577* (0.0136) CREDIT (N) ‐0.00207 (0.0031) ‐0.00149 (0.361) ‐0.00326* (0.000765) COSTIN (N) ‐0.00315 (0.00252) ‐0.00199 (0.00641) ‐0.0115* (0.00435) AVLMKT (dummy) 0.00908 (0.00943) ‐0.0218 (0.0617) ‐0.0166* (0.00430) Variance parameters Sigma‐squared 9181.350* (55.470) 0.00222* (0.000286) 0.00226* (0.000354) 0.00242* (0.000255) 0.00227* (0.000232) Gamma 0.0258 (0.133) 0.000311** (0.000137) 0.00835 (0.192) 0.0248 (0.000979) 0.00118 (0.0547) Log Likelihood LLF ‐1038.077 283.723 278.740 279.785 282.634 LR test of the one sided error LR 30.612 20.647 22.736 28.434 *,** and *** indicate that the parameter is significant at the 1, 5 and 10%, respectively, figures in parenthesis are error values
  • 13. Improving Catfish Production by Utilizing Business Environment Remote Control Theory aspljournals@africaresearchcorps.com 23 | P a g e 5. Conclusion and Recommendations 5.1. Conclusion The study concludes that immediate control of resources can easily be influenced by the manager, but additional change in the level of inputs, which will subsequently lead to decreasing return to scale is remotely controlled by the business environment. Thus, the study came up with the conclusion that, business environment (i.e. physical, social and institutional) factors do have effect on catfish production in Benue State, Nigeria. 5.2. Recommendations Based on the findings of this study, the following recommendations are appropriate: i. However, the agribusiness manager or catfish producer needs to make meaning of the frontier statistics. ii. Catfish Production Managers should ensure that business maneuvers and decisions should be taken to mimic or reduce business environment perturbations arising from the business environment. iii. In order to have effective control over the inputs resources within the catfish business environment, efforts should be made by academics and managers to identify other environmental factors such as government/political/legal, economic, natural, suppliers, etc, that could pose serious threats. References Amit, R. and Schoemaker, P. (1993). Strategic Assets and Organizational Rent. Strategic Management Journal, 14: 33‐46. Anderson, P. (1999). Introduction to the Special Issue: Application of Complexity Theory to Organization Science. Organization Science, 10(3):233‐236. Andriani, P. and McKelvey, B. (2009). From Gaussian to Paretian Thinking: Causes and Implications of Power Laws in Organizations. Organization Science, 20:1053‐1071. Arthur, W. B. (1994) Increasing Returns and Path Dependence in the Economy. Ann Arbor, MI: University of Michigan Press. 47 pp. Ashmos, D. and Huber, G. (1987). The System Paradigm in Organization Theory: Correcting the Record and Suggesting the Future. Academy of Management Review, 12:607‐621. Battese, G.E. and Coelli, T. (1988). Prediction of Firm‐Level Technical Efficiencies with a Generalized Frontier Production Function and Panel Data. Journal of Econometrics, 38: 387‐399. Battese, G.E. and Coelli, T.J. (1995). Frontier Production Functions, Technical Efficiency and Panel Data: With Application to Paddy farmers in India. Journal of Productivity Analysis, 3: 153‐208.
  • 14. Improving Catfish Production by Utilizing Business Environment Remote Control Theory aspljournals@africaresearchcorps.com 24 | P a g e Bogner, W. C., Mahoney, J. T. and Thomas, H. (1998). Paradigm shift: Parallels in the Origin, Evolution and Function of the Strategic Group Concept and the Resource‐based Theory of the Firm. Advances in Strategic Management, 14: 63‐102. Brock, W.A., Hsieh, D.A. and LeBaron, B. (1991). Nonlinear Dynamics, Chaos, and Instability: Statistical Theory and Economic Evidence . Cambridge, MA: M.I.T. Press. 189 pp. Cheng, Y. and Van De Ven, A. (1996). The Innovation Journey: Order out of Chaos? Organization Science, 6: 593‐614. Davis, J., Eisenhardt, K. and Bingham, C. (2007). Developing Theory through Simulation Methods. Academy of Management Review, 32:480‐499. Dooley, K. and Van De Ven, A. (1999). Explaining Complex Organizational Dynamics. Organization Science, 10(3): 358‐372. Eisenhardt, K. and Martin, J. (2000). Dynamic capabilities. Strategic Management Journal, 21: 1105‐1121. Emokaro, C.O and Ekunwe, P.A. (2009). Efficiency of Resource‐use and Elasticity of production among catfish farmers in Kaduna, Nigeria. Journal of Applied Sciences Research, 5(7):776‐779. Food and Agriculture Organization (FAO) (2007). Fish Country Profile – The Federal Republic of Nigeria. Rome: Author. 49 pp. Foss, N. J. (1996). Knowledge‐based Approach to the Theory of the Firm: Some Critical Comments. Organization Science, 7 (5): 470‐476. Gruca, T. and Nath, D. (1994). Regulatory Change, Constraints on Adaptation and Organizational Failure: An Empirical Analysis of Acute Care Hospitals. Strategic Management Journal, 15: 345‐363. Helfat, C. and Peteraf, M. (2003). The Dynamic RBV: Capability Lifecycles. Strategic Management Journal, 24: 999‐1010. Henderson, R. (1994). The Evolution of Integrative Capability and Innovation in Cardiovasculardrug Discovery. Industrial and Corporate Change, 3 (3): 607‐630. Henderson, R. and Cockburn, I. (1994). Measuring Competence? Exploring Firm Effects in Pharmaceutical Research. Strategic Management Journal, 15: 63‐84. Kauff man, S. (1993). The Origins of Order. New York, NY: Oxford University Press. 47 pp. Kor, Y.Y. and Leblebici, H. (2005). How do Interdependencies among Human‐Capital Deployment, Development, and Diversification Strategies Affect Firms’ Financial Performance? Strategic Management Journal, 26 (10): 967‐985. Lado, A., Boyd, N., Wright, P. and Kroll, M. (2006). Paradox and Theorizing within the Resource Based View. Academy of Management Review, 31: 115‐131. Leonard‐Barton, D. (1992). Core Capabilities and Core Rigidities: A Paradox in Managing New Product Development. Strategic Management Journal, 13: 111‐125. Levy, D. L. (1994). Chaos Theory and Strategy: Theory, Application, and Managerial Implications. Strategic Management Journal, 15: 167‐178. Madhok, A. (1996). The Organization of Economic Activity: Transaction Costs, Firm Capabilities and the Nature of Governance. Organization Science, 7 (5): 578‐590. McKelvey, B. (1998). Avoiding Complexity Catastrophe in Co‐evolutionary Pockets: Strategies
  • 15. Improving Catfish Production by Utilizing Business Environment Remote Control Theory aspljournals@africaresearchcorps.com 25 | P a g e for Rugged Landscapes. Organization Science , 10(3):294‐321. Nelson, R. R. and Winter, S. G. (1982). An Evolutionary Theory of Economic Change. Cambridge, MA: Belknap Press of Harvard University Press. 332 pp. Ogidi, A.E., Adekitan, R. and Odiba, R.I. (2013). Environmental Analysis and Diagnosis of Catfish Enterprises. Journal of Business and Management, 6(6):09‐17. Ogidi, A. E. and Umeh, J.C. (2015). Effect of Business Environment on Catfish Production in Zone C, Benue State, Nigeria. International Academic Journal of Empirical Research, 1(1):37‐47. Ogidi, A. E. (2016). Environment of Agribusiness. Nigeria: Africa Research Corps Publishing. Ogundari, K., Ojo, S.O. and Brummer, B. (2005). Productivity Potential and Technical Efficiency of Aquaculture Production in Alleviating Poverty: Empirical Evidence from Nigeria. J. Fish. Int. 1(1‐2): 21‐26. Ottih, L.O. (2006). General Management: Strategy, Implementation and Control. (3rd Ed.). Nigeria. Port Harcourt: Pearl Publishers. 246 pp. Penrose, E. T. (1959). The Theory of the Growth of the Firm. New York, NY: John Wiley & Sons. 135 pp. Pisano, G. (1994). Knowledge, Integration, and the Locus of Learning: An Empirical Analysis of Process Development. Strategic Management Journal, 15 (Special Issue): 85‐100. Prigogine, I. and Glansdorff , P. (1971). Thermodynamic Theory of Structure, Stability, and Fluctuations. New York: Wiley & Sons. 361 pp. Rudolph, J. and Repenning, N. (2002). Disaster Dynamics: Understanding the Role of Quantity in Organizational Collapse. Administrative Science Quarterly, 47, 1‐30. Teece, D. J., Rumelt, R., Dosi, G. and Winter, S. (1997). Understanding Corporate Coherence: Theory and Evidence. Journal of Economic Behavior and Organization, 23: 1‐30. Umeh, J.C., Asogwa, B.C. and Ater, P.I. (2013). Production Economics: Some Analytical Perspectives. Nigeria, Enugu State: El’Demak Ltd. 233pp Wernerfelt, B. (1984). A resource‐based view of the firm. Strategic Management Journal, 5(2): 171‐180. Winter, S. G. (2000). The satisfying principle in capability learning. Strategic Management Journal, 21: 981‐996. Zander, U., B. Kogut. (1995). Knowledge and the Speed of Transfer and Imitation of Organizational Capabilities: An Empirical Test. Organization Science 6, (1): 76‐82. Zollo, M. and Winter, S. (2002). Deliberate Learning and the Evolution of Dynamic Capabilities. Organization Science, 13: 339‐351.