Downloaded 222 times
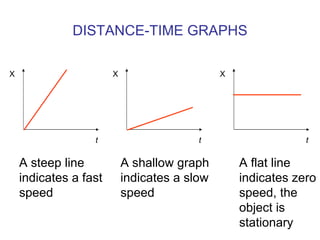
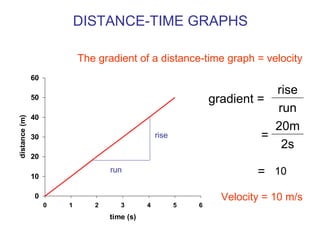
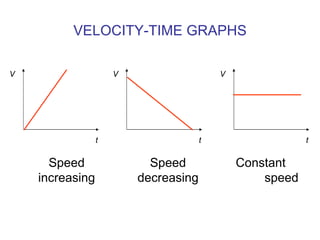

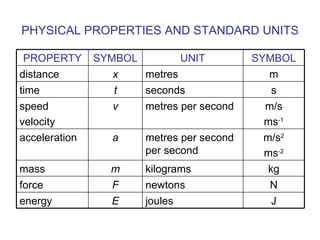
This document discusses distance-time graphs, velocity-time graphs, and standard units for physical properties. Distance-time graphs show steep lines for fast speeds, shallow lines for slow speeds, and flat lines for zero speed. Velocity is calculated from the gradient of a distance-time graph. Velocity-time graphs show increasing, decreasing, or constant speed. The area under a velocity-time graph equals the distance travelled. Common units for physical properties like distance, time, speed, and mass are also listed.


