San Francisco Market Focus June 2014
•
0 likes•274 views

San Francisco Market Focus June 2014

Recommended
Recommended
More Related Content
What's hot
What's hot (20)
Viewers also liked
Viewers also liked (20)
Similar to San Francisco Market Focus June 2014
Similar to San Francisco Market Focus June 2014 (15)
More from Ronny Budiutama
More from Ronny Budiutama (20)
Recently uploaded
Recently uploaded (20)
San Francisco Market Focus June 2014
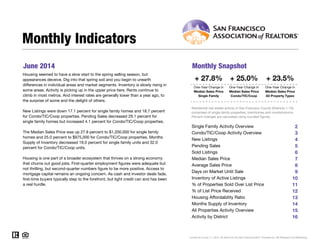
- 1. June 2014 Monthly Snapshot One-Year Change in One-Year Change in Median Sales Price Single Family Median Sales Price Condo/TIC/Coop 2 Monthly Indicators + 27.8% + 25.0% + 23.5% One-Year Change in Housing seemed to have a slow start to the spring selling season, but appearances deceive. Dig into that spring soil and you begin to unearth differences in individual areas and market segments. Inventory is slowly rising in some areas. Activity is picking up in the upper price tiers. Rents continue to climb in most metros. And interest rates are generally lower than a year ago, to the surprise of some and the delight of others. New Listings were down 17.1 percent for single family homes and 18.7 percent for Condo/TIC/Coop properties. Pending Sales decreased 29.1 percent for single family homes but increased 4.1 percent for Condo/TIC/Coop properties. Median Sales Price All Property Types Residential real estate activity in San Francisco County (Districts 1-10), comprised of single-family properties, townhomes and condominiums. Percent changes are calculated using rounded figures. Single Family Activity Overview 2 3 4 5 6 7 8 9 10 11 12 13 14 15 16 The Median Sales Price was up 27.8 percent to $1,200,000 for single family homes and 25.0 percent to $975,000 for Condo/TIC/Coop properties. Months Supply of Inventory decreased 19.0 percent for single family units and 32.0 percent for Condo/TIC/Coop units. Housing is one part of a broader ecosystem that thrives on a strong economy that churns out good jobs. First-quarter employment figures were adequate but not thrilling, but second-quarter numbers figure to be more positive. Access to mortgage capital remains an ongoing concern. As cash and investor deals fade, first-time buyers typically step to the forefront, but tight credit can and has been a real hurdle. Single Family Activity Overview Months Supply of Inventory Current as of July 11, 2014. All data from the San Francisco MLS. Powered by 10K Research and Marketing. Condo/TIC/Coop Activity Overview Inventory of Active Listings % of Properties Sold Over List Price % of List Price Received Housing Affordability Ratio All Properties Activity Overview New Listings Pending Sales Sold Listings Median Sales Price Average Sales Price Days on Market Until Sale Activity by District
- 2. Single Family Activity Overview Key metrics by report month and for year-to-date (YTD) starting from the first of the year. Key Metrics Historical Sparkbars 6-2013 6-2014 Percent Change YTD 2013 YTD 2014 Percent Change Average Sales Price $1,195,239 $1,624,634 + 35.9% $1,273,344 $1,468,922 Median Sales Price $939,000 $1,200,000 + 27.8% $905,000 Sold Listings 272 183 - 32.7% 1,243 New Listings 293 243 - 17.1% 1,603 Pending Sales 278 197 - 29.1% - 12.4%1,303 1,141 - 13.8%1,381 1,079 - 13.2% $1,050,000 + 16.0% + 15.4% 6-2011 6-2012 6-2013 6-2014 6-2011 6-2012 6-2013 6-2014 6-2011 6-2012 6-2013 6-2014 6-2011 6-2012 6-2013 6-2014 6-2011 6-2012 6-2013 6-2014 Current as of July 11, 2014. All data from the San Francisco MLS. Powered by 10K Research and Marketing. | Click for Cover Page | 2 Months Supply 2.1 1.7 - 19.0% -- -- -- Affordability Ratio 48 38 - 20.8% % of List Price Received 112.4% 114.3% + 1.7% 110.4% 50 79.6% + 5.0% + 2.4% 43 - 14.0% 113.0% % of Properties Sold Over List Price 80.1% 79.8% - 0.4% 75.8% Active Listings 469 354 - 24.5% -- Days on Market 35 27 - 22.9% 37 32 - 13.5% -- -- 6-2011 6-2012 6-2013 6-2014 6-2011 6-2012 6-2013 6-2014 6-2011 6-2012 6-2013 6-2014 6-2011 6-2012 6-2013 6-2014 6-2011 6-2012 6-2013 6-2014 6-2011 6-2012 6-2013 6-2014 6-2011 6-2012 6-2013 6-2014
- 3. Condo/TIC/Coop Activity Overview Key metrics by report month and for year-to-date (YTD) starting from the first of the year. Key Metrics Historical Sparkbars 6-2013 6-2014 Percent Change YTD 2013 YTD 2014 Percent Change Average Sales Price $930,338 $1,185,316 + 27.4% $938,597 $945,000 + 17.1% + 18.3%$1,110,451 Sold Listings 277 271 - 2.2% 1,593 1,557 - 2.3% Median Sales Price $780,000 $975,000 + 25.0% $807,000 - 8.8% Pending Sales 290 302 + 4.1% 1,652 1,620 - 1.9% New Listings 358 291 - 18.7% 2,134 1,946 6-2011 6-2012 6-2013 6-2014 6-2011 6-2012 6-2013 6-2014 6-2011 6-2012 6-2013 6-2014 6-2011 6-2012 6-2013 6-2014 6-2011 6-2012 6-2013 6-2014 Current as of July 11, 2014. All data from the San Francisco MLS. Powered by 10K Research and Marketing. | Click for Cover Page | 3 Months Supply 2.5 1.7 - 32.0% -- -- -- Affordability Ratio 66 54 - 18.2% % of List Price Received 107.0% 108.5% + 1.4% 105.2% 64 68.3% + 8.1% + 2.3% 55 - 14.1% 107.6% % of Properties Sold Over List Price 71.8% 69.7% - 2.9% 63.2% Active Listings 655 470 - 28.2% -- Days on Market 38 35 - 7.9% 43 35 - 18.6% -- -- 6-2011 6-2012 6-2013 6-2014 6-2011 6-2012 6-2013 6-2014 6-2011 6-2012 6-2013 6-2014 6-2011 6-2012 6-2013 6-2014 6-2011 6-2012 6-2013 6-2014 6-2011 6-2012 6-2013 6-2014 6-2011 6-2012 6-2013 6-2014
- 4. New Listings New Listings Single Family Year-Over-Year Change Condo/TIC/ Coop Year-Over-Year Change Jul-2013 259 +1.6% 332 +23.4% Aug-2013 272 +7.1% 341 +8.9% Sep-2013 296 -6.6% 449 +16.0% Oct-2013 276 -3.8% 321 +5.2% Nov-2013 172 -5.0% 191 -9.5% Dec-2013 112 +9.8% 116 +1.8% Jan-2014 207 +1.5% 337 +8.7% Feb-2014 195 -7.6% 303 -4.1% Mar-2014 232 -8.7% 300 -18.9% Apr-2014 236 -21.9% 354 -10.6% May-2014 243 -28.3% 313 -18.5% Jun-2014 243 -17.1% 291 -18.7% 12-Month Avg 231 -7.8% 308 -1.0% A count of the properties that have been newly listed on the market in a given month. 259 334 293 358 243 291 June 1,576 1,991 1,603 2,134 1,381 1,946 Year to Date 2012 2013 2014 - 18 7%+ 7 2%17 1%+ 13 1% + 7 2%13 8%+ 1 7% 8 8% 2012 2013 2014 2012 2013 2014 2012 2013 2014 25 8% 13 5% 15 0%- 13 9% 12 Month Avg 231 7.8% 308 1.0% Historical New Listings by Month Current as of July 11, 2014. All data from the San Francisco MLS. Powered by 10K Research and Marketing. | Click for Cover Page | 4 Single Family Condo/TIC/Coop 0 100 200 300 400 500 600 700 1-2005 1-2006 1-2007 1-2008 1-2009 1-2010 1-2011 1-2012 1-2013 1-2014 Single Family Condo/TIC/Coop Single Family Condo/TIC/Coop 2012 2013 2014 - 18.7%+ 7.2%- 17.1%+ 13.1% + 7.2%- 13.8%+ 1.7% - 8.8% 2012 2013 2014 2012 2013 2014 2012 2013 2014 - 25.8% - 13.5% - 15.0%- 13.9%
- 5. Pending Sales Pending Sales Single Family Year-Over-Year Change Condo/TIC/ Coop Year-Over-Year Change Jul-2013 250 +10.6% 332 +16.1% Aug-2013 229 +1.3% 302 +4.5% Sep-2013 210 +15.4% 254 +16.5% Oct-2013 245 -14.6% 340 +22.7% Nov-2013 224 -10.8% 270 -0.4% Dec-2013 172 +1.2% 202 -0.5% Jan-2014 135 -14.6% 184 +5.7% Feb-2014 166 +11.4% 251 +15.7% Mar-2014 220 +6.3% 294 -2.6% Apr-2014 211 -12.8% 291 -5.8% May-2014 207 -23.0% 285 -20.8% Jun-2014 197 -29.1% 302 +4.1% 12-Month Avg 206 -6.6% 277 +3.9% A count of the properties on which offers have been accepted in a given month. 237 314 278 290 197 302 June 1,305 1,610 1,303 1,652 1,141 1,620 Year to Date 2012 2013 2014 + 4 1%- 7 6%29 1%+ 17 3% + 2 6%12 4%0 2% 1 9% 2012 2013 2014 2012 2013 2014 2012 2013 2014 4 4% + 4 9% + 19 3%+ 31 4% 12 Month Avg 206 6.6% 277 +3.9% Historical Pending Sales by Month Current as of July 11, 2014. All data from the San Francisco MLS. Powered by 10K Research and Marketing. | Click for Cover Page | 5 Single Family Condo/TIC/Coop 0 100 200 300 400 1-2005 1-2006 1-2007 1-2008 1-2009 1-2010 1-2011 1-2012 1-2013 1-2014 Single Family Condo/TIC/Coop Single Family Condo/TIC/Coop 2012 2013 2014 + 4.1%- 7.6%- 29.1%+ 17.3% + 2.6%- 12.4%- 0.2% - 1.9% 2012 2013 2014 2012 2013 2014 2012 2013 2014 - 4.4% + 4.9% + 19.3%+ 31.4%
- 6. Sold Listings Sold Listings Single Family Year-Over-Year Change Condo/TIC/ Coop Year-Over-Year Change Jul-2013 278 +28.1% 341 +23.1% Aug-2013 238 -1.7% 303 -6.2% Sep-2013 188 +5.0% 229 +0.4% Oct-2013 256 +0.4% 335 +21.8% Nov-2013 240 -11.8% 283 +4.8% Dec-2013 216 +3.3% 246 -2.0% Jan-2014 131 -18.6% 179 +14.7% Feb-2014 157 +21.7% 222 +13.8% Mar-2014 176 -15.0% 266 -5.7% Apr-2014 207 -6.8% 320 +5.6% May-2014 220 -12.7% 286 -24.7% Jun-2014 183 -32.7% 271 -2.2% 12-Month Avg 208 -4.7% 275 +2.4% A count of the actual sales that closed in a given month. 268 340 272 277 183 271 June 1,260 1,542 1,243 1,593 1,079 1,557 Year to Date 2012 2013 2014 - 2 2%- 18 5%32 7%+ 1 5% + 3 3%13 2%1 3% 2 3% 2012 2013 2014 2012 2013 2014 2012 2013 2014 + 1 1% + 6 3% + 17 6%+ 42 9% 12 Month Avg 208 4.7% 275 +2.4% Historical Sold Listings by Month Current as of July 11, 2014. All data from the San Francisco MLS. Powered by 10K Research and Marketing. | Click for Cover Page | 6 Single Family Condo/TIC/Coop 0 100 200 300 400 1-2005 1-2006 1-2007 1-2008 1-2009 1-2010 1-2011 1-2012 1-2013 1-2014 Single Family Condo/TIC/Coop Single Family Condo/TIC/Coop 2012 2013 2014 - 2.2%- 18.5%- 32.7%+ 1.5% + 3.3%- 13.2%- 1.3% - 2.3% 2012 2013 2014 2012 2013 2014 2012 2013 2014 + 1.1% + 6.3% + 17.6%+ 42.9%
- 7. Median Sales Price Median Sales Price Single Family Year-Over-Year Change Condo/TIC/ Coop Year-Over-Year Change Jul-2013 $872,500 +13.6% $850,000 +23.2% Aug-2013 $934,000 +22.5% $810,000 +11.7% Sep-2013 $929,000 +28.1% $826,000 +6.4% Oct-2013 $905,000 +9.0% $865,000 +13.8% Nov-2013 $957,000 +18.1% $826,000 +6.6% Dec-2013 $947,000 +13.4% $762,500 +9.1% Jan-2014 $925,000 +24.2% $950,000 +24.6% Feb-2014 $1,050,000 +31.2% $937,000 +24.9% Mar-2014 $987,500 +7.3% $971,500 +18.1% Apr-2014 $1,100,000 +10.0% $905,000 +7.1% May-2014 $1,100,000 +8.1% $952,500 +14.8% Jun-2014 $1,200,000 +27.8% $975,000 +25.0% 12-Month Avg* $965,000 +13.5% $879,000 +13.4% Point at which half of the sales sold for more and half sold for less, not accounting for seller concessions, in a given month. $780,000 $712,500 $939,000 $780,000 $1,200,000 $975,000 June $730,000 $675,000 $905,000 $807,000 $1,050,000 $945,000 Year to Date 2012 2013 2014 + 25 0%+ 9 5%+ 27 8%+ 20 4% + 19 6%+ 16 0%+ 24 0% + 17 1% 2012 2013 2014 2012 2013 2014 2012 2013 2014 + 4 9% + 4 7% + 5 5%+ 11 8% 12 Month Avg $965,000 +13.5% $879,000 +13.4% Historical Median Sales Price by Month * Median Sales Price for all properties from July 2013 through June 2014. This is not the average of the individual figures above. Current as of July 11, 2014. All data from the San Francisco MLS. Powered by 10K Research and Marketing. | Click for Cover Page | 7 Single Family Condo/TIC/Coop $400,000 $600,000 $800,000 $1,000,000 $1,200,000 $1,400,000 1-2005 1-2006 1-2007 1-2008 1-2009 1-2010 1-2011 1-2012 1-2013 1-2014 Single Family Condo/TIC/Coop Single Family Condo/TIC/Coop 2012 2013 2014 + 25.0%+ 9.5%+ 27.8%+ 20.4% + 19.6%+ 16.0%+ 24.0% + 17.1% 2012 2013 2014 2012 2013 2014 2012 2013 2014 + 4.9% + 4.7% + 5.5%+ 11.8%
- 8. Average Sales Price Average Sales Price Single Family Year-Over-Year Change Condo/TIC/ Coop Year-Over-Year Change Jul-2013 $1,281,445 +8.5% $1,018,542 +30.8% Aug-2013 $1,301,708 +31.8% $929,734 +15.4% Sep-2013 $1,235,064 +31.9% $941,430 +4.8% Oct-2013 $1,347,949 +4.0% $1,009,812 +13.6% Nov-2013 $1,323,997 +18.8% $980,320 +1.0% Dec-2013 $1,376,546 -0.6% $1,020,083 +19.3% Jan-2014 $1,244,233 +36.7% $1,115,620 +34.0% Feb-2014 $1,462,472 +25.4% $994,160 +13.6% Mar-2014 $1,427,555 +4.6% $1,062,966 +11.5% Apr-2014 $1,510,889 +10.9% $1,120,391 +14.8% May-2014 $1,486,508 -0.2% $1,174,824 +19.9% Jun-2014 $1,624,634 +35.9% $1,185,316 +27.4% 12-Month Avg* $1,380,123 +14.0% $1,044,379 +16.0% Average sales price for all closed sales, not accounting for seller concessions, in a given month. $1,159,940 $824,158 $1,195,239 $930,338 $1,624,634 $1,185,316 June $1,049,217 $772,352 $1,273,344 $938,597 $1,468,922 $1,110,451 Year to Date 2012 2013 2014 + 27 4%+ 12 9%+ 35 9%+ 3 0% + 21 5%+ 15 4%+ 21 4% + 18 3% 2012 2013 2014 2012 2013 2014 2012 2013 2014 + 24 5% + 11 2% + 1 8%+ 9 5% 12 Month Avg $1,380,123 +14.0% $1,044,379 +16.0% Historical Average Sales Price by Month * Average Sales Price for all properties from July 2013 through June 2014. This is not the average of the individual figures above. Current as of July 11, 2014. All data from the San Francisco MLS. Powered by 10K Research and Marketing. | Click for Cover Page | 8 Single Family Condo/TIC/Coop $600,000 $800,000 $1,000,000 $1,200,000 $1,400,000 $1,600,000 $1,800,000 1-2005 1-2006 1-2007 1-2008 1-2009 1-2010 1-2011 1-2012 1-2013 1-2014 Single Family Condo/TIC/Coop Single Family Condo/TIC/Coop 2012 2013 2014 + 27.4%+ 12.9%+ 35.9%+ 3.0% + 21.5%+ 15.4%+ 21.4% + 18.3% 2012 2013 2014 2012 2013 2014 2012 2013 2014 + 24.5% + 11.2% + 1.8%+ 9.5%
- 9. Days on Market Until Sale Days on Market Single Family Year-Over-Year Change Condo/TIC/ Coop Year-Over-Year Change Jul-2013 33 -29.8% 39 -35.0% Aug-2013 38 -24.0% 38 -29.6% Sep-2013 31 -32.6% 37 -28.8% Oct-2013 34 -24.4% 37 -32.7% Nov-2013 34 -19.0% 41 -19.6% Dec-2013 42 -12.5% 44 -27.9% Jan-2014 40 -18.4% 51 -19.0% Feb-2014 38 -7.3% 40 -18.4% Mar-2014 32 -17.9% 33 -21.4% Apr-2014 35 0.0% 33 -19.5% May-2014 26 -18.8% 30 -16.7% Jun-2014 27 -22.9% 35 -7.9% 12-Month Avg* 34 -19.1% 38 -23.6% Average number of days between when a property is listed and when an offer is accepted in a given month. 59 57 35 38 27 35 June 60 70 37 43 32 35 Year to Date 2012 2013 2014 7 9%- 33 3%22 9%40 7% 38 6%13 5%38 3% 18 6% 2012 2013 2014 2012 2013 2014 2012 2013 2014 0 0% 9 1% 11 4%- 24 0% 12 Month Avg 34 19.1% 38 23.6% Historical Days on Market Until Sale by Month * Days on Market for all properties from July 2013 through June 2014. This is not the average of the individual figures above. Current as of July 11, 2014. All data from the San Francisco MLS. Powered by 10K Research and Marketing. | Click for Cover Page | 9 Single Family Condo/TIC/Coop 20 40 60 80 100 120 1-2005 1-2006 1-2007 1-2008 1-2009 1-2010 1-2011 1-2012 1-2013 1-2014 Single Family Condo/TIC/Coop Single Family Condo/TIC/Coop 2012 2013 2014 - 7.9%- 33.3%- 22.9%- 40.7% - 38.6%- 13.5%- 38.3% - 18.6% 2012 2013 2014 2012 2013 2014 2012 2013 2014 0.0% - 9.1% - 11.4%- 24.0%
- 10. Inventory of Active Listings Active Listings Single Family Year-Over-Year Change Condo/TIC/ Coop Year-Over-Year Change Jul-2013 456 -10.6% 611 -8.9% Aug-2013 467 -7.5% 588 -6.8% Sep-2013 503 -16.4% 719 -4.4% Oct-2013 491 -10.6% 638 -10.9% Nov-2013 394 -11.7% 503 -16.4% Dec-2013 271 -15.3% 331 -19.3% Jan-2014 317 -6.8% 458 -8.6% Feb-2014 324 -15.4% 485 -15.8% Mar-2014 318 -22.1% 461 -25.0% Apr-2014 315 -29.5% 494 -25.3% May-2014 324 -33.5% 489 -23.7% Jun-2014 354 -24.5% 470 -28.2% 12-Month Avg* 379 -16.8% 526 -15.0% The number of properties available for sale in active status at the end of a given month. 525 722 469 655 354 470 June 2012 2013 2014 28 2%9 3%24 5%10 7% 2012 2013 2014 32 5% 37 4% 12 Month Avg 379 16.8% 526 15.0% Historical Inventory of Active Listings by Month * Active Listings for all properties from July 2013 through June 2014. This is not the average of the individual figures above. Current as of July 11, 2014. All data from the San Francisco MLS. Powered by 10K Research and Marketing. | Click for Cover Page | 10 Single Family Condo/TIC/Coop 200 400 600 800 1,000 1,200 1,400 1,600 1-2005 1-2006 1-2007 1-2008 1-2009 1-2010 1-2011 1-2012 1-2013 1-2014 Single Family Condo/TIC/Coop 2012 2013 2014 - 28.2%- 9.3%- 24.5%- 10.7% 2012 2013 2014 - 32.5% - 37.4%
- 11. % of Properties Sold Over List Price % of Properties Sold Over List Price Single Family Year-Over-Year Change Condo/TIC/ Coop Year-Over-Year Change Jul-2013 78.1% +23.8% 73.3% +72.1% Aug-2013 75.2% +13.8% 66.0% +45.1% Sep-2013 78.7% +14.6% 68.6% +29.2% Oct-2013 80.8% +23.4% 67.8% +11.7% Nov-2013 77.5% +16.5% 62.5% +14.9% Dec-2013 64.8% +5.0% 54.1% +17.1% Jan-2014 64.9% +1.4% 43.8% +10.3% Feb-2014 75.8% +4.3% 68.9% +25.5% Mar-2014 77.3% +3.2% 72.2% +14.4% Apr-2014 85.5% +7.3% 71.3% +5.9% May-2014 87.3% +12.2% 75.5% +11.7% Jun-2014 79.8% -0.4% 69.7% -2.9% 12-Month Avg 77.6% +10.4% 67.0% +18.3% Percentage found when dividing the number of properties sold by properties sold over its original list price, not accounting for seller concessions. 64.6% 48.2% 80.1% 71.8% 79.8% 69.7% June 52.8% 40.6% 75.8% 63.2% 79.6% 68.3% Year to Date 2012 2013 2014 - 2 9%+ 49 0%0 4%+ 24 0% + 55 7%+ 5 0%+ 43 6% + 8 1% 2012 2013 2014 2012 2013 2014 2012 2013 2014 + 61 5% + 38 6% + 80 4%+ 121 1% 12 Month Avg 77.6% +10.4% 67.0% +18.3% Historical % of Properties Sold Over List Price by Month * % of Properties Sold Over List Price for all properties from July 2013 through June 2014. This is not the average of the individual figures above. Current as of July 11, 2014. All data from the San Francisco MLS. Powered by 10K Research and Marketing. | Click for Cover Page | 11 Single Family Condo/TIC/Coop 0.0% 20.0% 40.0% 60.0% 80.0% 100.0% 1-2005 1-2006 1-2007 1-2008 1-2009 1-2010 1-2011 1-2012 1-2013 1-2014 Single Family Condo/TIC/Coop Single Family Condo/TIC/Coop 2012 2013 2014 - 2.9%+ 49.0%- 0.4%+ 24.0% + 55.7%+ 5.0%+ 43.6% + 8.1% 2012 2013 2014 2012 2013 2014 2012 2013 2014 + 61.5% + 38.6% + 80.4%+ 121.1%
- 12. % of List Price Received % of List Price Received Single Family Year-Over-Year Change Condo/TIC/ Coop Year-Over-Year Change Jul-2013 109.6% +3.9% 106.8% +5.1% Aug-2013 110.1% +4.1% 105.5% +3.4% Sep-2013 109.8% +2.7% 105.8% +3.5% Oct-2013 110.2% +4.8% 105.5% +1.8% Nov-2013 108.7% +2.2% 105.0% +2.4% Dec-2013 106.8% +2.1% 103.4% +1.8% Jan-2014 107.6% +1.4% 103.0% +1.7% Feb-2014 110.2% +1.7% 106.2% +2.3% Mar-2014 111.9% +1.8% 108.4% +3.3% Apr-2014 115.0% +3.0% 108.4% +2.6% May-2014 116.1% +4.3% 109.2% +3.1% Jun-2014 114.3% +1.7% 108.5% +1.4% 12-Month Avg* 110.9% +2.7% 106.4% +2.7% Percentage found when dividing a property’s sales price by its most recent list price, then taking the average for all properties sold in a given month, not accounting for seller concessions. 104.8% 101.4% 112.4% 107.0% 114.3% 108.5% June 102.9% 100.8% 110.4% 105.2% 113.0% 107.6% Year to Date 2012 2013 2014 1 4%5 5%1 7%7 3% 2012 2013 2014 4 8% 2 9% 2012 2013 2014 + 2 3%4 4%2 4%7 3% 2012 2013 2014 3 2% 2 6% 12 Month Avg 110.9% +2.7% 106.4% +2.7% Historical % of List Price Received by Month * % of List Price Received for all properties from July 2013 through June 2014. This is not the average of the individual figures above. Current as of July 11, 2014. All data from the San Francisco MLS. Powered by 10K Research and Marketing. | Click for Cover Page | 12 Single Family Condo/TIC/Coop Single Family Condo/TIC/Coop 95.0% 100.0% 105.0% 110.0% 115.0% 120.0% 1-2005 1-2006 1-2007 1-2008 1-2009 1-2010 1-2011 1-2012 1-2013 1-2014 Single Family Condo/TIC/Coop 2012 2013 2014 + 1.4%+ 5.5%+ 1.7%+ 7.3% 2012 2013 2014 + 4.8% + 2.9% 2012 2013 2014 + 2.3%+ 4.4%+ 2.4%+ 7.3% 2012 2013 2014 + 3.2% + 2.6%
- 13. Housing Affordability Ratio Affordability Ratio Single Family Year-Over-Year Change Condo/TIC/ Coop Year-Over-Year Change Jul-2013 52 -20.0% 61 -25.6% Aug-2013 48 -26.2% 63 -19.2% Sep-2013 49 -30.0% 63 -16.0% Oct-2013 51 -15.0% 61 -19.7% Nov-2013 51 -17.7% 67 -10.7% Dec-2013 49 -19.7% 69 -16.9% Jan-2014 47 -29.9% 53 -30.3% Feb-2014 42 -31.1% 54 -28.0% Mar-2014 45 -15.1% 53 -23.2% Apr-2014 40 -20.0% 56 -17.6% May-2014 41 -12.8% 55 -17.9% Jun-2014 38 -20.8% 54 -18.2% 12-Month Avg* 46 -35.8% 59 -27.1% This index measures housing affordability for the region. An index of 120 means the median household income is 120% of what is necessary to qualify for the median-priced home under prevailing interest rates. A higher number means greater affordability. 63 79 48 66 38 54 June 2012 2013 2014 18 2%16 5%20 8%23 8% 2012 2013 2014 3 3% 0 0% 67 83 50 64 43 55 Year to Date 2012 2013 2014 14 1%22 9%14 0%25 4% 2012 2013 2014 3 1% + 5 1% 12 Month Avg 46 35.8% 59 27.1% Historical Housing Affordability Ratio by Month * Affordability Ratio for all properties from July 2013 through June 2014. This is not the average of the individual figures above. Current as of July 11, 2014. All data from the San Francisco MLS. Powered by 10K Research and Marketing. | Click for Cover Page | 13 Single Family Condo/TIC/Coop 30 40 50 60 70 80 90 100 1-2005 1-2006 1-2007 1-2008 1-2009 1-2010 1-2011 1-2012 1-2013 1-2014 Single Family Condo/TIC/Coop 2012 2013 2014 - 18.2%- 16.5%- 20.8%- 23.8% 2012 2013 2014 + 3.3% 0.0% Single Family Condo/TIC/Coop 2012 2013 2014 - 14.1%- 22.9%- 14.0%- 25.4% 2012 2013 2014 + 3.1% + 5.1%
- 14. Months Supply of Inventory Months Supply Single Family Year-Over-Year Change Condo/TIC/ Coop Year-Over-Year Change Jul-2013 2.1 -12.5% 2.3 -17.9% Aug-2013 2.1 -12.5% 2.2 -15.4% Sep-2013 2.2 -21.4% 2.6 -13.3% Oct-2013 2.2 -12.0% 2.3 -17.9% Nov-2013 1.8 -10.0% 1.8 -21.7% Dec-2013 1.2 -20.0% 1.2 -25.0% Jan-2014 1.5 0.0% 1.6 -15.8% Feb-2014 1.5 -16.7% 1.7 -22.7% Mar-2014 1.4 -26.3% 1.6 -30.4% Apr-2014 1.4 -33.3% 1.8 -28.0% May-2014 1.5 -31.8% 1.8 -25.0% Jun-2014 1.7 -19.0% 1.7 -32.0% 12-Month Avg* 1.7 -17.6% 1.9 -20.9% The inventory of homes for sale at the end of a given month, divided by the average monthly pending sales from the last 12 months. 2.5 3.1 2.1 2.5 1.7 1.7 June 2012 2013 2014 32 0%19 4%19 0%16 0% 2012 2013 2014 35 9% 44 6% 12 Month Avg 1.7 17.6% 1.9 20.9% Historical Months Supply of Inventory by Month * Months Supply for all properties from July 2013 through June 2014. This is not the average of the individual figures above. Current as of July 11, 2014. All data from the San Francisco MLS. Powered by 10K Research and Marketing. | Click for Cover Page | 14 Single Family Condo/TIC/Coop 0.0 2.0 4.0 6.0 8.0 10.0 1-2005 1-2006 1-2007 1-2008 1-2009 1-2010 1-2011 1-2012 1-2013 1-2014 Single Family Condo/TIC/Coop 2012 2013 2014 - 32.0%- 19.4%- 19.0%- 16.0% 2012 2013 2014 - 35.9% - 44.6%
- 15. All Properties Activity Overview Key metrics by report month and for year-to-date (YTD) starting from the first of the year. Key Metrics Historical Sparkbars 6-2013 6-2014 Percent Change YTD 2013 YTD 2014 Percent Change Average Sales Price $1,061,582 $1,362,398 + 28.3% $1,085,248 $985,000 + 16.6% + 15.8%$1,257,241 Sold Listings 549 454 - 17.3% 2,837 2,636 - 7.1% Median Sales Price $850,000 $1,050,000 + 23.5% $845,000 - 11.0% Pending Sales 568 499 - 12.1% 2,955 2,761 - 6.6% New Listings 651 534 - 18.0% 3,737 3,327 6-2011 6-2012 6-2013 6-2014 6-2011 6-2012 6-2013 6-2014 6-2011 6-2012 6-2013 6-2014 6-2011 6-2012 6-2013 6-2014 6-2011 6-2012 6-2013 6-2014 Current as of July 11, 2014. All data from the San Francisco MLS. Powered by 10K Research and Marketing. | Click for Cover Page | 15 Months Supply 2.3 1.7 - 26.1% -- -- -- Affordability Ratio 49 39 - 21.1% % of List Price Received 109.7% 110.8% + 1.0% 107.4% 48 72.9% + 6.1% + 2.2% 42 - 12.8% 109.8% % of Properties Sold Over List Price 76.0% 73.8% - 2.9% 68.7% Active Listings 1,124 824 - 26.7% -- Days on Market 37 31 - 16.2% 40 34 - 15.0% -- -- 6-2011 6-2012 6-2013 6-2014 6-2011 6-2012 6-2013 6-2014 6-2011 6-2012 6-2013 6-2014 6-2011 6-2012 6-2013 6-2014 6-2011 6-2012 6-2013 6-2014 6-2011 6-2012 6-2013 6-2014 6-2011 6-2012 6-2013 6-2014
- 16. Activity by District SF District 1: Northwest (Sea Cliff, Lake, Jordan Park / Laurel Heights, Outer Richmond, Central Richmond, Inner Richmond, Lone Mountain) SF District 2: Central West (Outer Sunset, Central Sunset, Inner Sunset, Outer Parkside, Parkside, Inner Parkside, Golden Gate Heights) SF District 3: Southwest (Pine Lake Park, Lake Shore, Merced Manor, Stonestown, Lakeside, Merced Heights, Ingleside, Ingleside Heights, Oceanview) SF District 4: Twin Peaks W (Forest Hill (& Ext), W Portal, St Francis Wd, Balboa Terr, Mt Dav Manor, Ingleside Terr, Monterey Hts, Wstwd Pk & H'lnds, Shrwd Fst, Miraloma Pk, Dmnd Hts, Mdtwn Terr) SF District 5: Central (Haight Ashbury, Cole Vly / Prnssus Hts, Clarndn Hts, Corona Hts, Twin Pks, Glen Pk, Noe Vly, Eureka Vly / Dolores Hts, Mission Dolores, Duboce Trngl, Buena Vista / Ashbury Hts) SF District 6: Central North (Lower Pacific Heights, Anza Vista, Western Addition, North Panhandle, Alamo Square, Hayes Valley) SF District 7: North (Marina, Cow Hollow, Presidio Heights, Pacific Heights) SF District 8: Northeast (North Waterfront, North Beach, Russian Hill, Telegraph Hill, Nob Hill, Financial District / Barbary Coast, Downtown, Van Ness / Civic Center, Tenderloin) SF District 9: Central East (Yerba Buena, South Beach, South of Market, Mission Bay, Inner Mission, Potrero Hill, Central Waterfront / Dogpatch, Bernal Heights) SF District 10: Southeast (Outer Mission, Mission Terr, Excelsior, Portola, Bayview, Silver Terr, Hunters Pt, Candlestick Pt, Bayview Hts, Little Hollywood, Visitation Vly, Crocker Amazon) 6-2013 6-2014 + / – 6-2013 6-2014 + / – 6-2013 6-2014 + / – 6-2013 6-2014 + / – 6-2013 6-2014 + / – Single Family 1 SF District 1 45 30 -33.3% 24 17 -29.2% $1,370,000 $1,625,000 +18.6% 45 21 -52.3% 2.5 1.7 -31.5% 2 SF District 2 78 53 -32.1% 48 30 -37.5% $822 500 $962 500 +17.0% 31 23 -26.0% 2 2 1 3 -39.1% Key metrics by report month for the districts of San Fransisco. Active Listings Sold Listings Median Sales Price Days on Market Months Supply 2 SF District 2 78 53 -32.1% 48 30 -37.5% $822,500 $962,500 +17.0% 31 23 -26.0% 2.2 1.3 -39.1% 3 SF District 3 37 40 +8.1% 21 9 -57.1% $665,000 $1,100,000 +65.4% 44 25 -43.8% 2.5 2.6 +7.5% 4 SF District 4 37 25 -32.4% 35 27 -22.9% $1,125,000 $1,400,000 +24.4% 30 29 -4.4% 1.3 1.0 -25.2% 5 SF District 5 49 38 -22.4% 43 27 -37.2% $1,525,000 $2,350,000 +54.1% 29 17 -39.9% 1.5 1.3 -15.4% 6 SF District 6 8 4 -50.0% 2 4 +100.0% $2,830,000 $2,912,500 +2.9% 25 31 +24.5% 1.9 1.0 -46.6% 7 SF District 7 31 24 -22.6% 9 14 +55.6% $3,200,000 $3,840,000 +20.0% 32 23 -27.6% 2.8 2.4 -12.7% 8 SF District 8 10 7 -30.0% 4 3 -25.0% $2,375,000 $2,757,000 +16.1% 30 76 +158.8% 3.5 3.2 -9.0% 9 SF District 9 43 32 -25.6% 27 9 -66.7% $1,175,000 $1,050,000 -10.6% 38 16 -59.3% 1.9 1.6 -19.5% 10 SF District 10 131 101 -22.9% 59 43 -27.1% $630,000 $710,000 +12.7% 39 36 -8.3% 2.5 2.4 -5.5% Condo/TIC/Coop 1 SF District 1 33 26 -21.2% 12 13 +8.3% $866,000 $1,000,000 +15.5% 25 32 +30.0% 2.5 2.1 -16.4% 2 SF District 2 18 6 -66.7% 4 9 +125.0% $545,000 $1,160,000 +112.8% 98 19 -81.0% 4.0 1.1 -73.0% 3 SF District 3 5 2 -60.0% 2 2 0.0% $390,000 $549,500 +40.9% 19 49 +164.9% 1.6 0.8 -52.1% 4 SF District 4 9 7 -22.2% 4 1 -75.0% $685,000 $810,000 +18.2% 44 47 +8.0% 1.9 1.4 -27.4% 5 SF District 5 77 53 -31.2% 49 49 0.0% $890,000 $1,125,000 +26.4% 42 25 -40.7% 1.8 1.3 -30.5% 6 SF District 6 50 52 +4.0% 26 17 -34.6% $720,500 $1,025,000 +42.3% 39 26 -33.4% 1.8 1.8 +1.6% 7 SF District 7 62 43 -30.6% 32 34 +6.3% $1,278,500 $1,317,500 +3.1% 35 32 -9.3% 2.0 1.6 -24.0% 8 SF District 8 141 82 -41.8% 43 49 +14.0% $830,000 $774,500 -6.7% 36 56 +56.2% 3.1 1.7 -44.6% 9 SF District 9 230 182 -20.9% 97 92 -5.2% $755,000 $899,500 +19.1% 38 31 -16.9% 2.6 1.8 -30.4% 10 SF District 10 30 17 -43.3% 8 5 -37.5% $476,500 $550,000 +15.4% 45 55 +21.2% 4.6 3.5 -22.8% Current as of July 11, 2014. All data from the San Francisco MLS. Powered by 10K Research and Marketing. | Click for Cover Page | 16