SlideShare a Scribd company logo
1 of 18
Ronny Budiutama                                                                                                                                                                              Intero Real Estate
                                                                             Median Sold Price by Quarter
                                                                    Q2 2009 vs. Q2 2012: The median sold price is up 4%


                                                                                  Q2 2009 vs. Q2 2012
                  Q2 2009                                            Q2 2012                                         Change                                              %
                  750,000                                            777,500                                         27,500                                             +4%


MLS: SFMLS        Period:   3 years (quarterly)           Price:   All                         Construction Type:    All            Bedrooms:    All             Bathrooms:       All   Lot Size: All
Property Types:   Residential                                                                                                                                                           Sq Ft:    All
Cities:           San Francisco


Clarus MarketMetrics®                                                                                       1 of 2                                                                                      08/13/2012
                                                  Information not guaranteed. © 2012 - 2013 Terradatum and its suppliers and licensors (www.terradatum.com/about/licensors.td).


                                                                                                                                                  1 of 18
Ronny Budiutama                                                                                                                                                        Intero Real Estate
                                                                  Median Sold Price by Quarter
                                                          Q2 2009 vs. Q2 2012: The median sold price is up 4%


Time Period             Median Price            # Units        Average DOM
Q2 2012                     777,500                 718                     53
Q1 2012                     670,000                 529                     68
Q4 2011                     670,000                 663                     58
Q3 2011                     697,620                 621                     63
Q2 2011                     718,500                 682                     63
Q1 2011                     660,000                 499                     71
Q4 2010                     728,000                 615                     60
Q3 2010                     729,000                 578                     58
Q2 2010                     774,000                 672                     54
Q1 2010                     734,000                 468                     61
Q4 2009                     769,000                 649                     57
Q3 2009                     739,000                 651                     58
Q2 2009                     750,000                 557                     65


Clarus MarketMetrics®                                                                            2 of 2                                                                          08/13/2012
                                       Information not guaranteed. © 2012 - 2013 Terradatum and its suppliers and licensors (www.terradatum.com/about/licensors.td).


                                                                                                                                        2 of 18
Ronny Budiutama                                                                                                                                                                                   Intero Real Estate
                                                                             Median For Sale vs. Median Sold
                  Q2 09 vs. Q2 12: The median price of for sale properties is down 4% and the median price of sold properties is up 4%


                          Q2 2009 vs. Q2 2012                                                                                                                           Q2 2009 vs. Q2 2012
     Q2 2009             Q2 2012                Change                        %                                                                     Q2 2009            Q2 2012             Change             %
     799,000             768,000                -31,000                      -4%                                                                    750,000            777,500             27,500            +4%


MLS: SFMLS           Period:   3 years (quarterly)            Price:   All                        Construction Type:    All             Bedrooms:    All            Bathrooms:       All     Lot Size: All
Property Types:      Residential                                                                                                                                                             Sq Ft:    All
Cities:              San Francisco


Clarus MarketMetrics®                                                                                          1 of 2                                                                                         08/13/2012
                                                     Information not guaranteed. © 2012 - 2013 Terradatum and its suppliers and licensors (www.terradatum.com/about/licensors.td).


                                                                                                                                                      3 of 18
Ronny Budiutama                                                                                                                                                    Intero Real Estate
                                                          Median For Sale vs. Median Sold
              Q2 09 vs. Q2 12: The median price of for sale properties is down 4% and the median price of sold properties is up 4%

                            For Sale             # Properties                         Sold                 # Properties                        Price
Time Period                  Median                  For Sale                       Median                        Sold                    Difference
Q2 2012                      768,000                     1,211                     777,500                           718                        9,500
Q1 2012                      699,000                     1,189                     670,000                           529                     -29,000
Q4 2011                      650,000                     1,281                     670,000                           663                      20,000
Q3 2011                      679,000                     1,685                     697,620                           621                      18,620
Q2 2011                      699,000                     1,550                     718,500                           682                      19,500
Q1 2011                      675,950                     1,393                     660,000                           499                     -15,950
Q4 2010                      699,000                     1,452                     728,000                           615                      29,000
Q3 2010                      728,900                     1,772                     729,000                           578                          100
Q2 2010                      749,000                     1,658                     774,000                           672                      25,000
Q1 2010                      757,900                     1,340                     734,000                           468                     -23,900
Q4 2009                      768,000                     1,233                     769,000                           649                        1,000
Q3 2009                      795,000                     1,552                     739,000                           651                     -56,000
Q2 2009                      799,000                     1,594                     750,000                           557                     -49,000


Clarus MarketMetrics®                                                                        2 of 2                                                                          08/13/2012
                                   Information not guaranteed. © 2012 - 2013 Terradatum and its suppliers and licensors (www.terradatum.com/about/licensors.td).


                                                                                                                                   4 of 18
Ronny Budiutama                                                                                                                                                                              Intero Real Estate
                                                                                Sold Properties by Quarter
                                                             Q2 2009 vs. Q2 2012: The number of Sold properties is up 29%


                                                                                  Q2 2009 vs. Q2 2012
                  Q2 2009                                             Q2 2012                                        Change                                              %
                    557                                                 718                                           161                                               +29%


MLS: SFMLS        Period:   3 years (quarterly)            Price:   All                        Construction Type:    All             Bedrooms:    All            Bathrooms:       All   Lot Size: All
Property Types:   Residential                                                                                                                                                           Sq Ft:    All
Cities:           San Francisco


Clarus MarketMetrics®                                                                                       1 of 2                                                                                      08/13/2012
                                                  Information not guaranteed. © 2012 - 2013 Terradatum and its suppliers and licensors (www.terradatum.com/about/licensors.td).


                                                                                                                                                   5 of 18
Ronny Budiutama                                                                                                                                                                      Intero Real Estate
                                                                      Sold Properties by Quarter
                                                   Q2 2009 vs. Q2 2012: The number of Sold properties is up 29%


                                       Full Market                                                 Bank Properties                                             Non-Bank Properties
Time Period             # Properties       Median Price         Average DOM              # Properties         % Bank            Median Price            # Properties    % Non-Bank        Median Price
Q2 2012                         718              777,500                     53                   121             16.9                480,200                    597          83.2            835,000
Q1 2012                         529              670,000                     68                   132             24.9                469,500                    397          75.0            749,000
Q4 2011                         663              670,000                     58                   117             17.6                450,000                    546          82.3            749,000
Q3 2011                         621              697,620                     63                   129             20.8                450,000                    492          79.2            772,500
Q2 2011                         682              718,500                     63                   133             19.5                450,000                    549          80.5            782,500
Q1 2011                         499              660,000                     71                   123             24.6                450,000                    376          75.3            740,000
Q4 2010                         615              728,000                     60                     95            15.4                480,000                    520          84.5            785,000
Q3 2010                         578              729,000                     58                   106             18.3                460,000                    472          81.7            787,000
Q2 2010                         672              774,000                     54                   124             18.4                520,000                    548          81.5            837,500
Q1 2010                         468              734,000                     61                   114             24.4                500,500                    354          75.6            789,500
Q4 2009                         649              769,000                     57                   111             17.1                485,000                    538          82.9            819,250
Q3 2009                         651              739,000                     58                   136             20.9                518,150                    515          79.1            805,000
Q2 2009                         557              750,000                     65                   104             18.7                467,500                    453          81.3            805,000


Clarus MarketMetrics®                                                                             2 of 2                                                                                        08/13/2012
                                        Information not guaranteed. © 2012 - 2013 Terradatum and its suppliers and licensors (www.terradatum.com/about/licensors.td).


                                                                                                                                         6 of 18
Ronny Budiutama                                                                                                                                                                              Intero Real Estate
                                                                    Under Contract Properties by Quarter
                                                     Q2 2009 vs. Q2 2012: The number of Under Contract properties is up 8%


                                                                                  Q2 2009 vs. Q2 2012
                  Q2 2009                                             Q2 2012                                        Change                                              %
                    665                                                 719                                            54                                               +8%


MLS: SFMLS        Period:   3 years (quarterly)            Price:   All                        Construction Type:    All             Bedrooms:    All            Bathrooms:       All   Lot Size: All
Property Types:   Residential                                                                                                                                                           Sq Ft:    All
Cities:           San Francisco


Clarus MarketMetrics®                                                                                       1 of 2                                                                                      08/13/2012
                                                  Information not guaranteed. © 2012 - 2013 Terradatum and its suppliers and licensors (www.terradatum.com/about/licensors.td).


                                                                                                                                                   7 of 18
Ronny Budiutama                                                                                                                                                                      Intero Real Estate
                                                         Under Contract Properties by Quarter
                                           Q2 2009 vs. Q2 2012: The number of Under Contract properties is up 8%


                                       Full Market                                                 Bank Properties                                             Non-Bank Properties
Time Period             # Properties       Median Price         Average DOM              # Properties         % Bank            Median Price            # Properties    % Non-Bank        Median Price
Q2 2012                         719              715,000                     46                   136             18.9                452,250                    583          81.1            799,000
Q1 2012                         638              699,000                     58                   150             23.5                429,900                    488          76.5            791,944
Q4 2011                         602              627,000                     70                   144             23.9                457,000                    458          76.1            699,000
Q3 2011                         660              680,111                     60                   130             19.7                441,628                    530          80.3            754,500
Q2 2011                         674              721,000                     59                   117             17.4                457,000                    557          82.6            795,000
Q1 2011                         571              695,000                     71                   154             27.0                446,600                    417          73.0            790,000
Q4 2010                         555              699,000                     68                   100             18.0                460,400                    455          82.0            749,000
Q3 2010                         590              719,250                     60                   113             19.1                468,000                    477          80.8            779,000
Q2 2010                         679              750,000                     56                   118             17.4                466,250                    561          82.6            799,000
Q1 2010                         543              750,000                     53                   116             21.4                461,610                    427          78.6            799,000
Q4 2009                         548              747,000                     62                   112             20.4                452,670                    436          79.6            799,000
Q3 2009                         633              718,000                     56                   125             19.8                499,900                    508          80.2            799,000
Q2 2009                         665              778,000                     63                   123             18.5                475,000                    542          81.5            839,000


Clarus MarketMetrics®                                                                             2 of 2                                                                                        08/13/2012
                                        Information not guaranteed. © 2012 - 2013 Terradatum and its suppliers and licensors (www.terradatum.com/about/licensors.td).


                                                                                                                                         8 of 18
Ronny Budiutama                                                                                                                                                                              Intero Real Estate
                                                                                New Properties by Quarter
                                                           Q2 2009 vs. Q2 2012: The number of New properties is down 16%


                                                                                  Q2 2009 vs. Q2 2012
                  Q2 2009                                             Q2 2012                                        Change                                               %
                    927                                                 781                                           -146                                              -16%


MLS: SFMLS        Period:   3 years (quarterly)            Price:   All                        Construction Type:    All             Bedrooms:    All            Bathrooms:       All   Lot Size: All
Property Types:   Residential                                                                                                                                                           Sq Ft:    All
Cities:           San Francisco


Clarus MarketMetrics®                                                                                       1 of 2                                                                                      08/13/2012
                                                  Information not guaranteed. © 2012 - 2013 Terradatum and its suppliers and licensors (www.terradatum.com/about/licensors.td).


                                                                                                                                                   9 of 18
Ronny Budiutama                                                                                                                                                                   Intero Real Estate
                                                                     New Properties by Quarter
                                                Q2 2009 vs. Q2 2012: The number of New properties is down 16%


                            Full Market                                    Bank Properties                                             Non-Bank Properties
Time Period             # Properties      Median Price            # Properties         % Bank             Median Price          # Properties       % Non-Bank          Median Price
Q2 2012                         781             795,000                    119            15.2                469,000                     662               84.8           877,000
Q1 2012                         807             725,000                    161            19.9                420,000                     646               80.0           799,000
Q4 2011                         532             649,000                    138            25.9                450,000                     394               74.1           699,754
Q3 2011                       1,016             699,000                    194            19.1                475,000                     822               80.9           759,000
Q2 2011                         921             699,880                    186            20.2                438,622                     735               79.8           799,000
Q1 2011                         906             695,000                    216            23.8                449,975                     690               76.2           790,500
Q4 2010                         621             679,000                    154            24.8                456,950                     467               75.2           768,000
Q3 2010                       1,051             720,000                    180            17.1                459,450                     871               82.9           775,000
Q2 2010                       1,050             749,000                    190            18.1                461,700                     860               81.9           799,000
Q1 2010                         946             769,000                    185            19.6                515,000                     761               80.4           819,000
Q4 2009                         592             729,000                    149            25.2                450,000                     443               74.8           799,000
Q3 2009                         882             777,000                    153            17.4                497,000                     729               82.7           839,000
Q2 2009                         927             785,000                    186            20.1                498,950                     741               79.9           879,000


Clarus MarketMetrics®                                                                            2 of 2                                                                                     08/13/2012
                                       Information not guaranteed. © 2012 - 2013 Terradatum and its suppliers and licensors (www.terradatum.com/about/licensors.td).


                                                                                                                                       10 of 18
Ronny Budiutama                                                                                                                                                                              Intero Real Estate
                                                                            For Sale Properties by Quarter
                                                        Q2 2009 vs. Q2 2012: The number of For Sale properties is down 24%


                                                                                  Q2 2009 vs. Q2 2012
                  Q2 2009                                             Q2 2012                                        Change                                               %
                   1,594                                               1,211                                          -383                                              -24%


MLS: SFMLS        Period:   3 years (quarterly)            Price:   All                        Construction Type:    All             Bedrooms:    All            Bathrooms:       All   Lot Size: All
Property Types:   Residential                                                                                                                                                           Sq Ft:    All
Cities:           San Francisco


Clarus MarketMetrics®                                                                                       1 of 2                                                                                      08/13/2012
                                                  Information not guaranteed. © 2012 - 2013 Terradatum and its suppliers and licensors (www.terradatum.com/about/licensors.td).


                                                                                                                                                  11 of 18
Ronny Budiutama                                                                                                                                                                      Intero Real Estate
                                                                  For Sale Properties by Quarter
                                             Q2 2009 vs. Q2 2012: The number of For Sale properties is down 24%


                                       Full Market                                                 Bank Properties                                             Non-Bank Properties
Time Period             # Properties       Median Price         Average DOM              # Properties         % Bank            Median Price            # Properties    % Non-Bank        Median Price
Q2 2012                       1,211              768,000                     58                   229             18.9                460,800                    982          81.1            871,500
Q1 2012                       1,189              699,000                     70                   297             25.0                446,299                    892          75.0            799,000
Q4 2011                       1,281              650,000                     88                   342             26.7                459,000                    939          73.3            749,000
Q3 2011                       1,685              679,000                     70                   399             23.7                450,000                  1,286          76.3            761,500
Q2 2011                       1,550              699,000                     69                   365             23.6                448,888                  1,185          76.5            797,888
Q1 2011                       1,393              675,950                     75                   381             27.4                449,000                  1,012          72.7            788,000
Q4 2010                       1,452              699,000                     87                   325             22.4                450,000                  1,127          77.6            775,000
Q3 2010                       1,772              728,900                     68                   350             19.8                459,450                  1,422          80.2            799,000
Q2 2010                       1,658              749,000                     63                   345             20.8                469,000                  1,313          79.2            830,000
Q1 2010                       1,340              757,900                     64                   311             23.2                475,000                  1,029          76.8            849,000
Q4 2009                       1,233              768,000                     80                   286             23.2                468,950                    947          76.8            868,888
Q3 2009                       1,552              795,000                     67                   315             20.3                499,000                  1,237          79.7            879,000
Q2 2009                       1,594              799,000                     68                   345             21.6                499,000                  1,249          78.4            899,000


Clarus MarketMetrics®                                                                             2 of 2                                                                                        08/13/2012
                                        Information not guaranteed. © 2012 - 2013 Terradatum and its suppliers and licensors (www.terradatum.com/about/licensors.td).


                                                                                                                                        12 of 18
Ronny Budiutama                                                                                                                                                                              Intero Real Estate
                                                                            Expired Properties by Quarter
                                                        Q2 2009 vs. Q2 2012: The number of Expired properties is down 42%


                                                                                  Q2 2009 vs. Q2 2012
                  Q2 2009                                             Q2 2012                                        Change                                               %
                    259                                                 149                                           -110                                              -42%


MLS: SFMLS        Period:   3 years (quarterly)            Price:   All                        Construction Type:    All             Bedrooms:    All            Bathrooms:       All   Lot Size: All
Property Types:   Residential                                                                                                                                                           Sq Ft:    All
Cities:           San Francisco


Clarus MarketMetrics®                                                                                       1 of 2                                                                                      08/13/2012
                                                  Information not guaranteed. © 2012 - 2013 Terradatum and its suppliers and licensors (www.terradatum.com/about/licensors.td).


                                                                                                                                                  13 of 18
Ronny Budiutama                                                                                                                                                                      Intero Real Estate
                                                                  Expired Properties by Quarter
                                              Q2 2009 vs. Q2 2012: The number of Expired properties is down 42%


                                       Full Market                                                 Bank Properties                                             Non-Bank Properties
Time Period             # Properties      Median Price          Average DOM             # Properties          % Bank           Median Price            # Properties     % Non-Bank       Median Price
Q2 2012                         149              749,000                     74                     41            27.5                455,000                    108          72.5           944,000
Q1 2012                         121              649,000                    111                     37            30.6                459,000                     84          69.4           799,495
Q4 2011                         297              699,000                    105                     62            20.9                453,900                    235          79.1           764,000
Q3 2011                         276              699,000                     96                     65            23.6                435,000                    211          76.5           799,000
Q2 2011                         207              749,000                    110                     43            20.8                425,000                    164          79.2           809,500
Q1 2011                         193              675,000                    115                     48            24.9                479,500                    145          75.1           789,000
Q4 2010                         410              748,500                    108                     60            14.6                462,500                    350          85.4           799,000
Q3 2010                         351              799,000                     99                     66            18.8                499,000                    285          81.2           849,000
Q2 2010                         258              749,250                     89                     57            22.1                478,000                    201          77.9           875,000
Q1 2010                         189              799,000                    106                     40            21.2                525,000                    149          78.8           879,000
Q4 2009                         291              959,000                    102                     48            16.5                512,750                    243          83.5          1,095,000
Q3 2009                         278              877,000                    101                     53            19.1                499,000                    225          80.9           979,950
Q2 2009                         259              974,500                    102                     60            23.2                567,450                    199          76.8          1,098,000


Clarus MarketMetrics®                                                                             2 of 2                                                                                        08/13/2012
                                        Information not guaranteed. © 2012 - 2013 Terradatum and its suppliers and licensors (www.terradatum.com/about/licensors.td).


                                                                                                                                        14 of 18
Ronny Budiutama                                                                                                                                                                                 Intero Real Estate
                                                                              Supply & Demand by Quarter
                  Q2 2009 vs. Q2 2012: The number of for sale properties is down 24% and the number of sold properties is up 29%


                        Q2 2009 vs. Q2 2012                                                                                                                           Q2 2009 vs. Q2 2012
     Q2 2009           Q2 2012                Change                         %                                                                    Q2 2009            Q2 2012             Change             %
      1,594             1,211                  -383                        -24%                                                                     557                718                161              +29%


MLS: SFMLS         Period:   3 years (quarterly)            Price:   All                        Construction Type:    All             Bedrooms:    All            Bathrooms:       All     Lot Size: All
Property Types:    Residential                                                                                                                                                             Sq Ft:    All
Cities:            San Francisco


Clarus MarketMetrics®                                                                                        1 of 2                                                                                         08/13/2012
                                                   Information not guaranteed. © 2012 - 2013 Terradatum and its suppliers and licensors (www.terradatum.com/about/licensors.td).


                                                                                                                                                   15 of 18
Ronny Budiutama                                                                                                                                                    Intero Real Estate
                                                              Supply & Demand by Quarter
              Q2 2009 vs. Q2 2012: The number of for sale properties is down 24% and the number of sold properties is up 29%

                        # Properties           Average DOM                    # Properties               Average DOM
Time Period                 For Sale                For Sale                         Sold                        Sold
Q2 2012                       1,211                          58                         718                           53
Q1 2012                       1,189                          70                         529                           68
Q4 2011                       1,281                          88                         663                           58
Q3 2011                       1,685                          70                         621                           63
Q2 2011                       1,550                          69                         682                           63
Q1 2011                       1,393                          75                         499                           71
Q4 2010                       1,452                          87                         615                           60
Q3 2010                       1,772                          68                         578                           58
Q2 2010                       1,658                          63                         672                           54
Q1 2010                       1,340                          64                         468                           61
Q4 2009                       1,233                          80                         649                           57
Q3 2009                       1,552                          67                         651                           58
Q2 2009                       1,594                          68                         557                           65


Clarus MarketMetrics®                                                                         2 of 2                                                                         08/13/2012
                                   Information not guaranteed. © 2012 - 2013 Terradatum and its suppliers and licensors (www.terradatum.com/about/licensors.td).


                                                                                                                                  16 of 18
Ronny Budiutama                                                                                                                                                                              Intero Real Estate
                                                                    The Average Days on Market by Quarter
                                                            Q2 2009 vs. Q2 2012: The average days on market is down 27%


                                                                                  Q2 2009 vs. Q2 2012
                  Q2 2009                                             Q2 2012                                        Change                                               %
                    63                                                  46                                             -17                                              -27%


MLS: SFMLS        Period:   3 years (quarterly)            Price:   All                        Construction Type:    All             Bedrooms:    All            Bathrooms:       All   Lot Size: All
Property Types:   Residential                                                                                                                                                           Sq Ft:    All
Cities:           San Francisco


Clarus MarketMetrics®                                                                                       1 of 2                                                                                      08/13/2012
                                                  Information not guaranteed. © 2012 - 2013 Terradatum and its suppliers and licensors (www.terradatum.com/about/licensors.td).


                                                                                                                                                  17 of 18
Ronny Budiutama                                                                                                                                                       Intero Real Estate
                                                    The Average Days on Market by Quarter
                                                Q2 2009 vs. Q2 2012: The average days on market is down 27%


Time Period             Average DOM       # UC Units
Q2 2012                          46               719
Q1 2012                          58               638
Q4 2011                          70               602
Q3 2011                          60               660
Q2 2011                          59               674
Q1 2011                          71               571
Q4 2010                          68               555
Q3 2010                          60               590
Q2 2010                          56               679
Q1 2010                          53               543
Q4 2009                          62               548
Q3 2009                          56               633
Q2 2009                          63               665


Clarus MarketMetrics®                                                                           2 of 2                                                                          08/13/2012
                                      Information not guaranteed. © 2012 - 2013 Terradatum and its suppliers and licensors (www.terradatum.com/about/licensors.td).


                                                                                                                                      18 of 18

More Related Content

What's hot

2012 webcast presentation
2012 webcast presentation2012 webcast presentation
2012 webcast presentationbcfund
 
Retail mania in india
Retail mania in indiaRetail mania in india
Retail mania in indiavinay jha
 
Pdf version for flash drive torto_utah -august 14v1
Pdf version for flash drive  torto_utah -august 14v1Pdf version for flash drive  torto_utah -august 14v1
Pdf version for flash drive torto_utah -august 14v1raymondtorto
 
petsmart AR02
petsmart  AR02petsmart  AR02
petsmart AR02finance49
 
Cleantech 3.0: Urbanization and Supply Chains Ontario and Masdar as Transfo...
Cleantech 3.0: Urbanization and Supply Chains Ontario and Masdar as Transfo...Cleantech 3.0: Urbanization and Supply Chains Ontario and Masdar as Transfo...
Cleantech 3.0: Urbanization and Supply Chains Ontario and Masdar as Transfo...MaRS Discovery District
 
Tres Vista Weekly Me 08 06 09
Tres Vista Weekly Me 08 06 09Tres Vista Weekly Me 08 06 09
Tres Vista Weekly Me 08 06 09guest6046f91
 
CDON Group October roadshow
CDON Group October roadshowCDON Group October roadshow
CDON Group October roadshowQliro Group AB
 
Tres Vista Weekly Me 08 20 09
Tres Vista Weekly Me 08 20 09Tres Vista Weekly Me 08 20 09
Tres Vista Weekly Me 08 20 09guest6046f91
 
British Airways - Accounting for Operating Leases
British Airways - Accounting for Operating LeasesBritish Airways - Accounting for Operating Leases
British Airways - Accounting for Operating LeasesJorge Schnura
 
Indo luxehotel jogja - copy
Indo luxehotel jogja - copyIndo luxehotel jogja - copy
Indo luxehotel jogja - copyrudikelana
 

What's hot (13)

2012 webcast presentation
2012 webcast presentation2012 webcast presentation
2012 webcast presentation
 
TresVista Weekly MENA 26-11-09
TresVista Weekly MENA 26-11-09TresVista Weekly MENA 26-11-09
TresVista Weekly MENA 26-11-09
 
Retail mania in india
Retail mania in indiaRetail mania in india
Retail mania in india
 
Pdf version for flash drive torto_utah -august 14v1
Pdf version for flash drive  torto_utah -august 14v1Pdf version for flash drive  torto_utah -august 14v1
Pdf version for flash drive torto_utah -august 14v1
 
Westfiel
WestfielWestfiel
Westfiel
 
petsmart AR02
petsmart  AR02petsmart  AR02
petsmart AR02
 
Mttp
MttpMttp
Mttp
 
Cleantech 3.0: Urbanization and Supply Chains Ontario and Masdar as Transfo...
Cleantech 3.0: Urbanization and Supply Chains Ontario and Masdar as Transfo...Cleantech 3.0: Urbanization and Supply Chains Ontario and Masdar as Transfo...
Cleantech 3.0: Urbanization and Supply Chains Ontario and Masdar as Transfo...
 
Tres Vista Weekly Me 08 06 09
Tres Vista Weekly Me 08 06 09Tres Vista Weekly Me 08 06 09
Tres Vista Weekly Me 08 06 09
 
CDON Group October roadshow
CDON Group October roadshowCDON Group October roadshow
CDON Group October roadshow
 
Tres Vista Weekly Me 08 20 09
Tres Vista Weekly Me 08 20 09Tres Vista Weekly Me 08 20 09
Tres Vista Weekly Me 08 20 09
 
British Airways - Accounting for Operating Leases
British Airways - Accounting for Operating LeasesBritish Airways - Accounting for Operating Leases
British Airways - Accounting for Operating Leases
 
Indo luxehotel jogja - copy
Indo luxehotel jogja - copyIndo luxehotel jogja - copy
Indo luxehotel jogja - copy
 

Similar to SF Home Prices Up 4% Since 2009

SANTANDER MEXICO-SANTANDER INVESTOR DAY 2011
SANTANDER MEXICO-SANTANDER INVESTOR DAY 2011SANTANDER MEXICO-SANTANDER INVESTOR DAY 2011
SANTANDER MEXICO-SANTANDER INVESTOR DAY 2011BANCO SANTANDER
 
Industry analysis of the real estate sector
Industry analysis of the real estate sectorIndustry analysis of the real estate sector
Industry analysis of the real estate sectorArunav Nayak
 
Mv q4 09
Mv q4 09Mv q4 09
Mv q4 09cjdente
 
San francisco Real Estate Market June 2010 - June 2012
San francisco Real Estate Market June 2010 - June 2012San francisco Real Estate Market June 2010 - June 2012
San francisco Real Estate Market June 2010 - June 2012Ronny Budiutama
 
City report - Mumbai Office Market - Q3 2010
City report - Mumbai Office Market - Q3 2010City report - Mumbai Office Market - Q3 2010
City report - Mumbai Office Market - Q3 2010BNP Paribas Real Estate
 
San Francisco Residential Market July 2010 - July 2012
San Francisco Residential Market July 2010 - July 2012San Francisco Residential Market July 2010 - July 2012
San Francisco Residential Market July 2010 - July 2012Ronny Budiutama
 
Citi habitats 4q ye 2009 report
Citi habitats 4q ye 2009 report Citi habitats 4q ye 2009 report
Citi habitats 4q ye 2009 report cjdente
 
TREB Condo Report Q4 2012
TREB Condo Report Q4 2012TREB Condo Report Q4 2012
TREB Condo Report Q4 2012Chaba Tamasi
 
1Q09 Earnings Presentation
1Q09 Earnings Presentation1Q09 Earnings Presentation
1Q09 Earnings PresentationPDG Realty
 
2015 NAR Commercial Report
2015 NAR Commercial Report2015 NAR Commercial Report
2015 NAR Commercial Reportbhamrealtors
 
Toronto Real Estate Statistics september 2011
Toronto Real Estate Statistics september 2011Toronto Real Estate Statistics september 2011
Toronto Real Estate Statistics september 2011John Helfrich
 
Condo Report OCT 2012
Condo Report OCT 2012Condo Report OCT 2012
Condo Report OCT 2012Chaba Tamasi
 

Similar to SF Home Prices Up 4% Since 2009 (20)

SANTANDER MEXICO-SANTANDER INVESTOR DAY 2011
SANTANDER MEXICO-SANTANDER INVESTOR DAY 2011SANTANDER MEXICO-SANTANDER INVESTOR DAY 2011
SANTANDER MEXICO-SANTANDER INVESTOR DAY 2011
 
Greater Toronto REALTORS Rental Report for Q2, 2012
Greater Toronto REALTORS Rental Report for Q2, 2012Greater Toronto REALTORS Rental Report for Q2, 2012
Greater Toronto REALTORS Rental Report for Q2, 2012
 
IPD 2009 Residential Index Presentation
IPD 2009 Residential Index PresentationIPD 2009 Residential Index Presentation
IPD 2009 Residential Index Presentation
 
Industry analysis of the real estate sector
Industry analysis of the real estate sectorIndustry analysis of the real estate sector
Industry analysis of the real estate sector
 
Mv q4 09
Mv q4 09Mv q4 09
Mv q4 09
 
Greater Toronto REALTORS Condo Report for Q2, 2012
Greater Toronto REALTORS Condo Report for Q2, 2012Greater Toronto REALTORS Condo Report for Q2, 2012
Greater Toronto REALTORS Condo Report for Q2, 2012
 
San francisco Real Estate Market June 2010 - June 2012
San francisco Real Estate Market June 2010 - June 2012San francisco Real Estate Market June 2010 - June 2012
San francisco Real Estate Market June 2010 - June 2012
 
Commercial Market Watch
Commercial Market WatchCommercial Market Watch
Commercial Market Watch
 
City report - Mumbai Office Market - Q3 2010
City report - Mumbai Office Market - Q3 2010City report - Mumbai Office Market - Q3 2010
City report - Mumbai Office Market - Q3 2010
 
San Francisco Residential Market July 2010 - July 2012
San Francisco Residential Market July 2010 - July 2012San Francisco Residential Market July 2010 - July 2012
San Francisco Residential Market July 2010 - July 2012
 
ApresentaçãO Resultados Eng 4 T09 Final
ApresentaçãO Resultados Eng 4 T09 FinalApresentaçãO Resultados Eng 4 T09 Final
ApresentaçãO Resultados Eng 4 T09 Final
 
Citi habitats 4q ye 2009 report
Citi habitats 4q ye 2009 report Citi habitats 4q ye 2009 report
Citi habitats 4q ye 2009 report
 
TREB Condo Report Q4 2012
TREB Condo Report Q4 2012TREB Condo Report Q4 2012
TREB Condo Report Q4 2012
 
Greater Toronto REALTORS 4Th Quarter Condo Sales 2012. Condominium Sales in T...
Greater Toronto REALTORS 4Th Quarter Condo Sales 2012. Condominium Sales in T...Greater Toronto REALTORS 4Th Quarter Condo Sales 2012. Condominium Sales in T...
Greater Toronto REALTORS 4Th Quarter Condo Sales 2012. Condominium Sales in T...
 
Market Watch March 2012
Market Watch March 2012Market Watch March 2012
Market Watch March 2012
 
FEB 2020 COMMERCIAL REAL ESTATE OUTLOOK AND TRENDS
FEB 2020 COMMERCIAL REAL ESTATE OUTLOOK AND TRENDSFEB 2020 COMMERCIAL REAL ESTATE OUTLOOK AND TRENDS
FEB 2020 COMMERCIAL REAL ESTATE OUTLOOK AND TRENDS
 
1Q09 Earnings Presentation
1Q09 Earnings Presentation1Q09 Earnings Presentation
1Q09 Earnings Presentation
 
2015 NAR Commercial Report
2015 NAR Commercial Report2015 NAR Commercial Report
2015 NAR Commercial Report
 
Toronto Real Estate Statistics september 2011
Toronto Real Estate Statistics september 2011Toronto Real Estate Statistics september 2011
Toronto Real Estate Statistics september 2011
 
Condo Report OCT 2012
Condo Report OCT 2012Condo Report OCT 2012
Condo Report OCT 2012
 

More from Ronny Budiutama

San Francisco January 2024 Market Report
San Francisco January 2024 Market ReportSan Francisco January 2024 Market Report
San Francisco January 2024 Market ReportRonny Budiutama
 
San Francisco December 2023 Market Report
San Francisco December 2023 Market ReportSan Francisco December 2023 Market Report
San Francisco December 2023 Market ReportRonny Budiutama
 
San Francisco November 2023 Market Report
San Francisco November 2023 Market ReportSan Francisco November 2023 Market Report
San Francisco November 2023 Market ReportRonny Budiutama
 
2023 Annual San Francisco Housing Market
2023 Annual San Francisco Housing Market2023 Annual San Francisco Housing Market
2023 Annual San Francisco Housing MarketRonny Budiutama
 
October 2023 Report: San Francisco Real Estate Market Insights
October 2023 Report: San Francisco Real Estate Market InsightsOctober 2023 Report: San Francisco Real Estate Market Insights
October 2023 Report: San Francisco Real Estate Market InsightsRonny Budiutama
 
CA Weekly MLS Market Data Report - August 2023
CA Weekly MLS Market Data Report - August 2023CA Weekly MLS Market Data Report - August 2023
CA Weekly MLS Market Data Report - August 2023Ronny Budiutama
 
San Francisco Market Report July 2023.pdf
San Francisco Market Report July 2023.pdfSan Francisco Market Report July 2023.pdf
San Francisco Market Report July 2023.pdfRonny Budiutama
 
San Francisco May 2023 Market Report.pdf
San Francisco May 2023 Market Report.pdfSan Francisco May 2023 Market Report.pdf
San Francisco May 2023 Market Report.pdfRonny Budiutama
 
San Francisco June 2023 Market Report.pdf
San Francisco June 2023 Market Report.pdfSan Francisco June 2023 Market Report.pdf
San Francisco June 2023 Market Report.pdfRonny Budiutama
 
San Francisco Market Report March 2023.pdf
San Francisco Market Report March 2023.pdfSan Francisco Market Report March 2023.pdf
San Francisco Market Report March 2023.pdfRonny Budiutama
 
San Francisco Market Report February 2023
San Francisco Market Report February 2023San Francisco Market Report February 2023
San Francisco Market Report February 2023Ronny Budiutama
 
San Francisco Market Report January 2023.pdf
San Francisco Market Report January 2023.pdfSan Francisco Market Report January 2023.pdf
San Francisco Market Report January 2023.pdfRonny Budiutama
 
Annual Report on the San Francisco County Housing Market.pdf
Annual Report on the San Francisco County Housing Market.pdfAnnual Report on the San Francisco County Housing Market.pdf
Annual Report on the San Francisco County Housing Market.pdfRonny Budiutama
 
San Francisco Market Report December 2022.pdf
San Francisco Market Report December 2022.pdfSan Francisco Market Report December 2022.pdf
San Francisco Market Report December 2022.pdfRonny Budiutama
 
San Francisco Market Report November 2022.pdf
San Francisco Market Report November 2022.pdfSan Francisco Market Report November 2022.pdf
San Francisco Market Report November 2022.pdfRonny Budiutama
 
San Francisco Market Report October 2022.pdf
San Francisco Market Report October 2022.pdfSan Francisco Market Report October 2022.pdf
San Francisco Market Report October 2022.pdfRonny Budiutama
 
San Francisco Market Report September 2022.pdf
San Francisco Market Report September 2022.pdfSan Francisco Market Report September 2022.pdf
San Francisco Market Report September 2022.pdfRonny Budiutama
 
San Francisco Market Report August 2022.pdf
San Francisco Market Report August 2022.pdfSan Francisco Market Report August 2022.pdf
San Francisco Market Report August 2022.pdfRonny Budiutama
 
San Francisco Market Report July 2022.pdf
San Francisco Market Report July 2022.pdfSan Francisco Market Report July 2022.pdf
San Francisco Market Report July 2022.pdfRonny Budiutama
 
San Francisco Market Report June 2022.pdf
San Francisco Market Report June 2022.pdfSan Francisco Market Report June 2022.pdf
San Francisco Market Report June 2022.pdfRonny Budiutama
 

More from Ronny Budiutama (20)

San Francisco January 2024 Market Report
San Francisco January 2024 Market ReportSan Francisco January 2024 Market Report
San Francisco January 2024 Market Report
 
San Francisco December 2023 Market Report
San Francisco December 2023 Market ReportSan Francisco December 2023 Market Report
San Francisco December 2023 Market Report
 
San Francisco November 2023 Market Report
San Francisco November 2023 Market ReportSan Francisco November 2023 Market Report
San Francisco November 2023 Market Report
 
2023 Annual San Francisco Housing Market
2023 Annual San Francisco Housing Market2023 Annual San Francisco Housing Market
2023 Annual San Francisco Housing Market
 
October 2023 Report: San Francisco Real Estate Market Insights
October 2023 Report: San Francisco Real Estate Market InsightsOctober 2023 Report: San Francisco Real Estate Market Insights
October 2023 Report: San Francisco Real Estate Market Insights
 
CA Weekly MLS Market Data Report - August 2023
CA Weekly MLS Market Data Report - August 2023CA Weekly MLS Market Data Report - August 2023
CA Weekly MLS Market Data Report - August 2023
 
San Francisco Market Report July 2023.pdf
San Francisco Market Report July 2023.pdfSan Francisco Market Report July 2023.pdf
San Francisco Market Report July 2023.pdf
 
San Francisco May 2023 Market Report.pdf
San Francisco May 2023 Market Report.pdfSan Francisco May 2023 Market Report.pdf
San Francisco May 2023 Market Report.pdf
 
San Francisco June 2023 Market Report.pdf
San Francisco June 2023 Market Report.pdfSan Francisco June 2023 Market Report.pdf
San Francisco June 2023 Market Report.pdf
 
San Francisco Market Report March 2023.pdf
San Francisco Market Report March 2023.pdfSan Francisco Market Report March 2023.pdf
San Francisco Market Report March 2023.pdf
 
San Francisco Market Report February 2023
San Francisco Market Report February 2023San Francisco Market Report February 2023
San Francisco Market Report February 2023
 
San Francisco Market Report January 2023.pdf
San Francisco Market Report January 2023.pdfSan Francisco Market Report January 2023.pdf
San Francisco Market Report January 2023.pdf
 
Annual Report on the San Francisco County Housing Market.pdf
Annual Report on the San Francisco County Housing Market.pdfAnnual Report on the San Francisco County Housing Market.pdf
Annual Report on the San Francisco County Housing Market.pdf
 
San Francisco Market Report December 2022.pdf
San Francisco Market Report December 2022.pdfSan Francisco Market Report December 2022.pdf
San Francisco Market Report December 2022.pdf
 
San Francisco Market Report November 2022.pdf
San Francisco Market Report November 2022.pdfSan Francisco Market Report November 2022.pdf
San Francisco Market Report November 2022.pdf
 
San Francisco Market Report October 2022.pdf
San Francisco Market Report October 2022.pdfSan Francisco Market Report October 2022.pdf
San Francisco Market Report October 2022.pdf
 
San Francisco Market Report September 2022.pdf
San Francisco Market Report September 2022.pdfSan Francisco Market Report September 2022.pdf
San Francisco Market Report September 2022.pdf
 
San Francisco Market Report August 2022.pdf
San Francisco Market Report August 2022.pdfSan Francisco Market Report August 2022.pdf
San Francisco Market Report August 2022.pdf
 
San Francisco Market Report July 2022.pdf
San Francisco Market Report July 2022.pdfSan Francisco Market Report July 2022.pdf
San Francisco Market Report July 2022.pdf
 
San Francisco Market Report June 2022.pdf
San Francisco Market Report June 2022.pdfSan Francisco Market Report June 2022.pdf
San Francisco Market Report June 2022.pdf
 

Recently uploaded

Call Girls In Hari Nagar Dadb Block {8447779280}Hari Nagar {West Delhi Escort...
Call Girls In Hari Nagar Dadb Block {8447779280}Hari Nagar {West Delhi Escort...Call Girls In Hari Nagar Dadb Block {8447779280}Hari Nagar {West Delhi Escort...
Call Girls In Hari Nagar Dadb Block {8447779280}Hari Nagar {West Delhi Escort...asmaqueen5
 
Eco-Efficient Living: Redefining Sustainability through Leech's Green Design ...
Eco-Efficient Living: Redefining Sustainability through Leech's Green Design ...Eco-Efficient Living: Redefining Sustainability through Leech's Green Design ...
Eco-Efficient Living: Redefining Sustainability through Leech's Green Design ...Newman George Leech
 
Call Girls In Mundka Industrial Metro@꧂8447779280 ↬Enjoy ꧂Escort Service in ...
Call Girls In Mundka Industrial Metro@꧂8447779280 ↬Enjoy ꧂Escort Service in  ...Call Girls In Mundka Industrial Metro@꧂8447779280 ↬Enjoy ꧂Escort Service in  ...
Call Girls In Mundka Industrial Metro@꧂8447779280 ↬Enjoy ꧂Escort Service in ...asmaqueen5
 
call girls in Shahdara (DELHI) 🔝 >༒9953330565🔝 genuine Escort Service 🔝✔️✔️
call girls in Shahdara (DELHI) 🔝 >༒9953330565🔝 genuine Escort Service 🔝✔️✔️call girls in Shahdara (DELHI) 🔝 >༒9953330565🔝 genuine Escort Service 🔝✔️✔️
call girls in Shahdara (DELHI) 🔝 >༒9953330565🔝 genuine Escort Service 🔝✔️✔️9953056974 Low Rate Call Girls In Saket, Delhi NCR
 
Purva Palm Hills Devanahalli, Bangalore E- Brochure.pdf
Purva Palm Hills Devanahalli, Bangalore E- Brochure.pdfPurva Palm Hills Devanahalli, Bangalore E- Brochure.pdf
Purva Palm Hills Devanahalli, Bangalore E- Brochure.pdffaheemali990101
 
Building Dreams: Newman Leech's Visionary Approach to Real Estate Investment
Building Dreams: Newman Leech's Visionary Approach to Real Estate InvestmentBuilding Dreams: Newman Leech's Visionary Approach to Real Estate Investment
Building Dreams: Newman Leech's Visionary Approach to Real Estate InvestmentNewman George Leech
 
Call Girls in Nehru Place Delhi 💯Call Us 🔝8264348440🔝
Call Girls in Nehru Place Delhi 💯Call Us 🔝8264348440🔝Call Girls in Nehru Place Delhi 💯Call Us 🔝8264348440🔝
Call Girls in Nehru Place Delhi 💯Call Us 🔝8264348440🔝soniya singh
 
Call Girls In Vasundhara Ghaziabad ❤️8860477959 Low Rate Escorts Service In 2...
Call Girls In Vasundhara Ghaziabad ❤️8860477959 Low Rate Escorts Service In 2...Call Girls In Vasundhara Ghaziabad ❤️8860477959 Low Rate Escorts Service In 2...
Call Girls In Vasundhara Ghaziabad ❤️8860477959 Low Rate Escorts Service In 2...lizamodels9
 
8 Key Elements for Comfortable Farmland Living
8 Key Elements for Comfortable Farmland Living 8 Key Elements for Comfortable Farmland Living
8 Key Elements for Comfortable Farmland Living Farmland Bazaar
 
9711199012 Call {Girls Delhi} Very Low rate Vaishali DownLoad PDF
9711199012 Call {Girls Delhi} Very Low rate Vaishali DownLoad PDF9711199012 Call {Girls Delhi} Very Low rate Vaishali DownLoad PDF
9711199012 Call {Girls Delhi} Very Low rate Vaishali DownLoad PDFMs Riya
 
The Omaxe State Dwarka Delhi-broucher.pdf.pdf
The Omaxe State Dwarka Delhi-broucher.pdf.pdfThe Omaxe State Dwarka Delhi-broucher.pdf.pdf
The Omaxe State Dwarka Delhi-broucher.pdf.pdfkratirudram
 
Call Girls in Model Town Delhi 💯Call Us 🔝8264348440🔝
Call Girls in Model Town Delhi 💯Call Us 🔝8264348440🔝Call Girls in Model Town Delhi 💯Call Us 🔝8264348440🔝
Call Girls in Model Town Delhi 💯Call Us 🔝8264348440🔝soniya singh
 
Call Girls In Mayur Vihar-1 Delhi ❤️8860477959 Good Looking Escorts In 24/7 D...
Call Girls In Mayur Vihar-1 Delhi ❤️8860477959 Good Looking Escorts In 24/7 D...Call Girls In Mayur Vihar-1 Delhi ❤️8860477959 Good Looking Escorts In 24/7 D...
Call Girls In Mayur Vihar-1 Delhi ❤️8860477959 Good Looking Escorts In 24/7 D...lizamodels9
 
9990771857 Call Girls in Noida Sector 11 Noida (Call Girls) Delhi
9990771857 Call Girls in Noida Sector 11 Noida (Call Girls) Delhi9990771857 Call Girls in Noida Sector 11 Noida (Call Girls) Delhi
9990771857 Call Girls in Noida Sector 11 Noida (Call Girls) Delhidelhimodel235
 
How to Build Multifamily and Laneway Suites in Toronto!! (feat. Expert Archi...
How to Build Multifamily and Laneway Suites  in Toronto!! (feat. Expert Archi...How to Build Multifamily and Laneway Suites  in Toronto!! (feat. Expert Archi...
How to Build Multifamily and Laneway Suites in Toronto!! (feat. Expert Archi...Volition Properties
 
Call Girls in Janakpuri ↫8447779280↫Short 1500 Night 6000-Escorts Service In ...
Call Girls in Janakpuri ↫8447779280↫Short 1500 Night 6000-Escorts Service In ...Call Girls in Janakpuri ↫8447779280↫Short 1500 Night 6000-Escorts Service In ...
Call Girls in Janakpuri ↫8447779280↫Short 1500 Night 6000-Escorts Service In ...asmaqueen5
 
Call Girls in Inderpuri Delhi 💯Call Us 🔝8264348440🔝
Call Girls in Inderpuri Delhi 💯Call Us 🔝8264348440🔝Call Girls in Inderpuri Delhi 💯Call Us 🔝8264348440🔝
Call Girls in Inderpuri Delhi 💯Call Us 🔝8264348440🔝soniya singh
 
Model Call Girl in Shastri Nagar Delhi reach out to us at 🔝8264348440🔝
Model Call Girl in Shastri Nagar Delhi reach out to us at 🔝8264348440🔝Model Call Girl in Shastri Nagar Delhi reach out to us at 🔝8264348440🔝
Model Call Girl in Shastri Nagar Delhi reach out to us at 🔝8264348440🔝soniya singh
 

Recently uploaded (20)

Call Girls In Hari Nagar Dadb Block {8447779280}Hari Nagar {West Delhi Escort...
Call Girls In Hari Nagar Dadb Block {8447779280}Hari Nagar {West Delhi Escort...Call Girls In Hari Nagar Dadb Block {8447779280}Hari Nagar {West Delhi Escort...
Call Girls In Hari Nagar Dadb Block {8447779280}Hari Nagar {West Delhi Escort...
 
Eco-Efficient Living: Redefining Sustainability through Leech's Green Design ...
Eco-Efficient Living: Redefining Sustainability through Leech's Green Design ...Eco-Efficient Living: Redefining Sustainability through Leech's Green Design ...
Eco-Efficient Living: Redefining Sustainability through Leech's Green Design ...
 
Call Girls In Mundka Industrial Metro@꧂8447779280 ↬Enjoy ꧂Escort Service in ...
Call Girls In Mundka Industrial Metro@꧂8447779280 ↬Enjoy ꧂Escort Service in  ...Call Girls In Mundka Industrial Metro@꧂8447779280 ↬Enjoy ꧂Escort Service in  ...
Call Girls In Mundka Industrial Metro@꧂8447779280 ↬Enjoy ꧂Escort Service in ...
 
call girls in Shahdara (DELHI) 🔝 >༒9953330565🔝 genuine Escort Service 🔝✔️✔️
call girls in Shahdara (DELHI) 🔝 >༒9953330565🔝 genuine Escort Service 🔝✔️✔️call girls in Shahdara (DELHI) 🔝 >༒9953330565🔝 genuine Escort Service 🔝✔️✔️
call girls in Shahdara (DELHI) 🔝 >༒9953330565🔝 genuine Escort Service 🔝✔️✔️
 
Purva Palm Hills Devanahalli, Bangalore E- Brochure.pdf
Purva Palm Hills Devanahalli, Bangalore E- Brochure.pdfPurva Palm Hills Devanahalli, Bangalore E- Brochure.pdf
Purva Palm Hills Devanahalli, Bangalore E- Brochure.pdf
 
Building Dreams: Newman Leech's Visionary Approach to Real Estate Investment
Building Dreams: Newman Leech's Visionary Approach to Real Estate InvestmentBuilding Dreams: Newman Leech's Visionary Approach to Real Estate Investment
Building Dreams: Newman Leech's Visionary Approach to Real Estate Investment
 
Call Girls in Nehru Place Delhi 💯Call Us 🔝8264348440🔝
Call Girls in Nehru Place Delhi 💯Call Us 🔝8264348440🔝Call Girls in Nehru Place Delhi 💯Call Us 🔝8264348440🔝
Call Girls in Nehru Place Delhi 💯Call Us 🔝8264348440🔝
 
Call Girls In Vasundhara Ghaziabad ❤️8860477959 Low Rate Escorts Service In 2...
Call Girls In Vasundhara Ghaziabad ❤️8860477959 Low Rate Escorts Service In 2...Call Girls In Vasundhara Ghaziabad ❤️8860477959 Low Rate Escorts Service In 2...
Call Girls In Vasundhara Ghaziabad ❤️8860477959 Low Rate Escorts Service In 2...
 
8 Key Elements for Comfortable Farmland Living
8 Key Elements for Comfortable Farmland Living 8 Key Elements for Comfortable Farmland Living
8 Key Elements for Comfortable Farmland Living
 
Call Girls in Mahavir Nagar whatsaap call US +919953056974
Call Girls in Mahavir Nagar  whatsaap call US  +919953056974Call Girls in Mahavir Nagar  whatsaap call US  +919953056974
Call Girls in Mahavir Nagar whatsaap call US +919953056974
 
9711199012 Call {Girls Delhi} Very Low rate Vaishali DownLoad PDF
9711199012 Call {Girls Delhi} Very Low rate Vaishali DownLoad PDF9711199012 Call {Girls Delhi} Very Low rate Vaishali DownLoad PDF
9711199012 Call {Girls Delhi} Very Low rate Vaishali DownLoad PDF
 
Low Rate Call Girls in Triveni Complex Delhi Call 9873940964
Low Rate Call Girls in Triveni Complex Delhi Call 9873940964Low Rate Call Girls in Triveni Complex Delhi Call 9873940964
Low Rate Call Girls in Triveni Complex Delhi Call 9873940964
 
The Omaxe State Dwarka Delhi-broucher.pdf.pdf
The Omaxe State Dwarka Delhi-broucher.pdf.pdfThe Omaxe State Dwarka Delhi-broucher.pdf.pdf
The Omaxe State Dwarka Delhi-broucher.pdf.pdf
 
Call Girls in Model Town Delhi 💯Call Us 🔝8264348440🔝
Call Girls in Model Town Delhi 💯Call Us 🔝8264348440🔝Call Girls in Model Town Delhi 💯Call Us 🔝8264348440🔝
Call Girls in Model Town Delhi 💯Call Us 🔝8264348440🔝
 
Call Girls In Mayur Vihar-1 Delhi ❤️8860477959 Good Looking Escorts In 24/7 D...
Call Girls In Mayur Vihar-1 Delhi ❤️8860477959 Good Looking Escorts In 24/7 D...Call Girls In Mayur Vihar-1 Delhi ❤️8860477959 Good Looking Escorts In 24/7 D...
Call Girls In Mayur Vihar-1 Delhi ❤️8860477959 Good Looking Escorts In 24/7 D...
 
9990771857 Call Girls in Noida Sector 11 Noida (Call Girls) Delhi
9990771857 Call Girls in Noida Sector 11 Noida (Call Girls) Delhi9990771857 Call Girls in Noida Sector 11 Noida (Call Girls) Delhi
9990771857 Call Girls in Noida Sector 11 Noida (Call Girls) Delhi
 
How to Build Multifamily and Laneway Suites in Toronto!! (feat. Expert Archi...
How to Build Multifamily and Laneway Suites  in Toronto!! (feat. Expert Archi...How to Build Multifamily and Laneway Suites  in Toronto!! (feat. Expert Archi...
How to Build Multifamily and Laneway Suites in Toronto!! (feat. Expert Archi...
 
Call Girls in Janakpuri ↫8447779280↫Short 1500 Night 6000-Escorts Service In ...
Call Girls in Janakpuri ↫8447779280↫Short 1500 Night 6000-Escorts Service In ...Call Girls in Janakpuri ↫8447779280↫Short 1500 Night 6000-Escorts Service In ...
Call Girls in Janakpuri ↫8447779280↫Short 1500 Night 6000-Escorts Service In ...
 
Call Girls in Inderpuri Delhi 💯Call Us 🔝8264348440🔝
Call Girls in Inderpuri Delhi 💯Call Us 🔝8264348440🔝Call Girls in Inderpuri Delhi 💯Call Us 🔝8264348440🔝
Call Girls in Inderpuri Delhi 💯Call Us 🔝8264348440🔝
 
Model Call Girl in Shastri Nagar Delhi reach out to us at 🔝8264348440🔝
Model Call Girl in Shastri Nagar Delhi reach out to us at 🔝8264348440🔝Model Call Girl in Shastri Nagar Delhi reach out to us at 🔝8264348440🔝
Model Call Girl in Shastri Nagar Delhi reach out to us at 🔝8264348440🔝
 

SF Home Prices Up 4% Since 2009

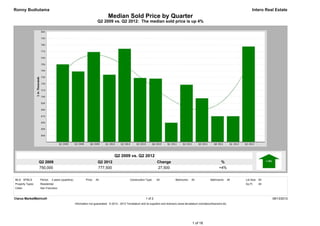
  • 1. Ronny Budiutama Intero Real Estate Median Sold Price by Quarter Q2 2009 vs. Q2 2012: The median sold price is up 4% Q2 2009 vs. Q2 2012 Q2 2009 Q2 2012 Change % 750,000 777,500 27,500 +4% MLS: SFMLS Period: 3 years (quarterly) Price: All Construction Type: All Bedrooms: All Bathrooms: All Lot Size: All Property Types: Residential Sq Ft: All Cities: San Francisco Clarus MarketMetrics® 1 of 2 08/13/2012 Information not guaranteed. © 2012 - 2013 Terradatum and its suppliers and licensors (www.terradatum.com/about/licensors.td). 1 of 18
  • 2. Ronny Budiutama Intero Real Estate Median Sold Price by Quarter Q2 2009 vs. Q2 2012: The median sold price is up 4% Time Period Median Price # Units Average DOM Q2 2012 777,500 718 53 Q1 2012 670,000 529 68 Q4 2011 670,000 663 58 Q3 2011 697,620 621 63 Q2 2011 718,500 682 63 Q1 2011 660,000 499 71 Q4 2010 728,000 615 60 Q3 2010 729,000 578 58 Q2 2010 774,000 672 54 Q1 2010 734,000 468 61 Q4 2009 769,000 649 57 Q3 2009 739,000 651 58 Q2 2009 750,000 557 65 Clarus MarketMetrics® 2 of 2 08/13/2012 Information not guaranteed. © 2012 - 2013 Terradatum and its suppliers and licensors (www.terradatum.com/about/licensors.td). 2 of 18
  • 3. Ronny Budiutama Intero Real Estate Median For Sale vs. Median Sold Q2 09 vs. Q2 12: The median price of for sale properties is down 4% and the median price of sold properties is up 4% Q2 2009 vs. Q2 2012 Q2 2009 vs. Q2 2012 Q2 2009 Q2 2012 Change % Q2 2009 Q2 2012 Change % 799,000 768,000 -31,000 -4% 750,000 777,500 27,500 +4% MLS: SFMLS Period: 3 years (quarterly) Price: All Construction Type: All Bedrooms: All Bathrooms: All Lot Size: All Property Types: Residential Sq Ft: All Cities: San Francisco Clarus MarketMetrics® 1 of 2 08/13/2012 Information not guaranteed. © 2012 - 2013 Terradatum and its suppliers and licensors (www.terradatum.com/about/licensors.td). 3 of 18
  • 4. Ronny Budiutama Intero Real Estate Median For Sale vs. Median Sold Q2 09 vs. Q2 12: The median price of for sale properties is down 4% and the median price of sold properties is up 4% For Sale # Properties Sold # Properties Price Time Period Median For Sale Median Sold Difference Q2 2012 768,000 1,211 777,500 718 9,500 Q1 2012 699,000 1,189 670,000 529 -29,000 Q4 2011 650,000 1,281 670,000 663 20,000 Q3 2011 679,000 1,685 697,620 621 18,620 Q2 2011 699,000 1,550 718,500 682 19,500 Q1 2011 675,950 1,393 660,000 499 -15,950 Q4 2010 699,000 1,452 728,000 615 29,000 Q3 2010 728,900 1,772 729,000 578 100 Q2 2010 749,000 1,658 774,000 672 25,000 Q1 2010 757,900 1,340 734,000 468 -23,900 Q4 2009 768,000 1,233 769,000 649 1,000 Q3 2009 795,000 1,552 739,000 651 -56,000 Q2 2009 799,000 1,594 750,000 557 -49,000 Clarus MarketMetrics® 2 of 2 08/13/2012 Information not guaranteed. © 2012 - 2013 Terradatum and its suppliers and licensors (www.terradatum.com/about/licensors.td). 4 of 18
  • 5. Ronny Budiutama Intero Real Estate Sold Properties by Quarter Q2 2009 vs. Q2 2012: The number of Sold properties is up 29% Q2 2009 vs. Q2 2012 Q2 2009 Q2 2012 Change % 557 718 161 +29% MLS: SFMLS Period: 3 years (quarterly) Price: All Construction Type: All Bedrooms: All Bathrooms: All Lot Size: All Property Types: Residential Sq Ft: All Cities: San Francisco Clarus MarketMetrics® 1 of 2 08/13/2012 Information not guaranteed. © 2012 - 2013 Terradatum and its suppliers and licensors (www.terradatum.com/about/licensors.td). 5 of 18
  • 6. Ronny Budiutama Intero Real Estate Sold Properties by Quarter Q2 2009 vs. Q2 2012: The number of Sold properties is up 29% Full Market Bank Properties Non-Bank Properties Time Period # Properties Median Price Average DOM # Properties % Bank Median Price # Properties % Non-Bank Median Price Q2 2012 718 777,500 53 121 16.9 480,200 597 83.2 835,000 Q1 2012 529 670,000 68 132 24.9 469,500 397 75.0 749,000 Q4 2011 663 670,000 58 117 17.6 450,000 546 82.3 749,000 Q3 2011 621 697,620 63 129 20.8 450,000 492 79.2 772,500 Q2 2011 682 718,500 63 133 19.5 450,000 549 80.5 782,500 Q1 2011 499 660,000 71 123 24.6 450,000 376 75.3 740,000 Q4 2010 615 728,000 60 95 15.4 480,000 520 84.5 785,000 Q3 2010 578 729,000 58 106 18.3 460,000 472 81.7 787,000 Q2 2010 672 774,000 54 124 18.4 520,000 548 81.5 837,500 Q1 2010 468 734,000 61 114 24.4 500,500 354 75.6 789,500 Q4 2009 649 769,000 57 111 17.1 485,000 538 82.9 819,250 Q3 2009 651 739,000 58 136 20.9 518,150 515 79.1 805,000 Q2 2009 557 750,000 65 104 18.7 467,500 453 81.3 805,000 Clarus MarketMetrics® 2 of 2 08/13/2012 Information not guaranteed. © 2012 - 2013 Terradatum and its suppliers and licensors (www.terradatum.com/about/licensors.td). 6 of 18
  • 7. Ronny Budiutama Intero Real Estate Under Contract Properties by Quarter Q2 2009 vs. Q2 2012: The number of Under Contract properties is up 8% Q2 2009 vs. Q2 2012 Q2 2009 Q2 2012 Change % 665 719 54 +8% MLS: SFMLS Period: 3 years (quarterly) Price: All Construction Type: All Bedrooms: All Bathrooms: All Lot Size: All Property Types: Residential Sq Ft: All Cities: San Francisco Clarus MarketMetrics® 1 of 2 08/13/2012 Information not guaranteed. © 2012 - 2013 Terradatum and its suppliers and licensors (www.terradatum.com/about/licensors.td). 7 of 18
  • 8. Ronny Budiutama Intero Real Estate Under Contract Properties by Quarter Q2 2009 vs. Q2 2012: The number of Under Contract properties is up 8% Full Market Bank Properties Non-Bank Properties Time Period # Properties Median Price Average DOM # Properties % Bank Median Price # Properties % Non-Bank Median Price Q2 2012 719 715,000 46 136 18.9 452,250 583 81.1 799,000 Q1 2012 638 699,000 58 150 23.5 429,900 488 76.5 791,944 Q4 2011 602 627,000 70 144 23.9 457,000 458 76.1 699,000 Q3 2011 660 680,111 60 130 19.7 441,628 530 80.3 754,500 Q2 2011 674 721,000 59 117 17.4 457,000 557 82.6 795,000 Q1 2011 571 695,000 71 154 27.0 446,600 417 73.0 790,000 Q4 2010 555 699,000 68 100 18.0 460,400 455 82.0 749,000 Q3 2010 590 719,250 60 113 19.1 468,000 477 80.8 779,000 Q2 2010 679 750,000 56 118 17.4 466,250 561 82.6 799,000 Q1 2010 543 750,000 53 116 21.4 461,610 427 78.6 799,000 Q4 2009 548 747,000 62 112 20.4 452,670 436 79.6 799,000 Q3 2009 633 718,000 56 125 19.8 499,900 508 80.2 799,000 Q2 2009 665 778,000 63 123 18.5 475,000 542 81.5 839,000 Clarus MarketMetrics® 2 of 2 08/13/2012 Information not guaranteed. © 2012 - 2013 Terradatum and its suppliers and licensors (www.terradatum.com/about/licensors.td). 8 of 18
  • 9. Ronny Budiutama Intero Real Estate New Properties by Quarter Q2 2009 vs. Q2 2012: The number of New properties is down 16% Q2 2009 vs. Q2 2012 Q2 2009 Q2 2012 Change % 927 781 -146 -16% MLS: SFMLS Period: 3 years (quarterly) Price: All Construction Type: All Bedrooms: All Bathrooms: All Lot Size: All Property Types: Residential Sq Ft: All Cities: San Francisco Clarus MarketMetrics® 1 of 2 08/13/2012 Information not guaranteed. © 2012 - 2013 Terradatum and its suppliers and licensors (www.terradatum.com/about/licensors.td). 9 of 18
  • 10. Ronny Budiutama Intero Real Estate New Properties by Quarter Q2 2009 vs. Q2 2012: The number of New properties is down 16% Full Market Bank Properties Non-Bank Properties Time Period # Properties Median Price # Properties % Bank Median Price # Properties % Non-Bank Median Price Q2 2012 781 795,000 119 15.2 469,000 662 84.8 877,000 Q1 2012 807 725,000 161 19.9 420,000 646 80.0 799,000 Q4 2011 532 649,000 138 25.9 450,000 394 74.1 699,754 Q3 2011 1,016 699,000 194 19.1 475,000 822 80.9 759,000 Q2 2011 921 699,880 186 20.2 438,622 735 79.8 799,000 Q1 2011 906 695,000 216 23.8 449,975 690 76.2 790,500 Q4 2010 621 679,000 154 24.8 456,950 467 75.2 768,000 Q3 2010 1,051 720,000 180 17.1 459,450 871 82.9 775,000 Q2 2010 1,050 749,000 190 18.1 461,700 860 81.9 799,000 Q1 2010 946 769,000 185 19.6 515,000 761 80.4 819,000 Q4 2009 592 729,000 149 25.2 450,000 443 74.8 799,000 Q3 2009 882 777,000 153 17.4 497,000 729 82.7 839,000 Q2 2009 927 785,000 186 20.1 498,950 741 79.9 879,000 Clarus MarketMetrics® 2 of 2 08/13/2012 Information not guaranteed. © 2012 - 2013 Terradatum and its suppliers and licensors (www.terradatum.com/about/licensors.td). 10 of 18
  • 11. Ronny Budiutama Intero Real Estate For Sale Properties by Quarter Q2 2009 vs. Q2 2012: The number of For Sale properties is down 24% Q2 2009 vs. Q2 2012 Q2 2009 Q2 2012 Change % 1,594 1,211 -383 -24% MLS: SFMLS Period: 3 years (quarterly) Price: All Construction Type: All Bedrooms: All Bathrooms: All Lot Size: All Property Types: Residential Sq Ft: All Cities: San Francisco Clarus MarketMetrics® 1 of 2 08/13/2012 Information not guaranteed. © 2012 - 2013 Terradatum and its suppliers and licensors (www.terradatum.com/about/licensors.td). 11 of 18
  • 12. Ronny Budiutama Intero Real Estate For Sale Properties by Quarter Q2 2009 vs. Q2 2012: The number of For Sale properties is down 24% Full Market Bank Properties Non-Bank Properties Time Period # Properties Median Price Average DOM # Properties % Bank Median Price # Properties % Non-Bank Median Price Q2 2012 1,211 768,000 58 229 18.9 460,800 982 81.1 871,500 Q1 2012 1,189 699,000 70 297 25.0 446,299 892 75.0 799,000 Q4 2011 1,281 650,000 88 342 26.7 459,000 939 73.3 749,000 Q3 2011 1,685 679,000 70 399 23.7 450,000 1,286 76.3 761,500 Q2 2011 1,550 699,000 69 365 23.6 448,888 1,185 76.5 797,888 Q1 2011 1,393 675,950 75 381 27.4 449,000 1,012 72.7 788,000 Q4 2010 1,452 699,000 87 325 22.4 450,000 1,127 77.6 775,000 Q3 2010 1,772 728,900 68 350 19.8 459,450 1,422 80.2 799,000 Q2 2010 1,658 749,000 63 345 20.8 469,000 1,313 79.2 830,000 Q1 2010 1,340 757,900 64 311 23.2 475,000 1,029 76.8 849,000 Q4 2009 1,233 768,000 80 286 23.2 468,950 947 76.8 868,888 Q3 2009 1,552 795,000 67 315 20.3 499,000 1,237 79.7 879,000 Q2 2009 1,594 799,000 68 345 21.6 499,000 1,249 78.4 899,000 Clarus MarketMetrics® 2 of 2 08/13/2012 Information not guaranteed. © 2012 - 2013 Terradatum and its suppliers and licensors (www.terradatum.com/about/licensors.td). 12 of 18
  • 13. Ronny Budiutama Intero Real Estate Expired Properties by Quarter Q2 2009 vs. Q2 2012: The number of Expired properties is down 42% Q2 2009 vs. Q2 2012 Q2 2009 Q2 2012 Change % 259 149 -110 -42% MLS: SFMLS Period: 3 years (quarterly) Price: All Construction Type: All Bedrooms: All Bathrooms: All Lot Size: All Property Types: Residential Sq Ft: All Cities: San Francisco Clarus MarketMetrics® 1 of 2 08/13/2012 Information not guaranteed. © 2012 - 2013 Terradatum and its suppliers and licensors (www.terradatum.com/about/licensors.td). 13 of 18
  • 14. Ronny Budiutama Intero Real Estate Expired Properties by Quarter Q2 2009 vs. Q2 2012: The number of Expired properties is down 42% Full Market Bank Properties Non-Bank Properties Time Period # Properties Median Price Average DOM # Properties % Bank Median Price # Properties % Non-Bank Median Price Q2 2012 149 749,000 74 41 27.5 455,000 108 72.5 944,000 Q1 2012 121 649,000 111 37 30.6 459,000 84 69.4 799,495 Q4 2011 297 699,000 105 62 20.9 453,900 235 79.1 764,000 Q3 2011 276 699,000 96 65 23.6 435,000 211 76.5 799,000 Q2 2011 207 749,000 110 43 20.8 425,000 164 79.2 809,500 Q1 2011 193 675,000 115 48 24.9 479,500 145 75.1 789,000 Q4 2010 410 748,500 108 60 14.6 462,500 350 85.4 799,000 Q3 2010 351 799,000 99 66 18.8 499,000 285 81.2 849,000 Q2 2010 258 749,250 89 57 22.1 478,000 201 77.9 875,000 Q1 2010 189 799,000 106 40 21.2 525,000 149 78.8 879,000 Q4 2009 291 959,000 102 48 16.5 512,750 243 83.5 1,095,000 Q3 2009 278 877,000 101 53 19.1 499,000 225 80.9 979,950 Q2 2009 259 974,500 102 60 23.2 567,450 199 76.8 1,098,000 Clarus MarketMetrics® 2 of 2 08/13/2012 Information not guaranteed. © 2012 - 2013 Terradatum and its suppliers and licensors (www.terradatum.com/about/licensors.td). 14 of 18
  • 15. Ronny Budiutama Intero Real Estate Supply & Demand by Quarter Q2 2009 vs. Q2 2012: The number of for sale properties is down 24% and the number of sold properties is up 29% Q2 2009 vs. Q2 2012 Q2 2009 vs. Q2 2012 Q2 2009 Q2 2012 Change % Q2 2009 Q2 2012 Change % 1,594 1,211 -383 -24% 557 718 161 +29% MLS: SFMLS Period: 3 years (quarterly) Price: All Construction Type: All Bedrooms: All Bathrooms: All Lot Size: All Property Types: Residential Sq Ft: All Cities: San Francisco Clarus MarketMetrics® 1 of 2 08/13/2012 Information not guaranteed. © 2012 - 2013 Terradatum and its suppliers and licensors (www.terradatum.com/about/licensors.td). 15 of 18
  • 16. Ronny Budiutama Intero Real Estate Supply & Demand by Quarter Q2 2009 vs. Q2 2012: The number of for sale properties is down 24% and the number of sold properties is up 29% # Properties Average DOM # Properties Average DOM Time Period For Sale For Sale Sold Sold Q2 2012 1,211 58 718 53 Q1 2012 1,189 70 529 68 Q4 2011 1,281 88 663 58 Q3 2011 1,685 70 621 63 Q2 2011 1,550 69 682 63 Q1 2011 1,393 75 499 71 Q4 2010 1,452 87 615 60 Q3 2010 1,772 68 578 58 Q2 2010 1,658 63 672 54 Q1 2010 1,340 64 468 61 Q4 2009 1,233 80 649 57 Q3 2009 1,552 67 651 58 Q2 2009 1,594 68 557 65 Clarus MarketMetrics® 2 of 2 08/13/2012 Information not guaranteed. © 2012 - 2013 Terradatum and its suppliers and licensors (www.terradatum.com/about/licensors.td). 16 of 18
  • 17. Ronny Budiutama Intero Real Estate The Average Days on Market by Quarter Q2 2009 vs. Q2 2012: The average days on market is down 27% Q2 2009 vs. Q2 2012 Q2 2009 Q2 2012 Change % 63 46 -17 -27% MLS: SFMLS Period: 3 years (quarterly) Price: All Construction Type: All Bedrooms: All Bathrooms: All Lot Size: All Property Types: Residential Sq Ft: All Cities: San Francisco Clarus MarketMetrics® 1 of 2 08/13/2012 Information not guaranteed. © 2012 - 2013 Terradatum and its suppliers and licensors (www.terradatum.com/about/licensors.td). 17 of 18
  • 18. Ronny Budiutama Intero Real Estate The Average Days on Market by Quarter Q2 2009 vs. Q2 2012: The average days on market is down 27% Time Period Average DOM # UC Units Q2 2012 46 719 Q1 2012 58 638 Q4 2011 70 602 Q3 2011 60 660 Q2 2011 59 674 Q1 2011 71 571 Q4 2010 68 555 Q3 2010 60 590 Q2 2010 56 679 Q1 2010 53 543 Q4 2009 62 548 Q3 2009 56 633 Q2 2009 63 665 Clarus MarketMetrics® 2 of 2 08/13/2012 Information not guaranteed. © 2012 - 2013 Terradatum and its suppliers and licensors (www.terradatum.com/about/licensors.td). 18 of 18