SlideShare a Scribd company logo
1 of 16
Download to read offline
September 2017 Monthly Snapshot
One-Year Change in One-Year Change in
Median Sales Price
Single Family
Median Sales Price
Condo/TIC/Coop
2
3
4
5
6
7
8
9
10
11
12
13
14
15
16
Current as of October 11, 2017. All data from the San Francisco MLS. Report © 2017 ShowingTime.
Condo/TIC/Coop Activity Overview
Inventory of Active Listings
% of Properties Sold Over List Price
% of List Price Received
Housing Affordability Ratio
All Properties Activity Overview
New Listings
Pending Sales
Sold Listings
Median Sales Price
Average Sales Price
Days on Market Until Sale
Activity by District
Monthly Indicators
+ 9.9% + 8.0% + 11.3%
One-Year Change in
Every market is unique, yet the national sentiment has given rise to the notion
that housing markets are stalling. Although desirous buyers are out on an
increasing number of showings, there remains a limited number of desirable
listings. And although mortgage rates have remained enticingly low, home
prices have reached unaffordable levels for many new entrants into the housing
pool at exactly the same time that established owners are proving to be less
interested in moving.
New Listings were down 22.2 percent for single family homes and 12.0 percent
for Condo/TIC/Coop properties. Pending Sales increased 8.6 percent for single
family homes and 10.6 percent for Condo/TIC/Coop properties.
The Median Sales Price was up 9.9 percent to $1,337,500 for single family
homes and 8.0 percent to $1,104,500 for Condo/TIC/Coop properties. Months
Supply of Inventory decreased 31.0 percent for single family units and 20.0
percent for Condo/TIC/Coop units.
Last year at this time, the national storyline was about how high demand was
propping up sales and prices despite low inventory and months of supply. That
has actually continued to be a familiar refrain for many months in 2017 and now
for the past couple of years. But with the likes of Hurricanes Harvey and Irma,
different employment outlooks, disparate incomes, varying new construction
expectations and potential housing policy shifts, regional differences are
becoming more prevalent and pronounced.
Median Sales Price
All Property Types
Residential real estate activity in San Francisco County (Districts 1-10),
comprised of single-family properties, townhomes and condominiums.
Percent changes are calculated using rounded figures.
Single Family Activity Overview
Months Supply of Inventory
Single Family Activity Overview
Key metrics by report month and for year-to-date (YTD) starting from the first of the year.
Key Metrics Historical Sparkbars 9-2016 9-2017 Percent Change YTD 2016 YTD 2017 Percent Change
- 7.1%2,082
1,629 + 2.5%
$1,375,000 + 4.2%
+ 4.7%
Pending Sales 186 202 + 8.6% + 2.8%1,663 1,709
New Listings 347 270 - 22.2% 2,242
Sold Listings 178 166 - 6.7% 1,589
Median Sales Price $1,216,875 $1,337,500 + 9.9% $1,320,000
28 - 12.5%
$1,740,570
-- --
Days on Market 41 28 - 31.7% 32
Avg. Sales Price $1,487,123 $1,633,856 + 9.9% $1,661,901
Active Listings 532 378 - 28.9% --
% of Properties Sold Over List Price 77.5% 86.1% + 11.1% 76.7%
40
78.3% + 2.1%
+ 2.4%
38 - 5.0%
115.0%% of List Price Received 110.8% 116.5% + 5.1% 112.3%
Current as of October 11, 2017. All data from the San Francisco MLS. Report © 2017 ShowingTime. | 2
Months Supply 2.9 2.0 - 31.0% -- -- --
Affordability Ratio 44 39 - 11.4%
9-2014 9-2015 9-2016 9-2017
9-2014 9-2015 9-2016 9-2017
9-2014 9-2015 9-2016 9-2017
9-2014 9-2015 9-2016 9-2017
9-2014 9-2015 9-2016 9-2017
9-2014 9-2015 9-2016 9-2017
9-2014 9-2015 9-2016 9-2017
9-2014 9-2015 9-2016 9-2017
9-2014 9-2015 9-2016 9-2017
9-2014 9-2015 9-2016 9-2017
9-2014 9-2015 9-2016 9-2017
Condo/TIC/Coop Activity Overview
Key metrics by report month and for year-to-date (YTD) starting from the first of the year.
Key Metrics Historical Sparkbars 9-2016 9-2017 Percent Change YTD 2016 YTD 2017 Percent Change
- 8.9%
Pending Sales 216 239 + 10.6% 2,097 2,133 + 1.7%
New Listings 435 383 - 12.0% 3,160 2,880
Sold Listings 234 172 - 26.5% 2,058 2,044 - 0.7%
Median Sales Price $1,022,500 $1,104,500 + 8.0% $1,090,830 $1,126,500 + 3.3%
+ 4.1%
37 - 2.6%
$1,291,174
-- --
Days on Market 40 43 + 7.5% 38
Avg. Sales Price $1,208,673 $1,233,279 + 2.0% $1,239,969
Active Listings 825 666 - 19.3% --
% of Properties Sold Over List Price 58.1% 54.1% - 6.9% 59.8%
57
58.9% - 1.5%
0.0%
54 - 5.3%
105.0%% of List Price Received 104.2% 104.9% + 0.7% 105.0%
Current as of October 11, 2017. All data from the San Francisco MLS. Report © 2017 ShowingTime. | 3
Months Supply 3.5 2.8 - 20.0% -- -- --
Affordability Ratio 61 55 - 9.8%
9-2014 9-2015 9-2016 9-2017
9-2014 9-2015 9-2016 9-2017
9-2014 9-2015 9-2016 9-2017
9-2014 9-2015 9-2016 9-2017
9-2014 9-2015 9-2016 9-2017
9-2014 9-2015 9-2016 9-2017
9-2014 9-2015 9-2016 9-2017
9-2014 9-2015 9-2016 9-2017
9-2014 9-2015 9-2016 9-2017
9-2014 9-2015 9-2016 9-2017
9-2014 9-2015 9-2016 9-2017
New Listings
New Listings
Single
Family
Year-Over-Year
Change
Condo/TIC/
Coop
Year-Over-Year
Change
Oct-2016 222 -15.6% 300 -6.8%
Nov-2016 138 -3.5% 159 -18.5%
Dec-2016 70 +4.5% 119 -1.7%
Jan-2017 176 -3.8% 328 +11.6%
Feb-2017 187 -18.0% 329 -2.7%
Mar-2017 276 +1.1% 347 -8.0%
Apr-2017 247 -12.7% 285 -23.4%
May-2017 288 +12.5% 359 -4.0%
Jun-2017 236 -0.8% 311 -23.8%
Jul-2017 204 -12.1% 269 -2.9%
Aug-2017 198 -2.0% 269 -5.6%
Sep-2017 270 -22.2% 383 -12.0%
12-Month Avg 209 -7.5% 288 -9.0%
Historical New Listings by Month
Current as of October 11, 2017. All data from the San Francisco MLS. Report © 2017 ShowingTime. | 4
A count of the properties that have been newly listed on the market in a given month.
325
438
347
435
270
383
Single Family Condo/TIC/Coop
September
0
100
200
300
400
500
600
700
1-2005 1-2006 1-2007 1-2008 1-2009 1-2010 1-2011 1-2012 1-2013 1-2014 1-2015 1-2016 1-2017
Single Family Condo/TIC/Coop
2,267
2,916
2,242
3,160
2,082
2,880
Single Family Condo/TIC/Coop
Year to Date
2015 2016 2017
- 12.0%- 0.7%- 22.2%+ 6.8% + 8.4%- 7.1%- 1.1% - 8.9%
2015 2016 2017 2015 2016 2017 2015 2016 2017
- 7.1% - 0.1% - 4.1%+ 12.6%
Pending Sales
Pending Sales
Single
Family
Year-Over-Year
Change
Condo/TIC/
Coop
Year-Over-Year
Change
Oct-2016 222 -16.5% 249 -12.0%
Nov-2016 209 +19.4% 264 +11.4%
Dec-2016 123 -6.1% 178 +1.7%
Jan-2017 93 -6.1% 144 +0.7%
Feb-2017 135 +8.9% 208 -8.4%
Mar-2017 212 +8.7% 303 +34.1%
Apr-2017 198 -7.5% 226 -7.4%
May-2017 240 -3.6% 306 +7.4%
Jun-2017 249 +8.7% 290 +10.7%
Jul-2017 175 +3.6% 210 -18.6%
Aug-2017 205 +3.5% 207 -12.3%
Sep-2017 202 +8.6% 239 +10.6%
12-Month Avg 189 +1.3% 235 +1.1%
Historical Pending Sales by Month
Current as of October 11, 2017. All data from the San Francisco MLS. Report © 2017 ShowingTime. | 5
A count of the properties on which offers have been accepted in a given month.
199
216
186
216
202
239
Single Family Condo/TIC/Coop
September
0
100
200
300
400
1-2005 1-2006 1-2007 1-2008 1-2009 1-2010 1-2011 1-2012 1-2013 1-2014 1-2015 1-2016 1-2017
Single Family Condo/TIC/Coop
1,747
2,213
1,663
2,097
1,709
2,133
Single Family Condo/TIC/Coop
Year to Date
2015 2016 2017
+ 10.6%0.0%+ 8.6%- 6.5% - 5.2%+ 2.8%- 4.8% + 1.7%
2015 2016 2017 2015 2016 2017 2015 2016 2017
- 6.6% - 1.8% - 9.0%- 19.4%
Sold Listings
Sold Listings
Single
Family
Year-Over-Year
Change
Condo/TIC/
Coop
Year-Over-Year
Change
Oct-2016 227 -7.0% 236 -11.3%
Nov-2016 206 +9.6% 263 +26.4%
Dec-2016 200 -3.8% 238 -15.9%
Jan-2017 106 +1.9% 150 +0.7%
Feb-2017 111 +8.8% 156 -7.1%
Mar-2017 173 +9.5% 286 +13.9%
Apr-2017 203 -2.9% 232 +4.5%
May-2017 218 +9.0% 271 +5.0%
Jun-2017 230 -6.1% 324 +20.9%
Jul-2017 211 +4.5% 239 -4.0%
Aug-2017 211 +10.5% 214 -17.4%
Sep-2017 166 -6.7% 172 -26.5%
12-Month Avg 189 +1.5% 232 -1.2%
Historical Sold Listings by Month
Current as of October 11, 2017. All data from the San Francisco MLS. Report © 2017 ShowingTime. | 6
A count of the actual sales that closed in a given month.
164
181178
234
166 172
Single Family Condo/TIC/Coop
September
0
100
200
300
400
1-2005 1-2006 1-2007 1-2008 1-2009 1-2010 1-2011 1-2012 1-2013 1-2014 1-2015 1-2016 1-2017
Single Family Condo/TIC/Coop
1,669
2,130
1,589
2,058
1,629
2,044
Single Family Condo/TIC/Coop
Year to Date
2015 2016 2017
- 26.5%+ 29.3%- 6.7%+ 8.5% - 3.4%+ 2.5%- 4.8% - 0.7%
2015 2016 2017 2015 2016 2017 2015 2016 2017
- 16.8% - 3.6% - 10.8%- 27.0%
Median Sales Price
Median Sales Price
Single
Family
Year-Over-Year
Change
Condo/TIC/
Coop
Year-Over-Year
Change
Oct-2016 $1,400,000 +10.5% $1,137,500 +3.4%
Nov-2016 $1,353,000 +7.2% $1,058,000 -6.0%
Dec-2016 $1,301,511 +8.3% $1,011,000 -7.9%
Jan-2017 $1,250,000 +7.1% $1,000,000 -5.7%
Feb-2017 $1,290,000 -7.2% $1,192,500 +8.7%
Mar-2017 $1,350,000 -0.2% $1,137,500 +3.9%
Apr-2017 $1,380,000 0.0% $1,100,000 -4.3%
May-2017 $1,475,000 +9.3% $1,163,088 +7.4%
Jun-2017 $1,461,000 +10.3% $1,125,000 -4.3%
Jul-2017 $1,400,000 +7.3% $1,150,000 +10.0%
Aug-2017 $1,375,000 +10.0% $1,175,000 +10.8%
Sep-2017 $1,337,500 +9.9% $1,104,500 +8.0%
12-Month Avg* $1,370,000 +5.4% $1,108,000 +0.7%
Historical Median Sales Price by Month
* Median Sales Price for all properties from October 2016 through September 2017. This is not
the average of the individual figures above.
Current as of October 11, 2017. All data from the San Francisco MLS. Report © 2017 ShowingTime. | 7
Point at which half of the sales sold for more and half sold for less, not accounting for seller concessions, in a given month.
$1,155,000
$1,040,000
$1,216,875
$1,022,500
$1,337,500
$1,104,500
Single Family Condo/TIC/Coop
September
$400,000
$600,000
$800,000
$1,000,000
$1,200,000
$1,400,000
$1,600,000
1-2005 1-2006 1-2007 1-2008 1-2009 1-2010 1-2011 1-2012 1-2013 1-2014 1-2015 1-2016 1-2017
Single Family Condo/TIC/Coop
$1,250,000
$1,072,500
$1,320,000
$1,090,830
$1,375,000
$1,126,500
Single Family Condo/TIC/Coop
Year to Date
2015 2016 2017
+ 8.0%- 1.7%+ 9.9%+ 5.4% + 1.7%+ 4.2%+ 5.6% + 3.3%
2015 2016 2017 2015 2016 2017 2015 2016 2017
+ 11.6% + 19.0% + 15.3%+ 13.7%
Average Sales Price
Avg. Sales Price
Single
Family
Year-Over-Year
Change
Condo/TIC/
Coop
Year-Over-Year
Change
Oct-2016 $2,000,319 +23.1% $1,263,882 +6.7%
Nov-2016 $1,767,029 +3.9% $1,140,559 -9.1%
Dec-2016 $1,658,512 +10.8% $1,249,670 -0.0%
Jan-2017 $1,633,150 +4.0% $1,161,831 -0.6%
Feb-2017 $1,684,181 +4.5% $1,367,391 +13.1%
Mar-2017 $1,891,127 +6.0% $1,283,105 +2.2%
Apr-2017 $1,880,160 +6.3% $1,296,502 -5.2%
May-2017 $1,835,738 +12.4% $1,344,317 +5.9%
Jun-2017 $1,727,201 -1.4% $1,351,503 +10.9%
Jul-2017 $1,746,884 +1.5% $1,242,918 +3.1%
Aug-2017 $1,560,350 +1.5% $1,273,066 +3.6%
Sep-2017 $1,633,856 +9.9% $1,233,279 +2.0%
12-Month Avg* $1,761,791 +7.1% $1,271,062 +2.8%
Historical Average Sales Price by Month
* Avg. Sales Price for all properties from October 2016 through September 2017. This is not the
average of the individual figures above.
Current as of October 11, 2017. All data from the San Francisco MLS. Report © 2017 ShowingTime. | 8
Average sales price for all closed sales, not accounting for seller concessions, in a given month.
$1,390,736
$1,166,494
$1,487,123
$1,208,673
$1,633,856
$1,233,279
Single Family Condo/TIC/Coop
September
$500,000
$750,000
$1,000,000
$1,250,000
$1,500,000
$1,750,000
$2,000,000
$2,250,000
1-2005 1-2006 1-2007 1-2008 1-2009 1-2010 1-2011 1-2012 1-2013 1-2014 1-2015 1-2016 1-2017
Single Family Condo/TIC/Coop
$1,642,053
$1,246,391
$1,661,901
$1,239,969
$1,740,570
$1,291,174
Single Family Condo/TIC/Coop
Year to Date
2015 2016 2017
+ 2.0%+ 3.6%+ 9.9%+ 6.9% - 0.5%+ 4.7%+ 1.2% + 4.1%
2015 2016 2017 2015 2016 2017 2015 2016 2017
+ 5.6% + 15.8% + 14.0%+ 14.9%
Days on Market Until Sale
Days on Market
Single
Family
Year-Over-Year
Change
Condo/TIC/
Coop
Year-Over-Year
Change
Oct-2016 27 0.0% 34 +30.8%
Nov-2016 38 +35.7% 40 +17.6%
Dec-2016 41 +24.2% 48 +11.6%
Jan-2017 42 +5.0% 59 +34.1%
Feb-2017 34 +9.7% 36 +2.9%
Mar-2017 31 +24.0% 32 +6.7%
Apr-2017 26 -18.8% 32 -15.8%
May-2017 24 -7.7% 33 0.0%
Jun-2017 27 -6.9% 37 +5.7%
Jul-2017 25 -21.9% 33 -15.4%
Aug-2017 27 -18.2% 41 -10.9%
Sep-2017 28 -31.7% 43 +7.5%
12-Month Avg* 30 -3.0% 38 +3.8%
Historical Days on Market Until Sale by Month
* Days on Market for all properties from October 2016 through September 2017. This is not the
average of the individual figures above.
Current as of October 11, 2017. All data from the San Francisco MLS. Report © 2017 ShowingTime. | 9
Average number of days between when a property is listed and when an offer is accepted in a given month.
27
34
41 40
28
43
Single Family Condo/TIC/Coop
September
20
40
60
80
100
120
1-2005 1-2006 1-2007 1-2008 1-2009 1-2010 1-2011 1-2012 1-2013 1-2014 1-2015 1-2016 1-2017
Single Family Condo/TIC/Coop
27
30
32
38
28
37
Single Family Condo/TIC/Coop
Year to Date
2015 2016 2017
+ 7.5%+ 17.6%- 31.7%+ 51.9% + 26.7%- 12.5%+ 18.5% - 2.6%
2015 2016 2017 2015 2016 2017 2015 2016 2017
+ 3.8% - 10.0% - 11.8%- 8.1%
Inventory of Active Listings
Active Listings
Single
Family
Year-Over-Year
Change
Condo/TIC/
Coop
Year-Over-Year
Change
Oct-2016 491 +11.3% 800 +22.0%
Nov-2016 384 +5.8% 591 +8.8%
Dec-2016 261 +13.5% 405 +7.7%
Jan-2017 323 +7.7% 555 +12.1%
Feb-2017 359 -7.5% 629 +13.1%
Mar-2017 393 -12.5% 631 -3.8%
Apr-2017 421 -13.6% 644 -11.2%
May-2017 436 -6.8% 658 -11.9%
Jun-2017 390 -12.0% 609 -24.3%
Jul-2017 386 -16.8% 592 -17.9%
Aug-2017 348 -16.5% 573 -16.1%
Sep-2017 378 -28.9% 666 -19.3%
12-Month Avg* 381 -8.3% 613 -5.6%
Historical Inventory of Active Listings by Month
* Active Listings for all properties from October 2016 through September 2017. This is not the
average of the individual figures above.
Current as of October 11, 2017. All data from the San Francisco MLS. Report © 2017 ShowingTime. | 10
The number of properties available for sale in active status at the end of a given month.
479
676
532
825
378
666
Single Family Condo/TIC/Coop
September
200
400
600
800
1,000
1,200
1,400
1,600
1-2005 1-2006 1-2007 1-2008 1-2009 1-2010 1-2011 1-2012 1-2013 1-2014 1-2015 1-2016 1-2017
Single Family Condo/TIC/Coop
2015 2016 2017
- 19.3%+ 22.0%- 28.9%+ 11.1%
2015 2016 2017
- 3.2% + 15.6%
% of Properties Sold Over List Price
% of Properties
Sold Over List Price
Single
Family
Year-Over-Year
Change
Condo/TIC/
Coop
Year-Over-Year
Change
Oct-2016 78.9% -5.2% 53.8% -29.5%
Nov-2016 72.8% -6.3% 63.1% -8.8%
Dec-2016 69.0% -13.0% 42.0% -29.3%
Jan-2017 62.3% -18.0% 38.7% -27.0%
Feb-2017 78.4% +1.2% 58.3% 0.0%
Mar-2017 74.6% -9.4% 62.2% -8.1%
Apr-2017 77.3% +2.2% 62.1% +2.8%
May-2017 78.9% -0.8% 61.3% -9.1%
Jun-2017 80.0% +11.4% 58.6% -6.5%
Jul-2017 81.0% +6.3% 62.8% +7.2%
Aug-2017 79.1% +4.2% 62.1% +27.8%
Sep-2017 86.1% +11.1% 54.1% -6.9%
12-Month Avg 77.1% -0.8% 57.4% -7.5%
Historical % of Properties Sold Over List Price by Month
* % of Properties Sold Over List Price for all properties from October 2016 through September
2017. This is not the average of the individual figures above.
Current as of October 11, 2017. All data from the San Francisco MLS. Report © 2017 ShowingTime. | 11
Percentage found when dividing the number of properties sold by properties sold over its original list price, not accounting for seller
concessions.
88.4%
71.8%
77.5%
58.1%
86.1%
54.1%
Single Family Condo/TIC/Coop
September
0.0%
20.0%
40.0%
60.0%
80.0%
100.0%
1-2005 1-2006 1-2007 1-2008 1-2009 1-2010 1-2011 1-2012 1-2013 1-2014 1-2015 1-2016 1-2017
Single Family Condo/TIC/Coop
83.0%
71.2%
76.7%
59.8%
78.3%
58.9%
Single Family Condo/TIC/Coop
Year to Date
2015 2016 2017
- 6.9%- 19.1%+ 11.1%- 12.3% - 16.0%+ 2.1%- 7.6% - 1.5%
2015 2016 2017 2015 2016 2017 2015 2016 2017
+ 14.5% + 3.2% + 3.8%+ 8.0%
% of List Price Received
% of List Price
Received
Single
Family
Year-Over-Year
Change
Condo/TIC/
Coop
Year-Over-Year
Change
Oct-2016 111.2% -2.9% 104.2% -4.7%
Nov-2016 109.1% -2.9% 104.6% -2.7%
Dec-2016 108.4% -3.5% 101.5% -2.7%
Jan-2017 107.6% -3.1% 101.4% -2.3%
Feb-2017 113.8% +1.1% 104.1% -1.7%
Mar-2017 112.4% -2.0% 105.0% -1.2%
Apr-2017 115.4% +1.9% 105.1% -0.1%
May-2017 115.3% +0.1% 105.4% -0.7%
Jun-2017 116.8% +5.9% 105.8% +0.5%
Jul-2017 117.0% +4.7% 106.0% +1.1%
Aug-2017 115.6% +3.7% 105.9% +2.9%
Sep-2017 116.5% +5.1% 104.9% +0.7%
12-Month Avg* 113.5% +0.8% 104.6% -0.8%
Historical % of List Price Received by Month
* % of List Price Received for all properties from October 2016 through September 2017. This is
not the average of the individual figures above.
Current as of October 11, 2017. All data from the San Francisco MLS. Report © 2017 ShowingTime. | 12
Percentage found when dividing a property’s sales price by its most recent list price, then taking the average for all properties sold in a given
month, not accounting for seller concessions.
117.7%
108.7%110.8%
104.2%
116.5%
104.9%
Single Family Condo/TIC/Coop
September
116.2%
109.3%112.3%
105.0%
115.0%
105.0%
Single Family Condo/TIC/Coop
Year to Date
95.0%
100.0%
105.0%
110.0%
115.0%
120.0%
1-2005 1-2006 1-2007 1-2008 1-2009 1-2010 1-2011 1-2012 1-2013 1-2014 1-2015 1-2016 1-2017
Single Family Condo/TIC/Coop
2015 2016 2017
+ 0.7%- 4.1%+ 5.1%- 5.9%
2015 2016 2017
+ 5.5% + 3.3%
2015 2016 2017
0.0%- 3.9%+ 2.4%- 3.4%
2015 2016 2017
+ 3.1% + 2.0%
Housing Affordability Ratio
Affordability Ratio
Single
Family
Year-Over-Year
Change
Condo/TIC/
Coop
Year-Over-Year
Change
Oct-2016 39 +2.6% 56 +9.8%
Nov-2016 38 0.0% 56 +12.0%
Dec-2016 38 -5.0% 56 +9.8%
Jan-2017 39 -11.4% 56 0.0%
Feb-2017 39 +2.6% 49 -12.5%
Mar-2017 37 -5.1% 51 -8.9%
Apr-2017 37 -2.6% 54 +1.9%
May-2017 35 -10.3% 52 -7.1%
Jun-2017 35 -12.5% 53 0.0%
Jul-2017 37 -9.8% 52 -11.9%
Aug-2017 38 -11.6% 52 -11.9%
Sep-2017 39 -11.4% 55 -9.8%
12-Month Avg* 38 -2.8% 40 -0.3%
Historical Housing Affordability Ratio by Month
* Affordability Ratio for all properties from October 2016 through September 2017. This is not the
average of the individual figures above.
Current as of October 11, 2017. All data from the San Francisco MLS. Report © 2017 ShowingTime. | 13
This index measures housing affordability for the region. For example, an index of 120 means the median household income is 120% of what is
necessary to qualify for the median-priced home under prevailing interest rates. A higher number means greater affordability.
42
54
44
61
39
55
Single Family Condo/TIC/Coop
September
30
40
50
60
70
80
90
100
1-2005 1-2006 1-2007 1-2008 1-2009 1-2010 1-2011 1-2012 1-2013 1-2014 1-2015 1-2016 1-2017
Single Family Condo/TIC/Coop
2015 2016 2017
- 9.8%+ 13.0%- 11.4%+ 4.8%
2015 2016 2017
- 4.5% - 5.3%
39
53
40
57
38
54
Single Family Condo/TIC/Coop
Year to Date
2015 2016 2017
- 5.3%+ 7.5%- 5.0%+ 2.6%
2015 2016 2017
- 9.3% - 5.4%
Months Supply of Inventory
Months Supply
Single
Family
Year-Over-Year
Change
Condo/TIC/
Coop
Year-Over-Year
Change
Oct-2016 2.7 +22.7% 3.5 +29.6%
Nov-2016 2.1 +10.5% 2.5 +13.6%
Dec-2016 1.4 +16.7% 1.7 +6.3%
Jan-2017 1.8 +12.5% 2.4 +20.0%
Feb-2017 1.9 -5.0% 2.7 +17.4%
Mar-2017 2.1 -12.5% 2.7 -3.6%
Apr-2017 2.3 -11.5% 2.7 -12.9%
May-2017 2.4 -4.0% 2.8 -12.5%
Jun-2017 2.1 -8.7% 2.5 -28.6%
Jul-2017 2.1 -16.0% 2.5 -19.4%
Aug-2017 1.9 -13.6% 2.5 -13.8%
Sep-2017 2.0 -31.0% 2.8 -20.0%
12-Month Avg* 2.1 -6.0% 2.6 -4.6%
Historical Months Supply of Inventory by Month
* Months Supply for all properties from October 2016 through September 2017. This is not the
average of the individual figures above.
Current as of October 11, 2017. All data from the San Francisco MLS. Report © 2017 ShowingTime. | 14
The inventory of homes for sale at the end of a given month, divided by the average monthly pending sales from the last 12 months.
2.4
2.82.9
3.5
2.0
2.8
Single Family Condo/TIC/Coop
September
0.0
2.0
4.0
6.0
8.0
10.0
1-2005 1-2006 1-2007 1-2008 1-2009 1-2010 1-2011 1-2012 1-2013 1-2014 1-2015 1-2016 1-2017
Single Family Condo/TIC/Coop
2015 2016 2017
- 20.0%+ 25.0%- 31.0%+ 20.8%
2015 2016 2017
- 4.0% + 27.3%
All Properties Activity Overview
Key metrics by report month and for year-to-date (YTD) starting from the first of the year.
Key Metrics Historical Sparkbars 9-2016 9-2017 Percent Change YTD 2016 YTD 2017 Percent Change
- 8.1%
Pending Sales 402 441 + 9.7% 3,760 3,842 + 2.2%
New Listings 782 653 - 16.5% 5,402 4,962
Sold Listings 412 338 - 18.0% 3,647 3,673 + 0.7%
Median Sales Price $1,123,000 $1,250,000 + 11.3% $1,185,000 $1,250,000 + 5.5%
+ 4.7%
33 - 5.7%
$1,490,484
-- --
Days on Market 40 36 - 10.0% 35
Avg. Sales Price $1,328,974 $1,430,012 + 7.6% $1,423,805
Active Listings 1,357 1,044 - 23.1% --
% of Properties Sold Over List Price 66.5% 69.8% + 5.0% 67.2%
44
67.5% + 0.4%
+ 1.2%
41 - 6.8%
109.5%% of List Price Received 107.1% 110.6% + 3.3% 108.2%
Current as of October 11, 2017. All data from the San Francisco MLS. Report © 2017 ShowingTime. | 15
Months Supply 3.2 2.5 - 21.9% -- -- --
Affordability Ratio 47 43 - 8.5%
9-2014 9-2015 9-2016 9-2017
9-2014 9-2015 9-2016 9-2017
9-2014 9-2015 9-2016 9-2017
9-2014 9-2015 9-2016 9-2017
9-2014 9-2015 9-2016 9-2017
9-2014 9-2015 9-2016 9-2017
9-2014 9-2015 9-2016 9-2017
9-2014 9-2015 9-2016 9-2017
9-2014 9-2015 9-2016 9-2017
9-2014 9-2015 9-2016 9-2017
9-2014 9-2015 9-2016 9-2017
Activity by District
SF District 1: Northwest (Sea Cliff, Lake, Jordan Park / Laurel Heights, Outer Richmond, Central Richmond, Inner Richmond, Lone Mountain)
SF District 2: Central West (Outer Sunset, Central Sunset, Inner Sunset, Outer Parkside, Parkside, Inner Parkside, Golden Gate Heights)
SF District 3: Southwest (Pine Lake Park, Lake Shore, Merced Manor, Stonestown, Lakeside, Merced Heights, Ingleside, Ingleside Heights, Oceanview)
SF District 4: Twin Peaks W (Forest Hill (& Ext), W Portal, St Francis Wd, Balboa Terr, Mt Dav Manor, Ingleside Terr, Monterey Hts, Wstwd Pk & H'lnds, Shrwd Fst, Miraloma Pk, Dmnd Hts, Mdtwn Terr)
SF District 5: Central (Haight Ashbury, Cole Vly / Prnssus Hts, Clarndn Hts, Corona Hts, Twin Pks, Glen Pk, Noe Vly, Eureka Vly / Dolores Hts, Mission Dolores, Duboce Trngl, Buena Vista / Ashbury Hts)
SF District 6: Central North (Lower Pacific Heights, Anza Vista, Western Addition, North Panhandle, Alamo Square, Hayes Valley)
SF District 7: North (Marina, Cow Hollow, Presidio Heights, Pacific Heights)
SF District 8: Northeast (North Waterfront, North Beach, Russian Hill, Telegraph Hill, Nob Hill, Financial District / Barbary Coast, Downtown, Van Ness / Civic Center, Tenderloin)
SF District 9: Central East (Yerba Buena, South Beach, South of Market, Mission Bay, Inner Mission, Potrero Hill, Central Waterfront / Dogpatch, Bernal Heights)
SF District 10: Southeast (Outer Mission, Mission Terr, Excelsior, Portola, Bayview, Silver Terr, Hunters Pt, Candlestick Pt, Bayview Hts, Little Hollywood, Visitation Vly, Crocker Amazon)
9-2016 9-2017 + / – 9-2016 9-2017 + / – 9-2016 9-2017 + / – 9-2016 9-2017 + / – 9-2016 9-2017 + / –
Single Family
1 SF District 1 42 29 -31.0% 13 8 -38.5% $1,820,000 $2,412,500 +32.6% 46 9 -80.4% 3.0 2.1 -30.0%
2 SF District 2 72 39 -45.8% 31 38 +22.6% $1,220,000 $1,396,500 +14.5% 31 23 -25.8% 2.2 1.1 -50.0%
3 SF District 3 42 20 -52.4% 13 16 +23.1% $820,000 $1,115,000 +36.0% 30 19 -36.7% 2.5 1.4 -44.0%
4 SF District 4 61 40 -34.4% 29 21 -27.6% $1,489,000 $1,400,000 -6.0% 51 12 -76.5% 2.2 1.6 -27.3%
5 SF District 5 86 66 -23.3% 20 16 -20.0% $2,010,035 $1,802,500 -10.3% 26 28 +7.7% 3.4 2.5 -26.5%
6 SF District 6 13 12 -7.7% 2 1 -50.0% $2,585,000 $2,950,000 +14.1% 28 28 0.0% 4.2 4.0 -4.8%
7 SF District 7 40 36 -10.0% 5 5 0.0% $4,600,000 $3,500,000 -23.9% 17 85 +400.0% 4.7 4.5 -4.3%
8 SF District 8 15 13 -13.3% 0 3 -- $0 $3,535,000 -- 0 50 -- 7.0 5.1 -27.1%
9 SF District 9 57 46 -19.3% 23 16 -30.4% $1,350,000 $1,475,000 +9.3% 63 36 -42.9% 2.7 2.1 -22.2%
10 SF District 10 104 77 -26.0% 42 42 0.0% $826,500 $870,500 +5.3% 41 35 -14.6% 2.9 1.9 -34.5%
Condo/TIC/Coop
1 SF District 1 31 29 -6.5% 10 3 -70.0% $1,279,000 $1,400,000 +9.5% 46 15 -67.4% 2.4 3.2 +33.3%
2 SF District 2 15 6 -60.0% 7 4 -42.9% $1,055,000 $857,500 -18.7% 60 44 -26.7% 3.3 1.9 -42.4%
3 SF District 3 10 6 -40.0% 5 0 -100.0% $1,093,003 $0 -100.0% 32 0 -100.0% 2.6 1.9 -26.9%
4 SF District 4 9 9 0.0% 2 5 +150.0% $777,500 $875,000 +12.5% 73 15 -79.5% 3.5 3.0 -14.3%
5 SF District 5 101 80 -20.8% 30 17 -43.3% $1,287,500 $1,435,000 +11.5% 32 35 +9.4% 3.0 2.3 -23.3%
6 SF District 6 105 70 -33.3% 29 22 -24.1% $940,000 $1,362,500 +44.9% 28 31 +10.7% 4.0 2.7 -32.5%
7 SF District 7 73 44 -39.7% 23 14 -39.1% $1,250,000 $1,360,000 +8.8% 39 27 -30.8% 3.2 1.6 -50.0%
8 SF District 8 139 129 -7.2% 40 30 -25.0% $1,012,500 $1,122,500 +10.9% 34 68 +100.0% 3.6 3.3 -8.3%
9 SF District 9 315 266 -15.6% 78 71 -9.0% $944,500 $1,065,000 +12.8% 46 40 -13.0% 3.8 3.2 -15.8%
10 SF District 10 27 27 0.0% 10 6 -40.0% $590,000 $782,500 +32.6% 51 95 +86.3% 4.3 3.9 -9.3%
Key metrics by report month for the districts of San Fransisco.
Current as of October 11, 2017. All data from the San Francisco MLS. Report © 2017 ShowingTime. | 16
Active Listings Sold Listings Median Sales Price Days on Market Months Supply

More Related Content

What's hot

San Francisco Market Focus November 2017
San Francisco Market Focus November 2017San Francisco Market Focus November 2017
San Francisco Market Focus November 2017Ronny Budiutama
 
San Francisco Real Estate Housing Market December 2016
San Francisco Real Estate Housing Market December 2016San Francisco Real Estate Housing Market December 2016
San Francisco Real Estate Housing Market December 2016Ronny Budiutama
 
San Francisco Market Focus August 2017
San Francisco Market Focus August 2017San Francisco Market Focus August 2017
San Francisco Market Focus August 2017Ronny Budiutama
 
San Francisco Market Focus Report May
San Francisco Market Focus Report MaySan Francisco Market Focus Report May
San Francisco Market Focus Report MayRonny Budiutama
 
San Francisco Market Focus June 2013
San Francisco Market Focus June 2013San Francisco Market Focus June 2013
San Francisco Market Focus June 2013Ronny Budiutama
 
San Francisco Market Focus April 2016
San Francisco Market Focus April 2016San Francisco Market Focus April 2016
San Francisco Market Focus April 2016Ronny Budiutama
 
San Francisco Market Focus October 2016
San Francisco Market Focus October 2016San Francisco Market Focus October 2016
San Francisco Market Focus October 2016Ronny Budiutama
 
Greater Boston Association of Realtors January 2017 Monthly Indicators Report
Greater Boston Association of Realtors January 2017 Monthly Indicators ReportGreater Boston Association of Realtors January 2017 Monthly Indicators Report
Greater Boston Association of Realtors January 2017 Monthly Indicators ReportJoe Schutt
 
San Francisco Market Focus March 2017
San Francisco Market Focus March 2017San Francisco Market Focus March 2017
San Francisco Market Focus March 2017Ronny Budiutama
 
Gbar monthly-market-insights-report-november20
Gbar monthly-market-insights-report-november20Gbar monthly-market-insights-report-november20
Gbar monthly-market-insights-report-november20Joe Schutt
 
San Francisco Market Focus June 2014
San Francisco Market Focus June 2014San Francisco Market Focus June 2014
San Francisco Market Focus June 2014Ronny Budiutama
 
December 2016 Greater Boston Real Estate Market Trends
December 2016 Greater Boston Real Estate Market TrendsDecember 2016 Greater Boston Real Estate Market Trends
December 2016 Greater Boston Real Estate Market TrendsJoe Schutt
 
San Francisco Market Focus June 2016
San Francisco Market Focus June 2016San Francisco Market Focus June 2016
San Francisco Market Focus June 2016Ronny Budiutama
 
San Francisco Market Focus August 2016
San Francisco Market Focus August 2016San Francisco Market Focus August 2016
San Francisco Market Focus August 2016Ronny Budiutama
 
San Francisco Market Focus October 2014
San Francisco Market Focus October 2014San Francisco Market Focus October 2014
San Francisco Market Focus October 2014Ronny Budiutama
 
San Francisco Market Focus September 2016
San Francisco Market Focus September 2016San Francisco Market Focus September 2016
San Francisco Market Focus September 2016Ronny Budiutama
 
San Francisco Market Focus February 2014
San Francisco Market Focus February 2014San Francisco Market Focus February 2014
San Francisco Market Focus February 2014Ronny Budiutama
 
San Francisco Market Data December 2014
San Francisco Market Data December 2014San Francisco Market Data December 2014
San Francisco Market Data December 2014Ronny Budiutama
 
San Francisco Market Focus July 2016
San Francisco Market Focus July 2016San Francisco Market Focus July 2016
San Francisco Market Focus July 2016Ronny Budiutama
 
San Francisco Real Estate Housing Market January 2017
San Francisco Real Estate Housing Market January 2017San Francisco Real Estate Housing Market January 2017
San Francisco Real Estate Housing Market January 2017Ronny Budiutama
 

What's hot (20)

San Francisco Market Focus November 2017
San Francisco Market Focus November 2017San Francisco Market Focus November 2017
San Francisco Market Focus November 2017
 
San Francisco Real Estate Housing Market December 2016
San Francisco Real Estate Housing Market December 2016San Francisco Real Estate Housing Market December 2016
San Francisco Real Estate Housing Market December 2016
 
San Francisco Market Focus August 2017
San Francisco Market Focus August 2017San Francisco Market Focus August 2017
San Francisco Market Focus August 2017
 
San Francisco Market Focus Report May
San Francisco Market Focus Report MaySan Francisco Market Focus Report May
San Francisco Market Focus Report May
 
San Francisco Market Focus June 2013
San Francisco Market Focus June 2013San Francisco Market Focus June 2013
San Francisco Market Focus June 2013
 
San Francisco Market Focus April 2016
San Francisco Market Focus April 2016San Francisco Market Focus April 2016
San Francisco Market Focus April 2016
 
San Francisco Market Focus October 2016
San Francisco Market Focus October 2016San Francisco Market Focus October 2016
San Francisco Market Focus October 2016
 
Greater Boston Association of Realtors January 2017 Monthly Indicators Report
Greater Boston Association of Realtors January 2017 Monthly Indicators ReportGreater Boston Association of Realtors January 2017 Monthly Indicators Report
Greater Boston Association of Realtors January 2017 Monthly Indicators Report
 
San Francisco Market Focus March 2017
San Francisco Market Focus March 2017San Francisco Market Focus March 2017
San Francisco Market Focus March 2017
 
Gbar monthly-market-insights-report-november20
Gbar monthly-market-insights-report-november20Gbar monthly-market-insights-report-november20
Gbar monthly-market-insights-report-november20
 
San Francisco Market Focus June 2014
San Francisco Market Focus June 2014San Francisco Market Focus June 2014
San Francisco Market Focus June 2014
 
December 2016 Greater Boston Real Estate Market Trends
December 2016 Greater Boston Real Estate Market TrendsDecember 2016 Greater Boston Real Estate Market Trends
December 2016 Greater Boston Real Estate Market Trends
 
San Francisco Market Focus June 2016
San Francisco Market Focus June 2016San Francisco Market Focus June 2016
San Francisco Market Focus June 2016
 
San Francisco Market Focus August 2016
San Francisco Market Focus August 2016San Francisco Market Focus August 2016
San Francisco Market Focus August 2016
 
San Francisco Market Focus October 2014
San Francisco Market Focus October 2014San Francisco Market Focus October 2014
San Francisco Market Focus October 2014
 
San Francisco Market Focus September 2016
San Francisco Market Focus September 2016San Francisco Market Focus September 2016
San Francisco Market Focus September 2016
 
San Francisco Market Focus February 2014
San Francisco Market Focus February 2014San Francisco Market Focus February 2014
San Francisco Market Focus February 2014
 
San Francisco Market Data December 2014
San Francisco Market Data December 2014San Francisco Market Data December 2014
San Francisco Market Data December 2014
 
San Francisco Market Focus July 2016
San Francisco Market Focus July 2016San Francisco Market Focus July 2016
San Francisco Market Focus July 2016
 
San Francisco Real Estate Housing Market January 2017
San Francisco Real Estate Housing Market January 2017San Francisco Real Estate Housing Market January 2017
San Francisco Real Estate Housing Market January 2017
 

Similar to San Francisco Market Focus Sept 2017

San Francisco Market Focus August 2017
San Francisco Market Focus August 2017San Francisco Market Focus August 2017
San Francisco Market Focus August 2017Ronny Budiutama
 
San Francisco Market Focus Report September 2018
San Francisco Market Focus Report September 2018San Francisco Market Focus Report September 2018
San Francisco Market Focus Report September 2018Ronny Budiutama
 
San Francisco Market Focus April 2018
San Francisco Market Focus April 2018San Francisco Market Focus April 2018
San Francisco Market Focus April 2018Ronny Budiutama
 
San Francisco Market Focus March 2018
San Francisco Market Focus March 2018San Francisco Market Focus March 2018
San Francisco Market Focus March 2018Ronny Budiutama
 
San Francisco Market Focus November 2016
San Francisco Market Focus November 2016San Francisco Market Focus November 2016
San Francisco Market Focus November 2016Ronny Budiutama
 
San Francisco Market Focus Report Aug 2018
San Francisco Market Focus Report Aug 2018San Francisco Market Focus Report Aug 2018
San Francisco Market Focus Report Aug 2018Ronny Budiutama
 
San Francisco Market Focus Report December 2018
San Francisco Market Focus Report December 2018San Francisco Market Focus Report December 2018
San Francisco Market Focus Report December 2018Ronny Budiutama
 
San Francisco Market Focus February 2018
San Francisco Market Focus February 2018San Francisco Market Focus February 2018
San Francisco Market Focus February 2018Ronny Budiutama
 
San Francisco market focus report June 2018
San Francisco market focus report June 2018San Francisco market focus report June 2018
San Francisco market focus report June 2018Ronny Budiutama
 
San Francisco Market Focus Report November 2018
San Francisco Market Focus Report November 2018San Francisco Market Focus Report November 2018
San Francisco Market Focus Report November 2018Ronny Budiutama
 
San Francisco Market Report September 2021
San Francisco Market Report September 2021San Francisco Market Report September 2021
San Francisco Market Report September 2021Ronny Budiutama
 
San Francisco Market Focus Report May 2019
San Francisco Market Focus Report May 2019San Francisco Market Focus Report May 2019
San Francisco Market Focus Report May 2019Ronny Budiutama
 
San Francisco Market Focus July 2015
San Francisco Market Focus July 2015San Francisco Market Focus July 2015
San Francisco Market Focus July 2015Ronny Budiutama
 
January 2018 San Francisco Market Update
January 2018 San Francisco Market UpdateJanuary 2018 San Francisco Market Update
January 2018 San Francisco Market UpdateRonny Budiutama
 
San Francisco Market Focus May 2016
San Francisco Market Focus May 2016San Francisco Market Focus May 2016
San Francisco Market Focus May 2016Ronny Budiutama
 
San Francisco Market Focus March 2016
San Francisco Market Focus March 2016San Francisco Market Focus March 2016
San Francisco Market Focus March 2016Ronny Budiutama
 
San Francisco Market Focus June 2015
San Francisco Market Focus June 2015San Francisco Market Focus June 2015
San Francisco Market Focus June 2015Ronny Budiutama
 
San Francisco market focus report December 2019
San Francisco market focus report December 2019San Francisco market focus report December 2019
San Francisco market focus report December 2019Ronny Budiutama
 

Similar to San Francisco Market Focus Sept 2017 (18)

San Francisco Market Focus August 2017
San Francisco Market Focus August 2017San Francisco Market Focus August 2017
San Francisco Market Focus August 2017
 
San Francisco Market Focus Report September 2018
San Francisco Market Focus Report September 2018San Francisco Market Focus Report September 2018
San Francisco Market Focus Report September 2018
 
San Francisco Market Focus April 2018
San Francisco Market Focus April 2018San Francisco Market Focus April 2018
San Francisco Market Focus April 2018
 
San Francisco Market Focus March 2018
San Francisco Market Focus March 2018San Francisco Market Focus March 2018
San Francisco Market Focus March 2018
 
San Francisco Market Focus November 2016
San Francisco Market Focus November 2016San Francisco Market Focus November 2016
San Francisco Market Focus November 2016
 
San Francisco Market Focus Report Aug 2018
San Francisco Market Focus Report Aug 2018San Francisco Market Focus Report Aug 2018
San Francisco Market Focus Report Aug 2018
 
San Francisco Market Focus Report December 2018
San Francisco Market Focus Report December 2018San Francisco Market Focus Report December 2018
San Francisco Market Focus Report December 2018
 
San Francisco Market Focus February 2018
San Francisco Market Focus February 2018San Francisco Market Focus February 2018
San Francisco Market Focus February 2018
 
San Francisco market focus report June 2018
San Francisco market focus report June 2018San Francisco market focus report June 2018
San Francisco market focus report June 2018
 
San Francisco Market Focus Report November 2018
San Francisco Market Focus Report November 2018San Francisco Market Focus Report November 2018
San Francisco Market Focus Report November 2018
 
San Francisco Market Report September 2021
San Francisco Market Report September 2021San Francisco Market Report September 2021
San Francisco Market Report September 2021
 
San Francisco Market Focus Report May 2019
San Francisco Market Focus Report May 2019San Francisco Market Focus Report May 2019
San Francisco Market Focus Report May 2019
 
San Francisco Market Focus July 2015
San Francisco Market Focus July 2015San Francisco Market Focus July 2015
San Francisco Market Focus July 2015
 
January 2018 San Francisco Market Update
January 2018 San Francisco Market UpdateJanuary 2018 San Francisco Market Update
January 2018 San Francisco Market Update
 
San Francisco Market Focus May 2016
San Francisco Market Focus May 2016San Francisco Market Focus May 2016
San Francisco Market Focus May 2016
 
San Francisco Market Focus March 2016
San Francisco Market Focus March 2016San Francisco Market Focus March 2016
San Francisco Market Focus March 2016
 
San Francisco Market Focus June 2015
San Francisco Market Focus June 2015San Francisco Market Focus June 2015
San Francisco Market Focus June 2015
 
San Francisco market focus report December 2019
San Francisco market focus report December 2019San Francisco market focus report December 2019
San Francisco market focus report December 2019
 

More from Ronny Budiutama

San Francisco January 2024 Market Report
San Francisco January 2024 Market ReportSan Francisco January 2024 Market Report
San Francisco January 2024 Market ReportRonny Budiutama
 
San Francisco December 2023 Market Report
San Francisco December 2023 Market ReportSan Francisco December 2023 Market Report
San Francisco December 2023 Market ReportRonny Budiutama
 
San Francisco November 2023 Market Report
San Francisco November 2023 Market ReportSan Francisco November 2023 Market Report
San Francisco November 2023 Market ReportRonny Budiutama
 
2023 Annual San Francisco Housing Market
2023 Annual San Francisco Housing Market2023 Annual San Francisco Housing Market
2023 Annual San Francisco Housing MarketRonny Budiutama
 
October 2023 Report: San Francisco Real Estate Market Insights
October 2023 Report: San Francisco Real Estate Market InsightsOctober 2023 Report: San Francisco Real Estate Market Insights
October 2023 Report: San Francisco Real Estate Market InsightsRonny Budiutama
 
CA Weekly MLS Market Data Report - August 2023
CA Weekly MLS Market Data Report - August 2023CA Weekly MLS Market Data Report - August 2023
CA Weekly MLS Market Data Report - August 2023Ronny Budiutama
 
San Francisco Market Report July 2023.pdf
San Francisco Market Report July 2023.pdfSan Francisco Market Report July 2023.pdf
San Francisco Market Report July 2023.pdfRonny Budiutama
 
San Francisco May 2023 Market Report.pdf
San Francisco May 2023 Market Report.pdfSan Francisco May 2023 Market Report.pdf
San Francisco May 2023 Market Report.pdfRonny Budiutama
 
San Francisco June 2023 Market Report.pdf
San Francisco June 2023 Market Report.pdfSan Francisco June 2023 Market Report.pdf
San Francisco June 2023 Market Report.pdfRonny Budiutama
 
San Francisco Market Report March 2023.pdf
San Francisco Market Report March 2023.pdfSan Francisco Market Report March 2023.pdf
San Francisco Market Report March 2023.pdfRonny Budiutama
 
San Francisco Market Report February 2023
San Francisco Market Report February 2023San Francisco Market Report February 2023
San Francisco Market Report February 2023Ronny Budiutama
 
San Francisco Market Report January 2023.pdf
San Francisco Market Report January 2023.pdfSan Francisco Market Report January 2023.pdf
San Francisco Market Report January 2023.pdfRonny Budiutama
 
Annual Report on the San Francisco County Housing Market.pdf
Annual Report on the San Francisco County Housing Market.pdfAnnual Report on the San Francisco County Housing Market.pdf
Annual Report on the San Francisco County Housing Market.pdfRonny Budiutama
 
San Francisco Market Report December 2022.pdf
San Francisco Market Report December 2022.pdfSan Francisco Market Report December 2022.pdf
San Francisco Market Report December 2022.pdfRonny Budiutama
 
San Francisco Market Report November 2022.pdf
San Francisco Market Report November 2022.pdfSan Francisco Market Report November 2022.pdf
San Francisco Market Report November 2022.pdfRonny Budiutama
 
San Francisco Market Report October 2022.pdf
San Francisco Market Report October 2022.pdfSan Francisco Market Report October 2022.pdf
San Francisco Market Report October 2022.pdfRonny Budiutama
 
San Francisco Market Report September 2022.pdf
San Francisco Market Report September 2022.pdfSan Francisco Market Report September 2022.pdf
San Francisco Market Report September 2022.pdfRonny Budiutama
 
San Francisco Market Report August 2022.pdf
San Francisco Market Report August 2022.pdfSan Francisco Market Report August 2022.pdf
San Francisco Market Report August 2022.pdfRonny Budiutama
 
San Francisco Market Report July 2022.pdf
San Francisco Market Report July 2022.pdfSan Francisco Market Report July 2022.pdf
San Francisco Market Report July 2022.pdfRonny Budiutama
 
San Francisco Market Report June 2022.pdf
San Francisco Market Report June 2022.pdfSan Francisco Market Report June 2022.pdf
San Francisco Market Report June 2022.pdfRonny Budiutama
 

More from Ronny Budiutama (20)

San Francisco January 2024 Market Report
San Francisco January 2024 Market ReportSan Francisco January 2024 Market Report
San Francisco January 2024 Market Report
 
San Francisco December 2023 Market Report
San Francisco December 2023 Market ReportSan Francisco December 2023 Market Report
San Francisco December 2023 Market Report
 
San Francisco November 2023 Market Report
San Francisco November 2023 Market ReportSan Francisco November 2023 Market Report
San Francisco November 2023 Market Report
 
2023 Annual San Francisco Housing Market
2023 Annual San Francisco Housing Market2023 Annual San Francisco Housing Market
2023 Annual San Francisco Housing Market
 
October 2023 Report: San Francisco Real Estate Market Insights
October 2023 Report: San Francisco Real Estate Market InsightsOctober 2023 Report: San Francisco Real Estate Market Insights
October 2023 Report: San Francisco Real Estate Market Insights
 
CA Weekly MLS Market Data Report - August 2023
CA Weekly MLS Market Data Report - August 2023CA Weekly MLS Market Data Report - August 2023
CA Weekly MLS Market Data Report - August 2023
 
San Francisco Market Report July 2023.pdf
San Francisco Market Report July 2023.pdfSan Francisco Market Report July 2023.pdf
San Francisco Market Report July 2023.pdf
 
San Francisco May 2023 Market Report.pdf
San Francisco May 2023 Market Report.pdfSan Francisco May 2023 Market Report.pdf
San Francisco May 2023 Market Report.pdf
 
San Francisco June 2023 Market Report.pdf
San Francisco June 2023 Market Report.pdfSan Francisco June 2023 Market Report.pdf
San Francisco June 2023 Market Report.pdf
 
San Francisco Market Report March 2023.pdf
San Francisco Market Report March 2023.pdfSan Francisco Market Report March 2023.pdf
San Francisco Market Report March 2023.pdf
 
San Francisco Market Report February 2023
San Francisco Market Report February 2023San Francisco Market Report February 2023
San Francisco Market Report February 2023
 
San Francisco Market Report January 2023.pdf
San Francisco Market Report January 2023.pdfSan Francisco Market Report January 2023.pdf
San Francisco Market Report January 2023.pdf
 
Annual Report on the San Francisco County Housing Market.pdf
Annual Report on the San Francisco County Housing Market.pdfAnnual Report on the San Francisco County Housing Market.pdf
Annual Report on the San Francisco County Housing Market.pdf
 
San Francisco Market Report December 2022.pdf
San Francisco Market Report December 2022.pdfSan Francisco Market Report December 2022.pdf
San Francisco Market Report December 2022.pdf
 
San Francisco Market Report November 2022.pdf
San Francisco Market Report November 2022.pdfSan Francisco Market Report November 2022.pdf
San Francisco Market Report November 2022.pdf
 
San Francisco Market Report October 2022.pdf
San Francisco Market Report October 2022.pdfSan Francisco Market Report October 2022.pdf
San Francisco Market Report October 2022.pdf
 
San Francisco Market Report September 2022.pdf
San Francisco Market Report September 2022.pdfSan Francisco Market Report September 2022.pdf
San Francisco Market Report September 2022.pdf
 
San Francisco Market Report August 2022.pdf
San Francisco Market Report August 2022.pdfSan Francisco Market Report August 2022.pdf
San Francisco Market Report August 2022.pdf
 
San Francisco Market Report July 2022.pdf
San Francisco Market Report July 2022.pdfSan Francisco Market Report July 2022.pdf
San Francisco Market Report July 2022.pdf
 
San Francisco Market Report June 2022.pdf
San Francisco Market Report June 2022.pdfSan Francisco Market Report June 2022.pdf
San Francisco Market Report June 2022.pdf
 

Recently uploaded

Call Girls in Pitampura Delhi 💯Call Us 🔝8264348440🔝
Call Girls in Pitampura Delhi 💯Call Us 🔝8264348440🔝Call Girls in Pitampura Delhi 💯Call Us 🔝8264348440🔝
Call Girls in Pitampura Delhi 💯Call Us 🔝8264348440🔝soniya singh
 
SSPL The Strand Abodes Kharadi Pune Brochure.pdf
SSPL The Strand Abodes Kharadi Pune Brochure.pdfSSPL The Strand Abodes Kharadi Pune Brochure.pdf
SSPL The Strand Abodes Kharadi Pune Brochure.pdfabbu831446
 
Low Rate Call Girls in Akshardham Delhi Call 9990771857
Low Rate Call Girls in Akshardham   Delhi Call 9990771857Low Rate Call Girls in Akshardham   Delhi Call 9990771857
Low Rate Call Girls in Akshardham Delhi Call 9990771857delhimodel235
 
Building Dreams: Newman Leech's Visionary Approach to Real Estate Investment
Building Dreams: Newman Leech's Visionary Approach to Real Estate InvestmentBuilding Dreams: Newman Leech's Visionary Approach to Real Estate Investment
Building Dreams: Newman Leech's Visionary Approach to Real Estate InvestmentNewman George Leech
 
Call Girls In Mayur Vihar-1 Delhi ❤️8860477959 Good Looking Escorts In 24/7 D...
Call Girls In Mayur Vihar-1 Delhi ❤️8860477959 Good Looking Escorts In 24/7 D...Call Girls In Mayur Vihar-1 Delhi ❤️8860477959 Good Looking Escorts In 24/7 D...
Call Girls In Mayur Vihar-1 Delhi ❤️8860477959 Good Looking Escorts In 24/7 D...lizamodels9
 
call girls in Shahdara (DELHI) 🔝 >༒9953330565🔝 genuine Escort Service 🔝✔️✔️
call girls in Shahdara (DELHI) 🔝 >༒9953330565🔝 genuine Escort Service 🔝✔️✔️call girls in Shahdara (DELHI) 🔝 >༒9953330565🔝 genuine Escort Service 🔝✔️✔️
call girls in Shahdara (DELHI) 🔝 >༒9953330565🔝 genuine Escort Service 🔝✔️✔️9953056974 Low Rate Call Girls In Saket, Delhi NCR
 
Call Girls in Khan Market 9654467111 ESCORTS SERVICE
Call Girls in Khan Market 9654467111 ESCORTS SERVICECall Girls in Khan Market 9654467111 ESCORTS SERVICE
Call Girls in Khan Market 9654467111 ESCORTS SERVICESapana Sha
 
Shapoorji Pallonji Parkwest Sequoia Tower Bangalore.pdf
Shapoorji Pallonji Parkwest Sequoia Tower Bangalore.pdfShapoorji Pallonji Parkwest Sequoia Tower Bangalore.pdf
Shapoorji Pallonji Parkwest Sequoia Tower Bangalore.pdfashiyadav24
 
Sobha Aranya Sector 80 Gurgaon E- Brochure.pdf
Sobha Aranya Sector 80 Gurgaon E- Brochure.pdfSobha Aranya Sector 80 Gurgaon E- Brochure.pdf
Sobha Aranya Sector 80 Gurgaon E- Brochure.pdffaheemali990101
 
Call Girls In Madipur Metro Delhi꧁ +91)8447779280꧂Low Rate 2 short 2000 full ...
Call Girls In Madipur Metro Delhi꧁ +91)8447779280꧂Low Rate 2 short 2000 full ...Call Girls In Madipur Metro Delhi꧁ +91)8447779280꧂Low Rate 2 short 2000 full ...
Call Girls In Madipur Metro Delhi꧁ +91)8447779280꧂Low Rate 2 short 2000 full ...asmaqueen5
 
9990771857 Call Girls in Noida Sector 06 Noida (Call Girls) Delhi
9990771857 Call Girls in Noida Sector 06 Noida (Call Girls) Delhi9990771857 Call Girls in Noida Sector 06 Noida (Call Girls) Delhi
9990771857 Call Girls in Noida Sector 06 Noida (Call Girls) Delhidelhimodel235
 
The Omaxe State Dwarka Delhi-broucher.pdf.pdf
The Omaxe State Dwarka Delhi-broucher.pdf.pdfThe Omaxe State Dwarka Delhi-broucher.pdf.pdf
The Omaxe State Dwarka Delhi-broucher.pdf.pdfkratirudram
 
Purva Palm Hills Devanahalli, Bangalore E- Brochure.pdf
Purva Palm Hills Devanahalli, Bangalore E- Brochure.pdfPurva Palm Hills Devanahalli, Bangalore E- Brochure.pdf
Purva Palm Hills Devanahalli, Bangalore E- Brochure.pdffaheemali990101
 
8 Key Elements for Comfortable Farmland Living
8 Key Elements for Comfortable Farmland Living 8 Key Elements for Comfortable Farmland Living
8 Key Elements for Comfortable Farmland Living Farmland Bazaar
 
Choose Noida's Leading Architect
Choose    Noida's    Leading   ArchitectChoose    Noida's    Leading   Architect
Choose Noida's Leading ArchitectMM Design Studio
 
Call Girls in Model Town Delhi 💯Call Us 🔝8264348440🔝
Call Girls in Model Town Delhi 💯Call Us 🔝8264348440🔝Call Girls in Model Town Delhi 💯Call Us 🔝8264348440🔝
Call Girls in Model Town Delhi 💯Call Us 🔝8264348440🔝soniya singh
 

Recently uploaded (20)

9953056974 Low Rate Call Girls In Saket, Delhi NCR
9953056974 Low Rate Call Girls In Saket, Delhi NCR9953056974 Low Rate Call Girls In Saket, Delhi NCR
9953056974 Low Rate Call Girls In Saket, Delhi NCR
 
Call Girls in Pitampura Delhi 💯Call Us 🔝8264348440🔝
Call Girls in Pitampura Delhi 💯Call Us 🔝8264348440🔝Call Girls in Pitampura Delhi 💯Call Us 🔝8264348440🔝
Call Girls in Pitampura Delhi 💯Call Us 🔝8264348440🔝
 
SSPL The Strand Abodes Kharadi Pune Brochure.pdf
SSPL The Strand Abodes Kharadi Pune Brochure.pdfSSPL The Strand Abodes Kharadi Pune Brochure.pdf
SSPL The Strand Abodes Kharadi Pune Brochure.pdf
 
Low Rate Call Girls in Akshardham Delhi Call 9990771857
Low Rate Call Girls in Akshardham   Delhi Call 9990771857Low Rate Call Girls in Akshardham   Delhi Call 9990771857
Low Rate Call Girls in Akshardham Delhi Call 9990771857
 
Building Dreams: Newman Leech's Visionary Approach to Real Estate Investment
Building Dreams: Newman Leech's Visionary Approach to Real Estate InvestmentBuilding Dreams: Newman Leech's Visionary Approach to Real Estate Investment
Building Dreams: Newman Leech's Visionary Approach to Real Estate Investment
 
Call Girls In Mayur Vihar-1 Delhi ❤️8860477959 Good Looking Escorts In 24/7 D...
Call Girls In Mayur Vihar-1 Delhi ❤️8860477959 Good Looking Escorts In 24/7 D...Call Girls In Mayur Vihar-1 Delhi ❤️8860477959 Good Looking Escorts In 24/7 D...
Call Girls In Mayur Vihar-1 Delhi ❤️8860477959 Good Looking Escorts In 24/7 D...
 
call girls in Shahdara (DELHI) 🔝 >༒9953330565🔝 genuine Escort Service 🔝✔️✔️
call girls in Shahdara (DELHI) 🔝 >༒9953330565🔝 genuine Escort Service 🔝✔️✔️call girls in Shahdara (DELHI) 🔝 >༒9953330565🔝 genuine Escort Service 🔝✔️✔️
call girls in Shahdara (DELHI) 🔝 >༒9953330565🔝 genuine Escort Service 🔝✔️✔️
 
Call Girls in Khan Market 9654467111 ESCORTS SERVICE
Call Girls in Khan Market 9654467111 ESCORTS SERVICECall Girls in Khan Market 9654467111 ESCORTS SERVICE
Call Girls in Khan Market 9654467111 ESCORTS SERVICE
 
Shapoorji Pallonji Parkwest Sequoia Tower Bangalore.pdf
Shapoorji Pallonji Parkwest Sequoia Tower Bangalore.pdfShapoorji Pallonji Parkwest Sequoia Tower Bangalore.pdf
Shapoorji Pallonji Parkwest Sequoia Tower Bangalore.pdf
 
Sobha Aranya Sector 80 Gurgaon E- Brochure.pdf
Sobha Aranya Sector 80 Gurgaon E- Brochure.pdfSobha Aranya Sector 80 Gurgaon E- Brochure.pdf
Sobha Aranya Sector 80 Gurgaon E- Brochure.pdf
 
Call Girls In Madipur Metro Delhi꧁ +91)8447779280꧂Low Rate 2 short 2000 full ...
Call Girls In Madipur Metro Delhi꧁ +91)8447779280꧂Low Rate 2 short 2000 full ...Call Girls In Madipur Metro Delhi꧁ +91)8447779280꧂Low Rate 2 short 2000 full ...
Call Girls In Madipur Metro Delhi꧁ +91)8447779280꧂Low Rate 2 short 2000 full ...
 
9990771857 Call Girls in Noida Sector 06 Noida (Call Girls) Delhi
9990771857 Call Girls in Noida Sector 06 Noida (Call Girls) Delhi9990771857 Call Girls in Noida Sector 06 Noida (Call Girls) Delhi
9990771857 Call Girls in Noida Sector 06 Noida (Call Girls) Delhi
 
The Omaxe State Dwarka Delhi-broucher.pdf.pdf
The Omaxe State Dwarka Delhi-broucher.pdf.pdfThe Omaxe State Dwarka Delhi-broucher.pdf.pdf
The Omaxe State Dwarka Delhi-broucher.pdf.pdf
 
Purva Palm Hills Devanahalli, Bangalore E- Brochure.pdf
Purva Palm Hills Devanahalli, Bangalore E- Brochure.pdfPurva Palm Hills Devanahalli, Bangalore E- Brochure.pdf
Purva Palm Hills Devanahalli, Bangalore E- Brochure.pdf
 
Call Girls in Mahavir Nagar whatsaap call US +919953056974
Call Girls in Mahavir Nagar  whatsaap call US  +919953056974Call Girls in Mahavir Nagar  whatsaap call US  +919953056974
Call Girls in Mahavir Nagar whatsaap call US +919953056974
 
Low Rate Call Girls in Triveni Complex Delhi Call 9873940964
Low Rate Call Girls in Triveni Complex Delhi Call 9873940964Low Rate Call Girls in Triveni Complex Delhi Call 9873940964
Low Rate Call Girls in Triveni Complex Delhi Call 9873940964
 
8 Key Elements for Comfortable Farmland Living
8 Key Elements for Comfortable Farmland Living 8 Key Elements for Comfortable Farmland Living
8 Key Elements for Comfortable Farmland Living
 
Choose Noida's Leading Architect
Choose    Noida's    Leading   ArchitectChoose    Noida's    Leading   Architect
Choose Noida's Leading Architect
 
young call girls in Lajpat Nagar,🔝 9953056974 🔝 escort Service
young call girls in Lajpat Nagar,🔝 9953056974 🔝 escort Serviceyoung call girls in Lajpat Nagar,🔝 9953056974 🔝 escort Service
young call girls in Lajpat Nagar,🔝 9953056974 🔝 escort Service
 
Call Girls in Model Town Delhi 💯Call Us 🔝8264348440🔝
Call Girls in Model Town Delhi 💯Call Us 🔝8264348440🔝Call Girls in Model Town Delhi 💯Call Us 🔝8264348440🔝
Call Girls in Model Town Delhi 💯Call Us 🔝8264348440🔝
 

San Francisco Market Focus Sept 2017

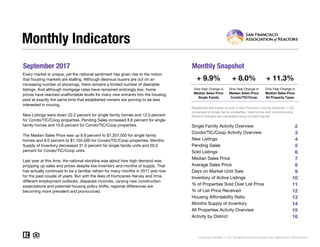
  • 1. September 2017 Monthly Snapshot One-Year Change in One-Year Change in Median Sales Price Single Family Median Sales Price Condo/TIC/Coop 2 3 4 5 6 7 8 9 10 11 12 13 14 15 16 Current as of October 11, 2017. All data from the San Francisco MLS. Report © 2017 ShowingTime. Condo/TIC/Coop Activity Overview Inventory of Active Listings % of Properties Sold Over List Price % of List Price Received Housing Affordability Ratio All Properties Activity Overview New Listings Pending Sales Sold Listings Median Sales Price Average Sales Price Days on Market Until Sale Activity by District Monthly Indicators + 9.9% + 8.0% + 11.3% One-Year Change in Every market is unique, yet the national sentiment has given rise to the notion that housing markets are stalling. Although desirous buyers are out on an increasing number of showings, there remains a limited number of desirable listings. And although mortgage rates have remained enticingly low, home prices have reached unaffordable levels for many new entrants into the housing pool at exactly the same time that established owners are proving to be less interested in moving. New Listings were down 22.2 percent for single family homes and 12.0 percent for Condo/TIC/Coop properties. Pending Sales increased 8.6 percent for single family homes and 10.6 percent for Condo/TIC/Coop properties. The Median Sales Price was up 9.9 percent to $1,337,500 for single family homes and 8.0 percent to $1,104,500 for Condo/TIC/Coop properties. Months Supply of Inventory decreased 31.0 percent for single family units and 20.0 percent for Condo/TIC/Coop units. Last year at this time, the national storyline was about how high demand was propping up sales and prices despite low inventory and months of supply. That has actually continued to be a familiar refrain for many months in 2017 and now for the past couple of years. But with the likes of Hurricanes Harvey and Irma, different employment outlooks, disparate incomes, varying new construction expectations and potential housing policy shifts, regional differences are becoming more prevalent and pronounced. Median Sales Price All Property Types Residential real estate activity in San Francisco County (Districts 1-10), comprised of single-family properties, townhomes and condominiums. Percent changes are calculated using rounded figures. Single Family Activity Overview Months Supply of Inventory
  • 2. Single Family Activity Overview Key metrics by report month and for year-to-date (YTD) starting from the first of the year. Key Metrics Historical Sparkbars 9-2016 9-2017 Percent Change YTD 2016 YTD 2017 Percent Change - 7.1%2,082 1,629 + 2.5% $1,375,000 + 4.2% + 4.7% Pending Sales 186 202 + 8.6% + 2.8%1,663 1,709 New Listings 347 270 - 22.2% 2,242 Sold Listings 178 166 - 6.7% 1,589 Median Sales Price $1,216,875 $1,337,500 + 9.9% $1,320,000 28 - 12.5% $1,740,570 -- -- Days on Market 41 28 - 31.7% 32 Avg. Sales Price $1,487,123 $1,633,856 + 9.9% $1,661,901 Active Listings 532 378 - 28.9% -- % of Properties Sold Over List Price 77.5% 86.1% + 11.1% 76.7% 40 78.3% + 2.1% + 2.4% 38 - 5.0% 115.0%% of List Price Received 110.8% 116.5% + 5.1% 112.3% Current as of October 11, 2017. All data from the San Francisco MLS. Report © 2017 ShowingTime. | 2 Months Supply 2.9 2.0 - 31.0% -- -- -- Affordability Ratio 44 39 - 11.4% 9-2014 9-2015 9-2016 9-2017 9-2014 9-2015 9-2016 9-2017 9-2014 9-2015 9-2016 9-2017 9-2014 9-2015 9-2016 9-2017 9-2014 9-2015 9-2016 9-2017 9-2014 9-2015 9-2016 9-2017 9-2014 9-2015 9-2016 9-2017 9-2014 9-2015 9-2016 9-2017 9-2014 9-2015 9-2016 9-2017 9-2014 9-2015 9-2016 9-2017 9-2014 9-2015 9-2016 9-2017
  • 3. Condo/TIC/Coop Activity Overview Key metrics by report month and for year-to-date (YTD) starting from the first of the year. Key Metrics Historical Sparkbars 9-2016 9-2017 Percent Change YTD 2016 YTD 2017 Percent Change - 8.9% Pending Sales 216 239 + 10.6% 2,097 2,133 + 1.7% New Listings 435 383 - 12.0% 3,160 2,880 Sold Listings 234 172 - 26.5% 2,058 2,044 - 0.7% Median Sales Price $1,022,500 $1,104,500 + 8.0% $1,090,830 $1,126,500 + 3.3% + 4.1% 37 - 2.6% $1,291,174 -- -- Days on Market 40 43 + 7.5% 38 Avg. Sales Price $1,208,673 $1,233,279 + 2.0% $1,239,969 Active Listings 825 666 - 19.3% -- % of Properties Sold Over List Price 58.1% 54.1% - 6.9% 59.8% 57 58.9% - 1.5% 0.0% 54 - 5.3% 105.0%% of List Price Received 104.2% 104.9% + 0.7% 105.0% Current as of October 11, 2017. All data from the San Francisco MLS. Report © 2017 ShowingTime. | 3 Months Supply 3.5 2.8 - 20.0% -- -- -- Affordability Ratio 61 55 - 9.8% 9-2014 9-2015 9-2016 9-2017 9-2014 9-2015 9-2016 9-2017 9-2014 9-2015 9-2016 9-2017 9-2014 9-2015 9-2016 9-2017 9-2014 9-2015 9-2016 9-2017 9-2014 9-2015 9-2016 9-2017 9-2014 9-2015 9-2016 9-2017 9-2014 9-2015 9-2016 9-2017 9-2014 9-2015 9-2016 9-2017 9-2014 9-2015 9-2016 9-2017 9-2014 9-2015 9-2016 9-2017
  • 4. New Listings New Listings Single Family Year-Over-Year Change Condo/TIC/ Coop Year-Over-Year Change Oct-2016 222 -15.6% 300 -6.8% Nov-2016 138 -3.5% 159 -18.5% Dec-2016 70 +4.5% 119 -1.7% Jan-2017 176 -3.8% 328 +11.6% Feb-2017 187 -18.0% 329 -2.7% Mar-2017 276 +1.1% 347 -8.0% Apr-2017 247 -12.7% 285 -23.4% May-2017 288 +12.5% 359 -4.0% Jun-2017 236 -0.8% 311 -23.8% Jul-2017 204 -12.1% 269 -2.9% Aug-2017 198 -2.0% 269 -5.6% Sep-2017 270 -22.2% 383 -12.0% 12-Month Avg 209 -7.5% 288 -9.0% Historical New Listings by Month Current as of October 11, 2017. All data from the San Francisco MLS. Report © 2017 ShowingTime. | 4 A count of the properties that have been newly listed on the market in a given month. 325 438 347 435 270 383 Single Family Condo/TIC/Coop September 0 100 200 300 400 500 600 700 1-2005 1-2006 1-2007 1-2008 1-2009 1-2010 1-2011 1-2012 1-2013 1-2014 1-2015 1-2016 1-2017 Single Family Condo/TIC/Coop 2,267 2,916 2,242 3,160 2,082 2,880 Single Family Condo/TIC/Coop Year to Date 2015 2016 2017 - 12.0%- 0.7%- 22.2%+ 6.8% + 8.4%- 7.1%- 1.1% - 8.9% 2015 2016 2017 2015 2016 2017 2015 2016 2017 - 7.1% - 0.1% - 4.1%+ 12.6%
  • 5. Pending Sales Pending Sales Single Family Year-Over-Year Change Condo/TIC/ Coop Year-Over-Year Change Oct-2016 222 -16.5% 249 -12.0% Nov-2016 209 +19.4% 264 +11.4% Dec-2016 123 -6.1% 178 +1.7% Jan-2017 93 -6.1% 144 +0.7% Feb-2017 135 +8.9% 208 -8.4% Mar-2017 212 +8.7% 303 +34.1% Apr-2017 198 -7.5% 226 -7.4% May-2017 240 -3.6% 306 +7.4% Jun-2017 249 +8.7% 290 +10.7% Jul-2017 175 +3.6% 210 -18.6% Aug-2017 205 +3.5% 207 -12.3% Sep-2017 202 +8.6% 239 +10.6% 12-Month Avg 189 +1.3% 235 +1.1% Historical Pending Sales by Month Current as of October 11, 2017. All data from the San Francisco MLS. Report © 2017 ShowingTime. | 5 A count of the properties on which offers have been accepted in a given month. 199 216 186 216 202 239 Single Family Condo/TIC/Coop September 0 100 200 300 400 1-2005 1-2006 1-2007 1-2008 1-2009 1-2010 1-2011 1-2012 1-2013 1-2014 1-2015 1-2016 1-2017 Single Family Condo/TIC/Coop 1,747 2,213 1,663 2,097 1,709 2,133 Single Family Condo/TIC/Coop Year to Date 2015 2016 2017 + 10.6%0.0%+ 8.6%- 6.5% - 5.2%+ 2.8%- 4.8% + 1.7% 2015 2016 2017 2015 2016 2017 2015 2016 2017 - 6.6% - 1.8% - 9.0%- 19.4%
  • 6. Sold Listings Sold Listings Single Family Year-Over-Year Change Condo/TIC/ Coop Year-Over-Year Change Oct-2016 227 -7.0% 236 -11.3% Nov-2016 206 +9.6% 263 +26.4% Dec-2016 200 -3.8% 238 -15.9% Jan-2017 106 +1.9% 150 +0.7% Feb-2017 111 +8.8% 156 -7.1% Mar-2017 173 +9.5% 286 +13.9% Apr-2017 203 -2.9% 232 +4.5% May-2017 218 +9.0% 271 +5.0% Jun-2017 230 -6.1% 324 +20.9% Jul-2017 211 +4.5% 239 -4.0% Aug-2017 211 +10.5% 214 -17.4% Sep-2017 166 -6.7% 172 -26.5% 12-Month Avg 189 +1.5% 232 -1.2% Historical Sold Listings by Month Current as of October 11, 2017. All data from the San Francisco MLS. Report © 2017 ShowingTime. | 6 A count of the actual sales that closed in a given month. 164 181178 234 166 172 Single Family Condo/TIC/Coop September 0 100 200 300 400 1-2005 1-2006 1-2007 1-2008 1-2009 1-2010 1-2011 1-2012 1-2013 1-2014 1-2015 1-2016 1-2017 Single Family Condo/TIC/Coop 1,669 2,130 1,589 2,058 1,629 2,044 Single Family Condo/TIC/Coop Year to Date 2015 2016 2017 - 26.5%+ 29.3%- 6.7%+ 8.5% - 3.4%+ 2.5%- 4.8% - 0.7% 2015 2016 2017 2015 2016 2017 2015 2016 2017 - 16.8% - 3.6% - 10.8%- 27.0%
  • 7. Median Sales Price Median Sales Price Single Family Year-Over-Year Change Condo/TIC/ Coop Year-Over-Year Change Oct-2016 $1,400,000 +10.5% $1,137,500 +3.4% Nov-2016 $1,353,000 +7.2% $1,058,000 -6.0% Dec-2016 $1,301,511 +8.3% $1,011,000 -7.9% Jan-2017 $1,250,000 +7.1% $1,000,000 -5.7% Feb-2017 $1,290,000 -7.2% $1,192,500 +8.7% Mar-2017 $1,350,000 -0.2% $1,137,500 +3.9% Apr-2017 $1,380,000 0.0% $1,100,000 -4.3% May-2017 $1,475,000 +9.3% $1,163,088 +7.4% Jun-2017 $1,461,000 +10.3% $1,125,000 -4.3% Jul-2017 $1,400,000 +7.3% $1,150,000 +10.0% Aug-2017 $1,375,000 +10.0% $1,175,000 +10.8% Sep-2017 $1,337,500 +9.9% $1,104,500 +8.0% 12-Month Avg* $1,370,000 +5.4% $1,108,000 +0.7% Historical Median Sales Price by Month * Median Sales Price for all properties from October 2016 through September 2017. This is not the average of the individual figures above. Current as of October 11, 2017. All data from the San Francisco MLS. Report © 2017 ShowingTime. | 7 Point at which half of the sales sold for more and half sold for less, not accounting for seller concessions, in a given month. $1,155,000 $1,040,000 $1,216,875 $1,022,500 $1,337,500 $1,104,500 Single Family Condo/TIC/Coop September $400,000 $600,000 $800,000 $1,000,000 $1,200,000 $1,400,000 $1,600,000 1-2005 1-2006 1-2007 1-2008 1-2009 1-2010 1-2011 1-2012 1-2013 1-2014 1-2015 1-2016 1-2017 Single Family Condo/TIC/Coop $1,250,000 $1,072,500 $1,320,000 $1,090,830 $1,375,000 $1,126,500 Single Family Condo/TIC/Coop Year to Date 2015 2016 2017 + 8.0%- 1.7%+ 9.9%+ 5.4% + 1.7%+ 4.2%+ 5.6% + 3.3% 2015 2016 2017 2015 2016 2017 2015 2016 2017 + 11.6% + 19.0% + 15.3%+ 13.7%
  • 8. Average Sales Price Avg. Sales Price Single Family Year-Over-Year Change Condo/TIC/ Coop Year-Over-Year Change Oct-2016 $2,000,319 +23.1% $1,263,882 +6.7% Nov-2016 $1,767,029 +3.9% $1,140,559 -9.1% Dec-2016 $1,658,512 +10.8% $1,249,670 -0.0% Jan-2017 $1,633,150 +4.0% $1,161,831 -0.6% Feb-2017 $1,684,181 +4.5% $1,367,391 +13.1% Mar-2017 $1,891,127 +6.0% $1,283,105 +2.2% Apr-2017 $1,880,160 +6.3% $1,296,502 -5.2% May-2017 $1,835,738 +12.4% $1,344,317 +5.9% Jun-2017 $1,727,201 -1.4% $1,351,503 +10.9% Jul-2017 $1,746,884 +1.5% $1,242,918 +3.1% Aug-2017 $1,560,350 +1.5% $1,273,066 +3.6% Sep-2017 $1,633,856 +9.9% $1,233,279 +2.0% 12-Month Avg* $1,761,791 +7.1% $1,271,062 +2.8% Historical Average Sales Price by Month * Avg. Sales Price for all properties from October 2016 through September 2017. This is not the average of the individual figures above. Current as of October 11, 2017. All data from the San Francisco MLS. Report © 2017 ShowingTime. | 8 Average sales price for all closed sales, not accounting for seller concessions, in a given month. $1,390,736 $1,166,494 $1,487,123 $1,208,673 $1,633,856 $1,233,279 Single Family Condo/TIC/Coop September $500,000 $750,000 $1,000,000 $1,250,000 $1,500,000 $1,750,000 $2,000,000 $2,250,000 1-2005 1-2006 1-2007 1-2008 1-2009 1-2010 1-2011 1-2012 1-2013 1-2014 1-2015 1-2016 1-2017 Single Family Condo/TIC/Coop $1,642,053 $1,246,391 $1,661,901 $1,239,969 $1,740,570 $1,291,174 Single Family Condo/TIC/Coop Year to Date 2015 2016 2017 + 2.0%+ 3.6%+ 9.9%+ 6.9% - 0.5%+ 4.7%+ 1.2% + 4.1% 2015 2016 2017 2015 2016 2017 2015 2016 2017 + 5.6% + 15.8% + 14.0%+ 14.9%
  • 9. Days on Market Until Sale Days on Market Single Family Year-Over-Year Change Condo/TIC/ Coop Year-Over-Year Change Oct-2016 27 0.0% 34 +30.8% Nov-2016 38 +35.7% 40 +17.6% Dec-2016 41 +24.2% 48 +11.6% Jan-2017 42 +5.0% 59 +34.1% Feb-2017 34 +9.7% 36 +2.9% Mar-2017 31 +24.0% 32 +6.7% Apr-2017 26 -18.8% 32 -15.8% May-2017 24 -7.7% 33 0.0% Jun-2017 27 -6.9% 37 +5.7% Jul-2017 25 -21.9% 33 -15.4% Aug-2017 27 -18.2% 41 -10.9% Sep-2017 28 -31.7% 43 +7.5% 12-Month Avg* 30 -3.0% 38 +3.8% Historical Days on Market Until Sale by Month * Days on Market for all properties from October 2016 through September 2017. This is not the average of the individual figures above. Current as of October 11, 2017. All data from the San Francisco MLS. Report © 2017 ShowingTime. | 9 Average number of days between when a property is listed and when an offer is accepted in a given month. 27 34 41 40 28 43 Single Family Condo/TIC/Coop September 20 40 60 80 100 120 1-2005 1-2006 1-2007 1-2008 1-2009 1-2010 1-2011 1-2012 1-2013 1-2014 1-2015 1-2016 1-2017 Single Family Condo/TIC/Coop 27 30 32 38 28 37 Single Family Condo/TIC/Coop Year to Date 2015 2016 2017 + 7.5%+ 17.6%- 31.7%+ 51.9% + 26.7%- 12.5%+ 18.5% - 2.6% 2015 2016 2017 2015 2016 2017 2015 2016 2017 + 3.8% - 10.0% - 11.8%- 8.1%
  • 10. Inventory of Active Listings Active Listings Single Family Year-Over-Year Change Condo/TIC/ Coop Year-Over-Year Change Oct-2016 491 +11.3% 800 +22.0% Nov-2016 384 +5.8% 591 +8.8% Dec-2016 261 +13.5% 405 +7.7% Jan-2017 323 +7.7% 555 +12.1% Feb-2017 359 -7.5% 629 +13.1% Mar-2017 393 -12.5% 631 -3.8% Apr-2017 421 -13.6% 644 -11.2% May-2017 436 -6.8% 658 -11.9% Jun-2017 390 -12.0% 609 -24.3% Jul-2017 386 -16.8% 592 -17.9% Aug-2017 348 -16.5% 573 -16.1% Sep-2017 378 -28.9% 666 -19.3% 12-Month Avg* 381 -8.3% 613 -5.6% Historical Inventory of Active Listings by Month * Active Listings for all properties from October 2016 through September 2017. This is not the average of the individual figures above. Current as of October 11, 2017. All data from the San Francisco MLS. Report © 2017 ShowingTime. | 10 The number of properties available for sale in active status at the end of a given month. 479 676 532 825 378 666 Single Family Condo/TIC/Coop September 200 400 600 800 1,000 1,200 1,400 1,600 1-2005 1-2006 1-2007 1-2008 1-2009 1-2010 1-2011 1-2012 1-2013 1-2014 1-2015 1-2016 1-2017 Single Family Condo/TIC/Coop 2015 2016 2017 - 19.3%+ 22.0%- 28.9%+ 11.1% 2015 2016 2017 - 3.2% + 15.6%
  • 11. % of Properties Sold Over List Price % of Properties Sold Over List Price Single Family Year-Over-Year Change Condo/TIC/ Coop Year-Over-Year Change Oct-2016 78.9% -5.2% 53.8% -29.5% Nov-2016 72.8% -6.3% 63.1% -8.8% Dec-2016 69.0% -13.0% 42.0% -29.3% Jan-2017 62.3% -18.0% 38.7% -27.0% Feb-2017 78.4% +1.2% 58.3% 0.0% Mar-2017 74.6% -9.4% 62.2% -8.1% Apr-2017 77.3% +2.2% 62.1% +2.8% May-2017 78.9% -0.8% 61.3% -9.1% Jun-2017 80.0% +11.4% 58.6% -6.5% Jul-2017 81.0% +6.3% 62.8% +7.2% Aug-2017 79.1% +4.2% 62.1% +27.8% Sep-2017 86.1% +11.1% 54.1% -6.9% 12-Month Avg 77.1% -0.8% 57.4% -7.5% Historical % of Properties Sold Over List Price by Month * % of Properties Sold Over List Price for all properties from October 2016 through September 2017. This is not the average of the individual figures above. Current as of October 11, 2017. All data from the San Francisco MLS. Report © 2017 ShowingTime. | 11 Percentage found when dividing the number of properties sold by properties sold over its original list price, not accounting for seller concessions. 88.4% 71.8% 77.5% 58.1% 86.1% 54.1% Single Family Condo/TIC/Coop September 0.0% 20.0% 40.0% 60.0% 80.0% 100.0% 1-2005 1-2006 1-2007 1-2008 1-2009 1-2010 1-2011 1-2012 1-2013 1-2014 1-2015 1-2016 1-2017 Single Family Condo/TIC/Coop 83.0% 71.2% 76.7% 59.8% 78.3% 58.9% Single Family Condo/TIC/Coop Year to Date 2015 2016 2017 - 6.9%- 19.1%+ 11.1%- 12.3% - 16.0%+ 2.1%- 7.6% - 1.5% 2015 2016 2017 2015 2016 2017 2015 2016 2017 + 14.5% + 3.2% + 3.8%+ 8.0%
  • 12. % of List Price Received % of List Price Received Single Family Year-Over-Year Change Condo/TIC/ Coop Year-Over-Year Change Oct-2016 111.2% -2.9% 104.2% -4.7% Nov-2016 109.1% -2.9% 104.6% -2.7% Dec-2016 108.4% -3.5% 101.5% -2.7% Jan-2017 107.6% -3.1% 101.4% -2.3% Feb-2017 113.8% +1.1% 104.1% -1.7% Mar-2017 112.4% -2.0% 105.0% -1.2% Apr-2017 115.4% +1.9% 105.1% -0.1% May-2017 115.3% +0.1% 105.4% -0.7% Jun-2017 116.8% +5.9% 105.8% +0.5% Jul-2017 117.0% +4.7% 106.0% +1.1% Aug-2017 115.6% +3.7% 105.9% +2.9% Sep-2017 116.5% +5.1% 104.9% +0.7% 12-Month Avg* 113.5% +0.8% 104.6% -0.8% Historical % of List Price Received by Month * % of List Price Received for all properties from October 2016 through September 2017. This is not the average of the individual figures above. Current as of October 11, 2017. All data from the San Francisco MLS. Report © 2017 ShowingTime. | 12 Percentage found when dividing a property’s sales price by its most recent list price, then taking the average for all properties sold in a given month, not accounting for seller concessions. 117.7% 108.7%110.8% 104.2% 116.5% 104.9% Single Family Condo/TIC/Coop September 116.2% 109.3%112.3% 105.0% 115.0% 105.0% Single Family Condo/TIC/Coop Year to Date 95.0% 100.0% 105.0% 110.0% 115.0% 120.0% 1-2005 1-2006 1-2007 1-2008 1-2009 1-2010 1-2011 1-2012 1-2013 1-2014 1-2015 1-2016 1-2017 Single Family Condo/TIC/Coop 2015 2016 2017 + 0.7%- 4.1%+ 5.1%- 5.9% 2015 2016 2017 + 5.5% + 3.3% 2015 2016 2017 0.0%- 3.9%+ 2.4%- 3.4% 2015 2016 2017 + 3.1% + 2.0%
  • 13. Housing Affordability Ratio Affordability Ratio Single Family Year-Over-Year Change Condo/TIC/ Coop Year-Over-Year Change Oct-2016 39 +2.6% 56 +9.8% Nov-2016 38 0.0% 56 +12.0% Dec-2016 38 -5.0% 56 +9.8% Jan-2017 39 -11.4% 56 0.0% Feb-2017 39 +2.6% 49 -12.5% Mar-2017 37 -5.1% 51 -8.9% Apr-2017 37 -2.6% 54 +1.9% May-2017 35 -10.3% 52 -7.1% Jun-2017 35 -12.5% 53 0.0% Jul-2017 37 -9.8% 52 -11.9% Aug-2017 38 -11.6% 52 -11.9% Sep-2017 39 -11.4% 55 -9.8% 12-Month Avg* 38 -2.8% 40 -0.3% Historical Housing Affordability Ratio by Month * Affordability Ratio for all properties from October 2016 through September 2017. This is not the average of the individual figures above. Current as of October 11, 2017. All data from the San Francisco MLS. Report © 2017 ShowingTime. | 13 This index measures housing affordability for the region. For example, an index of 120 means the median household income is 120% of what is necessary to qualify for the median-priced home under prevailing interest rates. A higher number means greater affordability. 42 54 44 61 39 55 Single Family Condo/TIC/Coop September 30 40 50 60 70 80 90 100 1-2005 1-2006 1-2007 1-2008 1-2009 1-2010 1-2011 1-2012 1-2013 1-2014 1-2015 1-2016 1-2017 Single Family Condo/TIC/Coop 2015 2016 2017 - 9.8%+ 13.0%- 11.4%+ 4.8% 2015 2016 2017 - 4.5% - 5.3% 39 53 40 57 38 54 Single Family Condo/TIC/Coop Year to Date 2015 2016 2017 - 5.3%+ 7.5%- 5.0%+ 2.6% 2015 2016 2017 - 9.3% - 5.4%
  • 14. Months Supply of Inventory Months Supply Single Family Year-Over-Year Change Condo/TIC/ Coop Year-Over-Year Change Oct-2016 2.7 +22.7% 3.5 +29.6% Nov-2016 2.1 +10.5% 2.5 +13.6% Dec-2016 1.4 +16.7% 1.7 +6.3% Jan-2017 1.8 +12.5% 2.4 +20.0% Feb-2017 1.9 -5.0% 2.7 +17.4% Mar-2017 2.1 -12.5% 2.7 -3.6% Apr-2017 2.3 -11.5% 2.7 -12.9% May-2017 2.4 -4.0% 2.8 -12.5% Jun-2017 2.1 -8.7% 2.5 -28.6% Jul-2017 2.1 -16.0% 2.5 -19.4% Aug-2017 1.9 -13.6% 2.5 -13.8% Sep-2017 2.0 -31.0% 2.8 -20.0% 12-Month Avg* 2.1 -6.0% 2.6 -4.6% Historical Months Supply of Inventory by Month * Months Supply for all properties from October 2016 through September 2017. This is not the average of the individual figures above. Current as of October 11, 2017. All data from the San Francisco MLS. Report © 2017 ShowingTime. | 14 The inventory of homes for sale at the end of a given month, divided by the average monthly pending sales from the last 12 months. 2.4 2.82.9 3.5 2.0 2.8 Single Family Condo/TIC/Coop September 0.0 2.0 4.0 6.0 8.0 10.0 1-2005 1-2006 1-2007 1-2008 1-2009 1-2010 1-2011 1-2012 1-2013 1-2014 1-2015 1-2016 1-2017 Single Family Condo/TIC/Coop 2015 2016 2017 - 20.0%+ 25.0%- 31.0%+ 20.8% 2015 2016 2017 - 4.0% + 27.3%
  • 15. All Properties Activity Overview Key metrics by report month and for year-to-date (YTD) starting from the first of the year. Key Metrics Historical Sparkbars 9-2016 9-2017 Percent Change YTD 2016 YTD 2017 Percent Change - 8.1% Pending Sales 402 441 + 9.7% 3,760 3,842 + 2.2% New Listings 782 653 - 16.5% 5,402 4,962 Sold Listings 412 338 - 18.0% 3,647 3,673 + 0.7% Median Sales Price $1,123,000 $1,250,000 + 11.3% $1,185,000 $1,250,000 + 5.5% + 4.7% 33 - 5.7% $1,490,484 -- -- Days on Market 40 36 - 10.0% 35 Avg. Sales Price $1,328,974 $1,430,012 + 7.6% $1,423,805 Active Listings 1,357 1,044 - 23.1% -- % of Properties Sold Over List Price 66.5% 69.8% + 5.0% 67.2% 44 67.5% + 0.4% + 1.2% 41 - 6.8% 109.5%% of List Price Received 107.1% 110.6% + 3.3% 108.2% Current as of October 11, 2017. All data from the San Francisco MLS. Report © 2017 ShowingTime. | 15 Months Supply 3.2 2.5 - 21.9% -- -- -- Affordability Ratio 47 43 - 8.5% 9-2014 9-2015 9-2016 9-2017 9-2014 9-2015 9-2016 9-2017 9-2014 9-2015 9-2016 9-2017 9-2014 9-2015 9-2016 9-2017 9-2014 9-2015 9-2016 9-2017 9-2014 9-2015 9-2016 9-2017 9-2014 9-2015 9-2016 9-2017 9-2014 9-2015 9-2016 9-2017 9-2014 9-2015 9-2016 9-2017 9-2014 9-2015 9-2016 9-2017 9-2014 9-2015 9-2016 9-2017
  • 16. Activity by District SF District 1: Northwest (Sea Cliff, Lake, Jordan Park / Laurel Heights, Outer Richmond, Central Richmond, Inner Richmond, Lone Mountain) SF District 2: Central West (Outer Sunset, Central Sunset, Inner Sunset, Outer Parkside, Parkside, Inner Parkside, Golden Gate Heights) SF District 3: Southwest (Pine Lake Park, Lake Shore, Merced Manor, Stonestown, Lakeside, Merced Heights, Ingleside, Ingleside Heights, Oceanview) SF District 4: Twin Peaks W (Forest Hill (& Ext), W Portal, St Francis Wd, Balboa Terr, Mt Dav Manor, Ingleside Terr, Monterey Hts, Wstwd Pk & H'lnds, Shrwd Fst, Miraloma Pk, Dmnd Hts, Mdtwn Terr) SF District 5: Central (Haight Ashbury, Cole Vly / Prnssus Hts, Clarndn Hts, Corona Hts, Twin Pks, Glen Pk, Noe Vly, Eureka Vly / Dolores Hts, Mission Dolores, Duboce Trngl, Buena Vista / Ashbury Hts) SF District 6: Central North (Lower Pacific Heights, Anza Vista, Western Addition, North Panhandle, Alamo Square, Hayes Valley) SF District 7: North (Marina, Cow Hollow, Presidio Heights, Pacific Heights) SF District 8: Northeast (North Waterfront, North Beach, Russian Hill, Telegraph Hill, Nob Hill, Financial District / Barbary Coast, Downtown, Van Ness / Civic Center, Tenderloin) SF District 9: Central East (Yerba Buena, South Beach, South of Market, Mission Bay, Inner Mission, Potrero Hill, Central Waterfront / Dogpatch, Bernal Heights) SF District 10: Southeast (Outer Mission, Mission Terr, Excelsior, Portola, Bayview, Silver Terr, Hunters Pt, Candlestick Pt, Bayview Hts, Little Hollywood, Visitation Vly, Crocker Amazon) 9-2016 9-2017 + / – 9-2016 9-2017 + / – 9-2016 9-2017 + / – 9-2016 9-2017 + / – 9-2016 9-2017 + / – Single Family 1 SF District 1 42 29 -31.0% 13 8 -38.5% $1,820,000 $2,412,500 +32.6% 46 9 -80.4% 3.0 2.1 -30.0% 2 SF District 2 72 39 -45.8% 31 38 +22.6% $1,220,000 $1,396,500 +14.5% 31 23 -25.8% 2.2 1.1 -50.0% 3 SF District 3 42 20 -52.4% 13 16 +23.1% $820,000 $1,115,000 +36.0% 30 19 -36.7% 2.5 1.4 -44.0% 4 SF District 4 61 40 -34.4% 29 21 -27.6% $1,489,000 $1,400,000 -6.0% 51 12 -76.5% 2.2 1.6 -27.3% 5 SF District 5 86 66 -23.3% 20 16 -20.0% $2,010,035 $1,802,500 -10.3% 26 28 +7.7% 3.4 2.5 -26.5% 6 SF District 6 13 12 -7.7% 2 1 -50.0% $2,585,000 $2,950,000 +14.1% 28 28 0.0% 4.2 4.0 -4.8% 7 SF District 7 40 36 -10.0% 5 5 0.0% $4,600,000 $3,500,000 -23.9% 17 85 +400.0% 4.7 4.5 -4.3% 8 SF District 8 15 13 -13.3% 0 3 -- $0 $3,535,000 -- 0 50 -- 7.0 5.1 -27.1% 9 SF District 9 57 46 -19.3% 23 16 -30.4% $1,350,000 $1,475,000 +9.3% 63 36 -42.9% 2.7 2.1 -22.2% 10 SF District 10 104 77 -26.0% 42 42 0.0% $826,500 $870,500 +5.3% 41 35 -14.6% 2.9 1.9 -34.5% Condo/TIC/Coop 1 SF District 1 31 29 -6.5% 10 3 -70.0% $1,279,000 $1,400,000 +9.5% 46 15 -67.4% 2.4 3.2 +33.3% 2 SF District 2 15 6 -60.0% 7 4 -42.9% $1,055,000 $857,500 -18.7% 60 44 -26.7% 3.3 1.9 -42.4% 3 SF District 3 10 6 -40.0% 5 0 -100.0% $1,093,003 $0 -100.0% 32 0 -100.0% 2.6 1.9 -26.9% 4 SF District 4 9 9 0.0% 2 5 +150.0% $777,500 $875,000 +12.5% 73 15 -79.5% 3.5 3.0 -14.3% 5 SF District 5 101 80 -20.8% 30 17 -43.3% $1,287,500 $1,435,000 +11.5% 32 35 +9.4% 3.0 2.3 -23.3% 6 SF District 6 105 70 -33.3% 29 22 -24.1% $940,000 $1,362,500 +44.9% 28 31 +10.7% 4.0 2.7 -32.5% 7 SF District 7 73 44 -39.7% 23 14 -39.1% $1,250,000 $1,360,000 +8.8% 39 27 -30.8% 3.2 1.6 -50.0% 8 SF District 8 139 129 -7.2% 40 30 -25.0% $1,012,500 $1,122,500 +10.9% 34 68 +100.0% 3.6 3.3 -8.3% 9 SF District 9 315 266 -15.6% 78 71 -9.0% $944,500 $1,065,000 +12.8% 46 40 -13.0% 3.8 3.2 -15.8% 10 SF District 10 27 27 0.0% 10 6 -40.0% $590,000 $782,500 +32.6% 51 95 +86.3% 4.3 3.9 -9.3% Key metrics by report month for the districts of San Fransisco. Current as of October 11, 2017. All data from the San Francisco MLS. Report © 2017 ShowingTime. | 16 Active Listings Sold Listings Median Sales Price Days on Market Months Supply