San Francisco December 2023 Market Report
•
0 likes•4 views

San Francisco December 2023 Market Report

Recommended
Recommended
More Related Content
Similar to San Francisco December 2023 Market Report
Similar to San Francisco December 2023 Market Report (20)
Recently uploaded
Recently uploaded (20)
San Francisco December 2023 Market Report
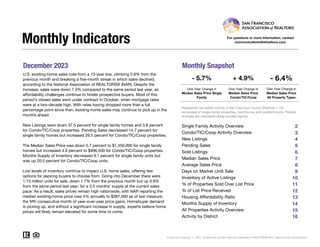
- 1. December 2023 Monthly Snapshot One-Year Change in One-Year Change in Median Sales Price Single Family Median Sales Price Condo/TIC/Coop 2 3 4 5 6 7 8 9 10 11 12 13 14 15 16 Monthly Indicators - 5.7% + 4.9% - 6.4% One-Year Change in U.S. existing-home sales rose from a 13-year low, climbing 0.8% from the previous month and breaking a five-month streak in which sales declined, according to the National Association of REALTORS® (NAR). Despite the increase, sales were down 7.3% compared to the same period last year, as affordability challenges continue to hinder prospective buyers. Most of this period’s closed sales went under contract in October, when mortgage rates were at a two-decade high. With rates having dropped more than a full percentage point since then, existing-home sales may continue to pick up in the months ahead. New Listings were down 37.5 percent for single family homes and 3.8 percent for Condo/TIC/Coop properties. Pending Sales decreased 14.7 percent for single family homes but increased 29.5 percent for Condo/TIC/Coop properties. The Median Sales Price was down 5.7 percent to $1,450,000 for single family homes but increased 4.9 percent to $996,500 for Condo/TIC/Coop properties. Months Supply of Inventory decreased 9.1 percent for single family units but was up 20.0 percent for Condo/TIC/Coop units. Low levels of inventory continue to impact U.S. home sales, offering few options for aspiring buyers to choose from. Going into December there were 1.13 million units for sale, down 1.7% from the previous month but up 0.9% from the same period last year, for a 3.5 months’ supply at the current sales pace. As a result, sales prices remain high nationwide, with NAR reporting the median existing-home price rose 4% annually to $387,600 as of last measure, the fifth consecutive month of year-over-year price gains. Homebuyer demand is picking up, and without a significant increase in supply, experts believe home prices will likely remain elevated for some time to come. Median Sales Price All Property Types Residential real estate activity in San Francisco County (Districts 1-10) composed of single-family properties, townhomes and condominiums. Percent changes are calculated using rounded figures. Single Family Activity Overview Months Supply of Inventory For questions or more information, contact communications@sfrealtors.com. Current as of January 11, 2024. All data from the San Francisco Association of REALTORS® MLS. Report © 2024 ShowingTime. Condo/TIC/Coop Activity Overview Inventory of Active Listings % of Properties Sold Over List Price % of List Price Received Housing Affordability Ratio All Properties Activity Overview New Listings Pending Sales Sold Listings Median Sales Price Average Sales Price Days on Market Until Sale Activity by District
- 2. Single Family Activity Overview Key metrics by report month and for year-to-date (YTD) starting from the first of the year. Key Metrics Historical Sparkbars 12-2022 12-2023 Percent Change YTD 2022 YTD 2023 Percent Change Current as of January 11, 2024. All data from the San Francisco Association of REALTORS® MLS. Report © 2024 ShowingTime. | 2 Months Supply 1.1 1.0 - 9.1% -- -- -- Affordability Ratio 27 28 + 3.7% % of List Price Received 102.9% 104.1% + 1.2% 114.4% 23 62.7% - 18.4% - 6.5% 26 + 13.0% 107.0% % of Properties Sold Over List Price 48.7% 54.6% + 12.1% 76.8% Active Listings 216 151 - 30.1% -- Avg. Sales Price $1,870,417 $1,983,028 + 6.0% $2,213,486 Days on Market 38 40 + 5.3% 24 31 + 29.2% $2,072,733 -- -- Median Sales Price $1,537,500 $1,450,000 - 5.7% $1,780,000 Sold Listings 154 119 - 22.7% 2,418 New Listings 72 45 - 37.5% 3,121 Pending Sales 116 99 - 14.7% - 21.0% 2,389 1,888 - 19.2% 2,521 1,887 - 22.0% $1,550,000 - 12.9% - 6.4% 12-2020 12-2021 12-2022 12-2023 12-2020 12-2021 12-2022 12-2023 12-2020 12-2021 12-2022 12-2023 12-2020 12-2021 12-2022 12-2023 12-2020 12-2021 12-2022 12-2023 12-2020 12-2021 12-2022 12-2023 12-2020 12-2021 12-2022 12-2023 12-2020 12-2021 12-2022 12-2023 12-2020 12-2021 12-2022 12-2023 12-2020 12-2021 12-2022 12-2023 12-2020 12-2021 12-2022 12-2023
- 3. Condo/TIC/Coop Activity Overview Key metrics by report month and for year-to-date (YTD) starting from the first of the year. Key Metrics Historical Sparkbars 12-2022 12-2023 Percent Change YTD 2022 YTD 2023 Percent Change Current as of January 11, 2024. All data from the San Francisco Association of REALTORS® MLS. Report © 2024 ShowingTime. | 3 Months Supply 2.0 2.4 + 20.0% -- -- -- Affordability Ratio 49 46 - 6.1% % of List Price Received 98.1% 99.0% + 0.9% 103.5% 39 32.5% - 31.0% - 3.7% 41 + 5.1% 99.7% % of Properties Sold Over List Price 15.6% 22.2% + 42.3% 47.1% Active Listings 522 441 - 15.5% -- Avg. Sales Price $1,098,424 $1,169,699 + 6.5% $1,373,270 Days on Market 74 72 - 2.7% 44 $1,100,000 - 8.3% - 8.7% 57 + 29.5% $1,254,267 -- -- Sold Listings 147 162 + 10.2% 3,149 2,151 - 31.7% Median Sales Price $950,000 $996,500 + 4.9% $1,200,000 - 28.1% Pending Sales 122 158 + 29.5% 3,080 2,176 - 29.4% New Listings 78 75 - 3.8% 5,006 3,597 12-2020 12-2021 12-2022 12-2023 12-2020 12-2021 12-2022 12-2023 12-2020 12-2021 12-2022 12-2023 12-2020 12-2021 12-2022 12-2023 12-2020 12-2021 12-2022 12-2023 12-2020 12-2021 12-2022 12-2023 12-2020 12-2021 12-2022 12-2023 12-2020 12-2021 12-2022 12-2023 12-2020 12-2021 12-2022 12-2023 12-2020 12-2021 12-2022 12-2023 12-2020 12-2021 12-2022 12-2023
- 4. New Listings New Listings Single Family Year-Over-Year Change Condo/TIC/ Coop Year-Over-Year Change Jan-2023 168 -26.3% 342 -27.5% Feb-2023 173 -39.9% 313 -41.5% Mar-2023 242 -29.2% 362 -41.1% Apr-2023 237 -28.0% 327 -39.7% May-2023 277 -8.0% 321 -37.8% Jun-2023 217 -31.8% 314 -30.4% Jul-2023 189 -21.9% 243 -36.6% Aug-2023 253 +5.9% 289 -6.5% Sep-2023 373 +1.6% 551 -4.0% Oct-2023 246 +1.7% 308 -18.5% Nov-2023 101 -34.0% 152 -0.7% Dec-2023 45 -37.5% 75 -3.8% 12-Month Avg 210 -19.2% 300 -28.1% Historical New Listings by Month Current as of January 11, 2024. All data from the San Francisco Association of REALTORS® MLS. Report © 2024 ShowingTime. | 4 A count of the properties that have been newly listed on the market in a given month. 83 147 72 78 45 75 Single Family Condo/TIC/Coop December 0 200 400 600 800 1-2005 1-2006 1-2007 1-2008 1-2009 1-2010 1-2011 1-2012 1-2013 1-2014 1-2015 1-2016 1-2017 1-2018 1-2019 1-2020 1-2021 1-2022 1-2023 Single Family Condo/TIC/Coop 3,459 5,641 3,121 5,006 2,521 3,597 Single Family Condo/TIC/Coop Year to Date 2021 2022 2023 - 3.8% - 46.9% - 37.5% - 13.3% - 11.3% - 19.2% - 9.8% - 28.1% 2021 2022 2023 2021 2022 2023 2021 2022 2023 - 33.1% + 4.0% + 7.3% - 7.5%
- 5. Pending Sales Pending Sales Single Family Year-Over-Year Change Condo/TIC/ Coop Year-Over-Year Change Jan-2023 87 -40.0% 123 -51.0% Feb-2023 126 -41.1% 175 -39.0% Mar-2023 168 -41.5% 244 -44.2% Apr-2023 185 -31.2% 233 -32.1% May-2023 209 -16.1% 211 -36.4% Jun-2023 193 -2.0% 195 -25.0% Jul-2023 131 -27.6% 157 -29.3% Aug-2023 149 -17.7% 175 -24.6% Sep-2023 174 -7.9% 163 -23.5% Oct-2023 211 +8.2% 188 -14.9% Nov-2023 156 -6.0% 154 -3.8% Dec-2023 99 -14.7% 158 +29.5% 12-Month Avg 157 -21.0% 181 -29.4% Historical Pending Sales by Month A count of the properties on which offers have been accepted in a given month. Current as of January 11, 2024. All data from the San Francisco Association of REALTORS® MLS. Report © 2024 ShowingTime. | 5 129 226 116 122 99 158 Single Family Condo/TIC/Coop December 0 100 200 300 400 500 600 1-2005 1-2006 1-2007 1-2008 1-2009 1-2010 1-2011 1-2012 1-2013 1-2014 1-2015 1-2016 1-2017 1-2018 1-2019 1-2020 1-2021 1-2022 1-2023 Single Family Condo/TIC/Coop 3,026 4,486 2,389 3,080 1,888 2,176 Single Family Condo/TIC/Coop Year to Date 2021 2022 2023 + 29.5% - 46.0% - 14.7% - 10.1% - 31.3% - 21.0% - 21.1% - 29.4% 2021 2022 2023 2021 2022 2023 2021 2022 2023 - 34.5% + 20.7% + 57.5% - 26.1%
- 6. Sold Listings Sold Listings Single Family Year-Over-Year Change Condo/TIC/ Coop Year-Over-Year Change Jan-2023 100 -23.1% 105 -43.5% Feb-2023 101 -36.5% 142 -43.2% Mar-2023 151 -41.2% 248 -37.1% Apr-2023 174 -32.3% 217 -43.2% May-2023 188 -33.3% 232 -37.0% Jun-2023 205 -17.7% 207 -33.0% Jul-2023 159 -12.6% 166 -29.4% Aug-2023 151 -20.5% 160 -32.5% Sep-2023 146 -18.9% 170 -19.0% Oct-2023 201 +4.7% 189 -15.6% Nov-2023 192 +3.2% 153 -26.1% Dec-2023 119 -22.7% 162 +10.2% 12-Month Avg 157 -22.0% 179 -31.7% Historical Sold Listings by Month A count of the actual sales that closed in a given month. Current as of January 11, 2024. All data from the San Francisco Association of REALTORS® MLS. Report © 2024 ShowingTime. | 6 216 325 154 147 119 162 Single Family Condo/TIC/Coop December 0 100 200 300 400 500 1-2005 1-2006 1-2007 1-2008 1-2009 1-2010 1-2011 1-2012 1-2013 1-2014 1-2015 1-2016 1-2017 1-2018 1-2019 1-2020 1-2021 1-2022 1-2023 Single Family Condo/TIC/Coop 3,051 4,507 2,418 3,149 1,887 2,151 Single Family Condo/TIC/Coop Year to Date 2021 2022 2023 + 10.2% - 54.8% - 22.7% - 28.7% - 30.1% - 22.0% - 20.7% - 31.7% 2021 2022 2023 2021 2022 2023 2021 2022 2023 - 28.7% + 23.8% + 61.7% - 7.9%
- 7. Median Sales Price Median Sales Price Single Family Year-Over-Year Change Condo/TIC/ Coop Year-Over-Year Change Jan-2023 $1,367,500 -16.1% $1,000,000 -6.5% Feb-2023 $1,440,000 -25.4% $1,162,500 -5.3% Mar-2023 $1,697,500 -15.1% $1,060,000 -12.2% Apr-2023 $1,560,500 -23.9% $1,175,000 -14.2% May-2023 $1,650,000 -17.8% $1,062,500 -12.6% Jun-2023 $1,600,000 -14.9% $1,125,000 -9.3% Jul-2023 $1,450,000 -13.0% $1,135,000 -5.2% Aug-2023 $1,575,000 -1.9% $1,084,193 +8.4% Sep-2023 $1,582,500 -4.1% $1,050,000 -9.5% Oct-2023 $1,650,000 -1.2% $1,160,000 -3.3% Nov-2023 $1,528,500 +1.9% $1,125,000 0.0% Dec-2023 $1,450,000 -5.7% $996,500 +4.9% 12-Month Avg* $1,550,000 -12.9% $1,100,000 -8.3% Historical Median Sales Price by Month Point at which half of the sales sold for more and half sold for less, not accounting for seller concessions, in a given month. * Median Sales Price for all properties from January 2023 through December 2023. This is not the average of the individual figures above. Current as of January 11, 2024. All data from the San Francisco Association of REALTORS® MLS. Report © 2024 ShowingTime. | 7 $1,690,000 $1,300,000 $1,537,500 $950,000 $1,450,000 $996,500 Single Family Condo/TIC/Coop December $500,000 $750,000 $1,000,000 $1,250,000 $1,500,000 $1,750,000 $2,000,000 $2,250,000 1-2005 1-2006 1-2007 1-2008 1-2009 1-2010 1-2011 1-2012 1-2013 1-2014 1-2015 1-2016 1-2017 1-2018 1-2019 1-2020 1-2021 1-2022 1-2023 Single Family Condo/TIC/Coop $1,800,000 $1,210,000 $1,780,000 $1,200,000 $1,550,000 $1,100,000 Single Family Condo/TIC/Coop Year to Date 2021 2022 2023 + 4.9% - 26.9% - 5.7% - 9.0% - 0.8% - 12.9% - 1.1% - 8.3% 2021 2022 2023 2021 2022 2023 2021 2022 2023 + 9.0% + 11.9% + 1.7% + 18.2%
- 8. Average Sales Price Average Sales Price Single Family Year-Over-Year Change Condo/TIC/ Coop Year-Over-Year Change Jan-2023 $1,811,636 -8.1% $1,264,429 -3.6% Feb-2023 $1,823,104 -24.6% $1,296,409 -7.3% Mar-2023 $2,280,520 -10.0% $1,207,124 -14.5% Apr-2023 $2,209,070 -12.0% $1,370,225 -7.1% May-2023 $2,145,625 -11.0% $1,171,111 -16.5% Jun-2023 $2,009,398 -14.7% $1,300,566 -4.8% Jul-2023 $1,835,021 -10.9% $1,213,203 -17.3% Aug-2023 $2,141,891 +10.0% $1,211,778 +3.1% Sep-2023 $2,045,226 +8.7% $1,342,704 -0.0% Oct-2023 $2,312,677 +4.6% $1,268,540 -10.6% Nov-2023 $2,018,188 +6.5% $1,246,219 -10.6% Dec-2023 $1,983,028 +6.0% $1,169,699 +6.5% 12-Month Avg* $2,072,733 -6.4% $1,254,267 -8.7% Historical Average Sales Price by Month Average sales price for all closed sales, not accounting for seller concessions, in a given month. * Avg. Sales Price for all properties from January 2023 through December 2023. This is not the average of the individual figures above. Current as of January 11, 2024. All data from the San Francisco Association of REALTORS® MLS. Report © 2024 ShowingTime. | 8 $2,365,749 $1,488,734 $1,870,417 $1,098,424 $1,983,028 $1,169,699 Single Family Condo/TIC/Coop December $500,000 $1,000,000 $1,500,000 $2,000,000 $2,500,000 $3,000,000 1-2005 1-2006 1-2007 1-2008 1-2009 1-2010 1-2011 1-2012 1-2013 1-2014 1-2015 1-2016 1-2017 1-2018 1-2019 1-2020 1-2021 1-2022 1-2023 Single Family Condo/TIC/Coop $2,310,478 $1,391,860 $2,213,486 $1,373,270 $2,072,733 $1,254,267 Single Family Condo/TIC/Coop Year to Date 2021 2022 2023 + 6.5% - 26.2% + 6.0% - 20.9% - 1.3% - 6.4% - 4.2% - 8.7% 2021 2022 2023 2021 2022 2023 2021 2022 2023 + 17.7% + 15.3% + 5.8% + 16.1%
- 9. Days on Market Until Sale Days on Market Until Sale Single Family Year-Over-Year Change Condo/TIC/ Coop Year-Over-Year Change Jan-2023 50 +22.0% 87 +27.9% Feb-2023 33 +50.0% 59 +63.9% Mar-2023 32 +100.0% 58 +70.6% Apr-2023 31 +93.8% 56 +75.0% May-2023 28 +33.3% 52 +40.5% Jun-2023 26 +52.9% 50 +28.2% Jul-2023 26 +23.8% 54 +10.2% Aug-2023 36 +38.5% 57 +14.0% Sep-2023 30 +7.1% 54 -6.9% Oct-2023 23 -17.9% 47 +9.3% Nov-2023 31 -11.4% 57 +11.8% Dec-2023 40 +5.3% 72 -2.7% 12-Month Avg* 31 +28.0% 57 +29.4% Historical Days on Market Until Sale by Month Average number of days between when a property is listed and when an offer is accepted in a given month. * Days on Market for all properties from January 2023 through December 2023. This is not the average of the individual figures above. Current as of January 11, 2024. All data from the San Francisco Association of REALTORS® MLS. Report © 2024 ShowingTime. | 9 31 47 38 74 40 72 Single Family Condo/TIC/Coop December 0 20 40 60 80 100 120 1-2005 1-2006 1-2007 1-2008 1-2009 1-2010 1-2011 1-2012 1-2013 1-2014 1-2015 1-2016 1-2017 1-2018 1-2019 1-2020 1-2021 1-2022 1-2023 Single Family Condo/TIC/Coop 24 46 24 44 31 57 Single Family Condo/TIC/Coop Year to Date 2021 2022 2023 - 2.7% + 57.4% + 5.3% + 22.6% - 4.3% + 29.2% 0.0% + 29.5% 2021 2022 2023 2021 2022 2023 2021 2022 2023 - 13.9% - 17.2% 0.0% - 26.6%
- 10. Inventory of Active Listings Inventory of Active Listings Single Family Year-Over-Year Change Condo/TIC/ Coop Year-Over-Year Change Jan-2023 260 -0.4% 652 -21.4% Feb-2023 284 -5.0% 724 -26.9% Mar-2023 319 +1.3% 772 -26.3% Apr-2023 342 +1.8% 788 -29.0% May-2023 356 +7.6% 806 -28.0% Jun-2023 323 -13.9% 791 -28.2% Jul-2023 312 -15.0% 763 -25.3% Aug-2023 341 -2.8% 700 -21.8% Sep-2023 481 -0.6% 976 -11.6% Oct-2023 451 -4.7% 974 -11.1% Nov-2023 330 -12.0% 805 -7.6% Dec-2023 151 -30.1% 441 -15.5% 12-Month Avg* 329 -5.6% 766 -21.5% Historical Inventory of Active Listings by Month The number of properties available for sale in active status at the end of a given month. * Active Listings for all properties from January 2023 through December 2023. This is not the average of the individual figures above. Current as of January 11, 2024. All data from the San Francisco Association of REALTORS® MLS. Report © 2024 ShowingTime. | 10 205 677 216 522 151 441 Single Family Condo/TIC/Coop December 0 500 1,000 1,500 2,000 2,500 1-2005 1-2006 1-2007 1-2008 1-2009 1-2010 1-2011 1-2012 1-2013 1-2014 1-2015 1-2016 1-2017 1-2018 1-2019 1-2020 1-2021 1-2022 1-2023 Single Family Condo/TIC/Coop 2021 2022 2023 - 15.5% - 22.9% - 30.1% + 5.4% 2021 2022 2023 - 48.6% - 40.7%
- 11. % of Properties Sold Over List Price % of Properties Sold Over List Price Single Family Year-Over-Year Change Condo/TIC/ Coop Year-Over-Year Change Jan-2023 44.0% -41.6% 19.0% -50.9% Feb-2023 51.5% -40.7% 28.2% -51.7% Mar-2023 62.7% -27.4% 36.3% -37.5% Apr-2023 62.1% -30.0% 32.7% -47.9% May-2023 63.3% -27.2% 40.9% -26.0% Jun-2023 69.8% -19.1% 37.7% -34.2% Jul-2023 66.7% -15.1% 30.7% -22.5% Aug-2023 64.2% -14.7% 31.3% -15.6% Sep-2023 68.5% +1.9% 31.2% +0.6% Oct-2023 67.7% +5.6% 34.4% -8.3% Nov-2023 62.0% +7.8% 33.3% +9.5% Dec-2023 54.6% +12.1% 22.2% +42.3% 12-Month Avg 62.7% -18.4% 32.5% -30.9% Historical % of Properties Sold Over List Price by Month Percentage found when dividing the number of properties sold by properties sold over its original list price, not accounting for seller concessions. * % of Properties Sold Over List Price for all properties from January 2023 through December 2023. This is not the average of the individual figures above. Current as of January 11, 2024. All data from the San Francisco Association of REALTORS® MLS. Report © 2024 ShowingTime. | 11 78.7% 46.5% 48.7% 15.6% 54.6% 22.2% Single Family Condo/TIC/Coop December 0.0% 20.0% 40.0% 60.0% 80.0% 100.0% 1-2005 1-2006 1-2007 1-2008 1-2009 1-2010 1-2011 1-2012 1-2013 1-2014 1-2015 1-2016 1-2017 1-2018 1-2019 1-2020 1-2021 1-2022 1-2023 Single Family Condo/TIC/Coop 78.8% 49.2% 76.8% 47.1% 62.7% 32.5% Single Family Condo/TIC/Coop Year to Date 2021 2022 2023 + 42.3% - 66.5% + 12.1% - 38.1% - 4.3% - 18.4% - 2.5% - 31.0% 2021 2022 2023 2021 2022 2023 2021 2022 2023 + 24.9% + 20.3% + 21.8% + 62.6%
- 12. % of List Price Received % of List Price Received Single Family Year-Over-Year Change Condo/TIC/ Coop Year-Over-Year Change Jan-2023 103.2% -12.1% 97.9% -3.2% Feb-2023 103.7% -14.4% 99.0% -6.7% Mar-2023 108.0% -11.4% 100.4% -5.6% Apr-2023 107.1% -13.0% 99.9% -6.8% May-2023 108.2% -9.5% 100.1% -5.5% Jun-2023 108.6% -7.0% 100.6% -4.5% Jul-2023 108.3% -2.4% 99.6% -1.9% Aug-2023 107.2% -1.0% 99.5% -1.2% Sep-2023 107.6% -0.8% 99.0% -1.6% Oct-2023 107.9% +0.7% 99.7% -0.7% Nov-2023 106.1% +1.1% 100.1% +0.9% Dec-2023 104.1% +1.2% 99.0% +0.9% 12-Month Avg* 107.0% -6.5% 99.7% -3.7% Historical % of List Price Received by Month Percentage found when dividing a property’s sales price by its most recent list price, then taking the average for all properties sold in a given month, not accounting for seller concessions. * % of List Price Received for all properties from January 2023 through December 2023. This is not the average of the individual figures above. Current as of January 11, 2024. All data from the San Francisco Association of REALTORS® MLS. Report © 2024 ShowingTime. | 12 114.3% 103.5% 102.9% 98.1% 104.1% 99.0% Single Family Condo/TIC/Coop December 114.7% 103.8% 114.4% 103.5% 107.0% 99.7% Single Family Condo/TIC/Coop Year to Date 90.0% 100.0% 110.0% 120.0% 130.0% 1-2005 1-2006 1-2007 1-2008 1-2009 1-2010 1-2011 1-2012 1-2013 1-2014 1-2015 1-2016 1-2017 1-2018 1-2019 1-2020 1-2021 1-2022 1-2023 Single Family Condo/TIC/Coop 2021 2022 2023 + 0.9% - 5.2% + 1.2% - 10.0% 2021 2022 2023 + 7.8% + 4.2% 2021 2022 2023 - 3.7% - 0.3% - 6.5% - 0.3% 2021 2022 2023 + 6.7% + 2.6%
- 13. Housing Affordability Ratio Housing Affordability Ratio Single Family Year-Over-Year Change Condo/TIC/ Coop Year-Over-Year Change Jan-2023 31 -3.1% 48 -15.8% Feb-2023 28 +3.7% 40 -18.4% Mar-2023 24 0.0% 44 -2.2% Apr-2023 26 +23.8% 40 +8.1% May-2023 25 +13.6% 43 +2.4% Jun-2023 25 +8.7% 40 0.0% Jul-2023 27 0.0% 39 -9.3% Aug-2023 24 -14.3% 40 -21.6% Sep-2023 24 0.0% 41 +5.1% Oct-2023 22 -4.3% 35 -5.4% Nov-2023 25 -7.4% 38 -5.0% Dec-2023 28 +3.7% 46 -6.1% 12-Month Avg* 26 +10.0% 41 +4.7% Historical Housing Affordability Ratio by Month This index measures housing affordability for the region. For example, an index of 120 means the median household income is 120% of what is necessary to qualify for the median-priced home under prevailing interest rates. A higher number means greater affordability. * Affordability Ratio for all properties from January 2023 through December 2023. This is not the average of the individual figures above. Current as of January 11, 2024. All data from the San Francisco Association of REALTORS® MLS. Report © 2024 ShowingTime. | 13 32 49 27 49 28 46 Single Family Condo/TIC/Coop December 20 40 60 80 100 1-2005 1-2006 1-2007 1-2008 1-2009 1-2010 1-2011 1-2012 1-2013 1-2014 1-2015 1-2016 1-2017 1-2018 1-2019 1-2020 1-2021 1-2022 1-2023 Single Family Condo/TIC/Coop 2021 2022 2023 - 6.1% 0.0% + 3.7% - 15.6% 2021 2022 2023 - 13.5% - 21.0% 30 53 23 39 26 41 Single Family Condo/TIC/Coop Year to Date 2021 2022 2023 + 5.1% - 26.4% + 13.0% - 23.3% 2021 2022 2023 - 16.7% - 8.6%
- 14. Months Supply of Inventory Months Supply of Inventory Single Family Year-Over-Year Change Condo/TIC/ Coop Year-Over-Year Change Jan-2023 1.3 +30.0% 2.7 +22.7% Feb-2023 1.5 +25.0% 3.1 +14.8% Mar-2023 1.8 +38.5% 3.5 +20.7% Apr-2023 2.0 +42.9% 3.7 +15.6% May-2023 2.1 +50.0% 4.0 +21.2% Jun-2023 1.9 +18.8% 4.0 +17.6% Jul-2023 1.9 +18.8% 4.0 +25.0% Aug-2023 2.1 +31.3% 3.8 +31.0% Sep-2023 3.0 +30.4% 5.4 +45.9% Oct-2023 2.8 +21.7% 5.4 +38.5% Nov-2023 2.1 +10.5% 4.5 +36.4% Dec-2023 1.0 -9.1% 2.4 +20.0% 12-Month Avg* 2.0 +28.5% 3.9 +26.3% Historical Months Supply of Inventory by Month The inventory of homes for sale at the end of a given month, divided by the average monthly pending sales from the last 12 months. * Months Supply for all properties from January 2023 through December 2023. This is not the average of the individual figures above. Current as of January 11, 2024. All data from the San Francisco Association of REALTORS® MLS. Report © 2024 ShowingTime. | 14 0.8 1.8 1.1 2.0 1.0 2.4 Single Family Condo/TIC/Coop December 0.0 2.0 4.0 6.0 8.0 10.0 12.0 1-2005 1-2006 1-2007 1-2008 1-2009 1-2010 1-2011 1-2012 1-2013 1-2014 1-2015 1-2016 1-2017 1-2018 1-2019 1-2020 1-2021 1-2022 1-2023 Single Family Condo/TIC/Coop 2021 2022 2023 + 20.0% + 11.1% - 9.1% + 37.5% 2021 2022 2023 - 57.9% - 62.5%
- 15. All Properties Activity Overview Key metrics by report month and for year-to-date (YTD) starting from the first of the year. Key Metrics Historical Sparkbars 12-2022 12-2023 Percent Change YTD 2022 YTD 2023 Percent Change Current as of January 11, 2024. All data from the San Francisco Association of REALTORS® MLS. Report © 2024 ShowingTime. | 15 Months Supply 1.7 1.8 + 5.9% -- -- -- Affordability Ratio 31 30 - 3.2% % of List Price Received 100.7% 101.1% + 0.4% 108.2% 27 46.4% - 22.7% - 4.8% 28 + 3.7% 103.0% % of Properties Sold Over List Price 33.0% 35.4% + 7.3% 60.0% Active Listings 762 612 - 19.7% -- Avg. Sales Price $1,492,891 $1,532,454 + 2.7% $1,733,256 Days on Market 55 58 + 5.5% 36 $1,315,000 - 9.1% - 5.8% 45 + 25.0% $1,633,563 -- -- Sold Listings 309 285 - 7.8% 5,636 4,092 - 27.4% Median Sales Price $1,250,000 $1,170,000 - 6.4% $1,447,000 - 24.6% Pending Sales 240 261 + 8.7% 5,535 4,120 - 25.6% New Listings 153 124 - 19.0% 8,231 6,209 12-2020 12-2021 12-2022 12-2023 12-2020 12-2021 12-2022 12-2023 12-2020 12-2021 12-2022 12-2023 12-2020 12-2021 12-2022 12-2023 12-2020 12-2021 12-2022 12-2023 12-2020 12-2021 12-2022 12-2023 12-2020 12-2021 12-2022 12-2023 12-2020 12-2021 12-2022 12-2023 12-2020 12-2021 12-2022 12-2023 12-2020 12-2021 12-2022 12-2023 12-2020 12-2021 12-2022 12-2023
- 16. Activity by District SF District 1: Northwest (Sea Cliff, Lake, Jordan Park / Laurel Heights, Outer Richmond, Central Richmond, Inner Richmond, Lone Mountain) SF District 2: Central West (Outer Sunset, Central Sunset, Inner Sunset, Outer Parkside, Parkside, Inner Parkside, Golden Gate Heights) SF District 3: Southwest (Pine Lake Park, Lake Shore, Merced Manor, Stonestown, Lakeside, Merced Heights, Ingleside, Ingleside Heights, Oceanview) SF District 4: Twin Peaks W (Forest Hill (& Ext), W Portal, St Francis Wd, Balboa Terr, Mt Dav Manor, Ingleside Terr, Monterey Hts, Wstwd Pk & H'lnds, Shrwd Fst, Miraloma Pk, Dmnd Hts, Mdtwn Terr) SF District 5: Central (Haight Ashbury, Cole Vly / Prnssus Hts, Clarndn Hts, Corona Hts, Twin Pks, Glen Pk, Noe Vly, Eureka Vly / Dolores Hts, Mission Dolores, Duboce Trngl, Buena Vista / Ashbury Hts) SF District 6: Central North (Lower Pacific Heights, Anza Vista, Western Addition, North Panhandle, Alamo Square, Hayes Valley) SF District 7: North (Marina, Cow Hollow, Presidio Heights, Pacific Heights) SF District 8: Northeast (North Waterfront, North Beach, Russian Hill, Telegraph Hill, Nob Hill, Financial District / Barbary Coast, Downtown, Van Ness / Civic Center, Tenderloin) SF District 9: Central East (Yerba Buena, South Beach, South of Market, Mission Bay, Inner Mission, Potrero Hill, Central Waterfront / Dogpatch, Bernal Heights) SF District 10: Southeast (Outer Mission, Mission Terr, Excelsior, Portola, Bayview, Silver Terr, Hunters Pt, Candlestick Pt, Bayview Hts, Little Hollywood, Visitation Vly, Crocker Amazon) 12-2022 12-2023 + / – 12-2022 12-2023 + / – 12-2022 12-2023 + / – 12-2022 12-2023 + / – 12-2022 12-2023 + / – Single Family 1 SF District 1 20 5 -75.0% 12 16 +33.3% $2,385,000 $2,005,875 -15.9% 36 44 +22.2% 1.2 0.3 -75.0% 2 SF District 2 17 18 +5.9% 33 13 -60.6% $1,600,000 $1,400,000 -12.5% 33 43 +30.3% 0.4 0.6 +50.0% 3 SF District 3 16 10 -37.5% 9 9 0.0% $1,094,000 $1,050,000 -4.0% 45 44 -2.2% 1.2 0.9 -25.0% 4 SF District 4 25 10 -60.0% 24 17 -29.2% $1,627,500 $1,635,000 +0.5% 42 35 -16.7% 0.9 0.4 -55.6% 5 SF District 5 21 20 -4.8% 22 13 -40.9% $2,170,000 $2,350,000 +8.3% 39 52 +33.3% 0.7 1.0 +42.9% 6 SF District 6 4 3 -25.0% 3 4 +33.3% $2,709,500 $2,440,000 -9.9% 28 51 +82.1% 1.2 1.0 -16.7% 7 SF District 7 23 17 -26.1% 3 8 +166.7% $9,000,000 $3,902,500 -56.6% 52 62 +19.2% 2.9 2.1 -27.6% 8 SF District 8 7 5 -28.6% 0 1 -- $0 $7,000,000 -- 0 0 -- 2.3 2.9 +26.1% 9 SF District 9 25 11 -56.0% 14 10 -28.6% $1,775,000 $1,442,500 -18.7% 25 46 +84.0% 1.2 0.7 -41.7% 10 SF District 10 58 52 -10.3% 34 28 -17.6% $1,025,000 $927,500 -9.5% 42 23 -45.2% 1.5 1.6 +6.7% Condo/TIC/Coop 1 SF District 1 13 14 +7.7% 8 11 +37.5% $1,170,000 $1,100,000 -6.0% 50 59 +18.0% 0.9 1.3 +44.4% 2 SF District 2 12 6 -50.0% 4 5 +25.0% $677,000 $778,000 +14.9% 42 29 -31.0% 3.8 1.5 -60.5% 3 SF District 3 2 2 0.0% 0 0 -- $0 $0 -- 0 0 -- 0.6 0.9 +50.0% 4 SF District 4 7 1 -85.7% 1 3 +200.0% $391,120 $591,000 +51.1% 250 75 -70.0% 1.6 0.3 -81.3% 5 SF District 5 50 28 -44.0% 19 25 +31.6% $1,150,000 $1,119,000 -2.7% 54 56 +3.7% 1.1 0.9 -18.2% 6 SF District 6 30 22 -26.7% 11 18 +63.6% $1,025,000 $865,000 -15.6% 90 68 -24.4% 1.0 1.2 +20.0% 7 SF District 7 27 31 +14.8% 20 15 -25.0% $1,577,500 $1,270,000 -19.5% 71 47 -33.8% 1.0 1.7 +70.0% 8 SF District 8 114 106 -7.0% 25 27 +8.0% $790,000 $940,000 +19.0% 70 77 +10.0% 2.7 3.1 +14.8% 9 SF District 9 243 207 -14.8% 52 53 +1.9% $905,000 $998,000 +10.3% 85 91 +7.1% 2.9 3.7 +27.6% 10 SF District 10 24 24 0.0% 7 5 -28.6% $710,000 $850,000 +19.7% 61 59 -3.3% 3.8 5.9 +55.3% Key metrics by report month for the districts of San Francisco. Current as of January 11, 2024. All data from the San Francisco Association of REALTORS® MLS. Report © 2024 ShowingTime. | 16 Active Listings Sold Listings Median Sales Price Days on Market Months Supply