San Francisco Market Focus September 2014
•
0 likes•375 views

San Francisco Market Focus September 2014

Recommended
More Related Content
What's hot
What's hot (20)
Viewers also liked
Viewers also liked (7)
Similar to San Francisco Market Focus September 2014
Similar to San Francisco Market Focus September 2014 (10)
More from Ronny Budiutama
More from Ronny Budiutama (20)
Recently uploaded
Recently uploaded (20)
San Francisco Market Focus September 2014
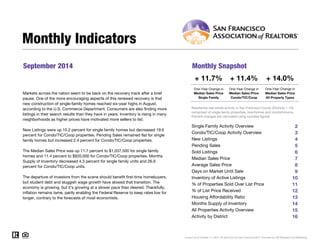
- 1. September 2014 Monthly Snapshot One-Year Change in One-Year Change in Median Sales Price Single Family Median Sales Price Condo/TIC/Coop 2 3 4 5 6 7 8 9 10 11 12 13 14 15 16 Monthly Indicators + 11.7% + 11.4% + 14.0% One-Year Change in Markets across the nation seem to be back on the recovery track after a brief pause. One of the more encouraging aspects of this renewed recovery is that new construction of single-family homes reached six-year highs in August, according to the U.S. Commerce Department. Consumers are also finding more listings in their search results than they have in years. Inventory is rising in many neighborhoods as higher prices have motivated more sellers to list. New Listings were up 10.2 percent for single family homes but decreased 19.6 percent for Condo/TIC/Coop properties. Pending Sales remained flat for single family homes but increased 2.4 percent for Condo/TIC/Coop properties. The Median Sales Price was up 11.7 percent to $1,037,500 for single family homes and 11.4 percent to $920,000 for Condo/TIC/Coop properties. Months Supply of Inventory decreased 4.3 percent for single family units and 26.9 percent for Condo/TIC/Coop units. The departure of investors from the scene should benefit first-time homebuyers, but student debt and sluggish wage growth have slowed that transition. The economy is growing, but it's growing at a slower pace than desired. Thankfully, inflation remains tame, partly enabling the Federal Reserve to keep rates low for longer, contrary to the forecasts of most economists. Median Sales Price All Property Types Residential real estate activity in San Francisco County (Districts 1-10), comprised of single-family properties, townhomes and condominiums. Percent changes are calculated using rounded figures. Single Family Activity Overview Months Supply of Inventory Current as of October 11, 2014. All data from the San Francisco MLS. Powered by 10K Research and Marketing. Condo/TIC/Coop Activity Overview Inventory of Active Listings % of Properties Sold Over List Price % of List Price Received Housing Affordability Ratio All Properties Activity Overview New Listings Pending Sales Sold Listings Median Sales Price Average Sales Price Days on Market Until Sale Activity by District
- 2. Single Family Activity Overview Key metrics by report month and for year-to-date (YTD) starting from the first of the year. Key Metrics Historical Sparkbars 9-2013 9-2014 Percent Change YTD 2013 YTD 2014 Percent Change Current as of October 11, 2014. All data from the San Francisco MLS. Powered by 10K Research and Marketing. | Click for Cover Page | 2 Months Supply 2.3 2.2 - 4.3% -- -- -- Affordability Ratio 49 43 - 12.2% % of List Price Received 109.8% 112.1% + 2.1% 110.2% 51 80.6% + 5.5% + 2.4% 43 - 15.7% 112.8% % of Properties Sold Over List Price 78.7% 79.3% + 0.8% 76.4% Active Listings 506 446 - 11.9% -- Avg. Sales Price $1,235,064 $1,339,412 + 8.4% $1,274,003 Days on Market 31 27 - 12.9% 36 31 - 13.9% $1,426,485 -- -- Median Sales Price $929,000 $1,037,500 + 11.7% $905,000 Sold Listings 188 184 - 2.1% 1,948 New Listings 295 325 + 10.2% 2,429 Pending Sales 209 209 0.0% - 10.2% 1,987 1,784 - 7.7% 2,241 1,713 - 12.1% $1,050,000 + 16.0% + 12.0% 9-2011 9-2012 9-2013 9-2014 9-2011 9-2012 9-2013 9-2014 9-2011 9-2012 9-2013 9-2014 9-2011 9-2012 9-2013 9-2014 9-2011 9-2012 9-2013 9-2014 9-2011 9-2012 9-2013 9-2014 9-2011 9-2012 9-2013 9-2014 9-2011 9-2012 9-2013 9-2014 9-2011 9-2012 9-2013 9-2014 9-2011 9-2012 9-2013 9-2014 9-2011 9-2012 9-2013 9-2014
- 3. Condo/TIC/Coop Activity Overview Key metrics by report month and for year-to-date (YTD) starting from the first of the year. Key Metrics Historical Sparkbars 9-2013 9-2014 Percent Change YTD 2013 YTD 2014 Percent Change Current as of October 11, 2014. All data from the San Francisco MLS. Powered by 10K Research and Marketing. | Click for Cover Page | 3 Months Supply 2.6 1.9 - 26.9% -- -- -- Affordability Ratio 63 56 - 11.1% % of List Price Received 105.8% 105.5% - 0.3% 105.5% 64 68.7% + 5.0% + 1.7% 55 - 14.1% 107.3% % of Properties Sold Over List Price 68.6% 67.0% - 2.3% 65.4% Active Listings 723 523 - 27.7% -- Avg. Sales Price $941,430 $1,023,825 + 8.8% $948,530 Days on Market 37 38 + 2.7% 41 $935,000 + 14.0% + 15.7% 36 - 12.2% $1,097,565 -- -- Sold Listings 229 233 + 1.7% 2,467 2,364 - 4.2% Median Sales Price $826,000 $920,000 + 11.4% $820,000 - 8.3% Pending Sales 254 260 + 2.4% 2,540 2,428 - 4.4% New Listings 450 362 - 19.6% 3,259 2,990 9-2011 9-2012 9-2013 9-2014 9-2011 9-2012 9-2013 9-2014 9-2011 9-2012 9-2013 9-2014 9-2011 9-2012 9-2013 9-2014 9-2011 9-2012 9-2013 9-2014 9-2011 9-2012 9-2013 9-2014 9-2011 9-2012 9-2013 9-2014 9-2011 9-2012 9-2013 9-2014 9-2011 9-2012 9-2013 9-2014 9-2011 9-2012 9-2013 9-2014 9-2011 9-2012 9-2013 9-2014
- 4. New Listings New Listings SingleFamily Year-Over-YearChange Condo/TIC/ Coop Year-Over-YearChange Oct-2013 277 -3.5% 321 +5.2% Nov-2013 171 -5.5% 191 -9.5% Dec-2013 112 +9.8% 116 +1.8% Jan-2014 207 +1.5% 337 +8.4% Feb-2014 196 -7.1% 304 -3.8% Mar-2014 235 -7.5% 303 -18.1% Apr-2014 243 -19.5% 368 -7.1% May-2014 274 -19.2% 356 -7.3% Jun-2014 278 -5.1% 356 -0.8% Jul-2014 266 +2.7% 350 +5.4% Aug-2014 217 -20.2% 254 -25.5% Sep-2014 325 +10.2% 362 -19.6% 12-Month Avg 233 -6.6% 302 -7.0% Historical New Listings by Month Current as of October 11, 2014. All data from the San Francisco MLS. Powered by 10K Research and Marketing. | Click for Cover Page | 4 A count of the properties that have been newly listed on the market in a given month. 317 387 295 450 325 362 Single Family Condo/TIC/Coop September 0 100 200 300 400 500 600 700 1-2005 1-2006 1-2007 1-2008 1-2009 1-2010 1-2011 1-2012 1-2013 1-2014 Single Family Condo/TIC/Coop 2,402 2,960 2,429 3,259 2,241 2,990 Single Family Condo/TIC/Coop Year to Date 2012 2013 2014 - 19.6% + 16.3% + 10.2% - 6.9% + 10.1% - 7.7% + 1.1% - 8.3% 2012 2013 2014 2012 2013 2014 2012 2013 2014 - 20.2% - 15.3% - 10.7% - 5.6%
- 5. Pending Sales Pending Sales SingleFamily Year-Over-YearChange Condo/TIC/ Coop Year-Over-YearChange Oct-2013 244 -15.0% 340 +22.7% Nov-2013 224 -10.8% 269 -0.7% Dec-2013 173 +1.8% 202 -0.5% Jan-2014 133 -15.8% 185 +6.3% Feb-2014 166 +11.4% 251 +15.7% Mar-2014 218 +5.3% 296 -2.0% Apr-2014 209 -13.6% 294 -4.9% May-2014 217 -19.0% 297 -17.5% Jun-2014 202 -27.1% 305 +5.2% Jul-2014 229 -7.7% 276 -16.9% Aug-2014 201 -12.2% 264 -12.6% Sep-2014 209 0.0% 260 +2.4% 12-Month Avg 202 -10.0% 270 -1.6% Historical Pending Sales by Month A count of the properties on which offers have been accepted in a given month. Current as of October 11, 2014. All data from the San Francisco MLS. Powered by 10K Research and Marketing. | Click for Cover Page | 5 182 218 209 254 209 260 Single Family Condo/TIC/Coop September 0 100 200 300 400 1-2005 1-2006 1-2007 1-2008 1-2009 1-2010 1-2011 1-2012 1-2013 1-2014 Single Family Condo/TIC/Coop 1,939 2,402 1,987 2,540 1,784 2,428 Single Family Condo/TIC/Coop Year to Date 2012 2013 2014 + 2.4% + 16.5% 0.0% + 14.8% + 5.7% - 10.2% + 2.5% - 4.4% 2012 2013 2014 2012 2013 2014 2012 2013 2014 - 6.7% + 3.9% + 20.9% + 16.6%
- 6. Sold Listings Sold Listings SingleFamily Year-Over-YearChange Condo/TIC/ Coop Year-Over-YearChange Oct-2013 256 +0.4% 336 +22.2% Nov-2013 240 -11.8% 284 +5.2% Dec-2013 216 +3.3% 246 -2.0% Jan-2014 132 -18.0% 180 +15.4% Feb-2014 157 +21.7% 222 +13.8% Mar-2014 177 -14.5% 267 -5.3% Apr-2014 207 -6.8% 327 +7.6% May-2014 230 -8.7% 295 -22.4% Jun-2014 192 -29.4% 282 +1.8% Jul-2014 227 -18.6% 275 -19.4% Aug-2014 207 -13.0% 283 -6.6% Sep-2014 184 -2.1% 233 +1.7% 12-Month Avg 202 -9.6% 269 -1.0% Historical Sold Listings by Month A count of the actual sales that closed in a given month. Current as of October 11, 2014. All data from the San Francisco MLS. Powered by 10K Research and Marketing. | Click for Cover Page | 6 179 228 188 229 184 233 Single Family Condo/TIC/Coop September 0 100 200 300 400 1-2005 1-2006 1-2007 1-2008 1-2009 1-2010 1-2011 1-2012 1-2013 1-2014 Single Family Condo/TIC/Coop 1,898 2,370 1,948 2,467 1,713 2,364 Single Family Condo/TIC/Coop Year to Date 2012 2013 2014 + 1.7% + 0.4% - 2.1% + 5.0% + 4.1% - 12.1% + 2.6% - 4.2% 2012 2013 2014 2012 2013 2014 2012 2013 2014 - 15.2% + 4.8% + 20.0% + 14.0%
- 7. Median Sales Price Median Sales Price SingleFamily Year-Over-YearChange Condo/TIC/ Coop Year-Over-YearChange Oct-2013 $905,000 +9.0% $864,000 +13.7% Nov-2013 $957,000 +18.1% $826,000 +6.6% Dec-2013 $947,000 +13.4% $762,500 +9.1% Jan-2014 $916,500 +23.0% $950,000 +24.6% Feb-2014 $1,050,000 +31.2% $937,000 +24.9% Mar-2014 $985,000 +7.1% $970,000 +17.9% Apr-2014 $1,100,000 +10.0% $905,000 +7.1% May-2014 $1,090,500 +7.2% $940,000 +13.3% Jun-2014 $1,175,000 +25.1% $967,500 +24.0% Jul-2014 $1,087,500 +25.0% $950,000 +11.8% Aug-2014 $968,000 +3.6% $930,000 +14.8% Sep-2014 $1,037,500 +11.7% $920,000 +11.4% 12-Month Avg* $1,010,000 +14.8% $908,000 +13.5% Historical Median Sales Price by Month Point at which half of the sales sold for more and half sold for less, not accounting for seller concessions, in a given month. * Median Sales Price for all properties from October 2013 through September 2014. This is not the average of the individual figures above. Current as of October 11, 2014. All data from the San Francisco MLS. Powered by 10K Research and Marketing. | Click for Cover Page | 7 $725,000 $776,000 $929,000 $826,000 $1,037,500 $920,000 Single Family Condo/TIC/Coop September $500,000 $600,000 $700,000 $800,000 $900,000 $1,000,000 $1,100,000 $1,200,000 1-2005 1-2006 1-2007 1-2008 1-2009 1-2010 1-2011 1-2012 1-2013 1-2014 Single Family Condo/TIC/Coop $738,000 $695,000 $905,000 $820,000 $1,050,000 $935,000 Single Family Condo/TIC/Coop Year to Date 2012 2013 2014 + 11.4% + 6.4% + 11.7% + 28.1% + 18.0% + 16.0% + 22.6% + 14.0% 2012 2013 2014 2012 2013 2014 2012 2013 2014 + 11.1% + 6.2% + 10.5% + 34.7%
- 8. Average Sales Price Avg. Sales Price SingleFamily Year-Over-YearChange Condo/TIC/ Coop Year-Over-YearChange Oct-2013 $1,347,949 +4.0% $1,008,265 +13.4% Nov-2013 $1,323,997 +18.8% $978,584 +0.8% Dec-2013 $1,376,546 -0.6% $1,020,083 +19.3% Jan-2014 $1,241,019 +36.3% $1,126,706 +35.3% Feb-2014 $1,462,472 +25.4% $994,160 +13.6% Mar-2014 $1,423,755 +4.3% $1,062,576 +11.4% Apr-2014 $1,510,889 +10.9% $1,114,835 +14.6% May-2014 $1,459,316 -2.1% $1,160,115 +18.4% Jun-2014 $1,597,260 +33.6% $1,173,530 +26.1% Jul-2014 $1,415,509 +10.6% $1,095,783 +7.6% Aug-2014 $1,329,946 +2.2% $1,094,850 +17.8% Sep-2014 $1,339,412 +8.4% $1,023,825 +8.8% 12-Month Avg* $1,403,626 +10.6% $1,071,905 +14.3% Historical Average Sales Price by Month Average sales price for all closed sales, not accounting for seller concessions, in a given month. * Avg. Sales Price for all properties from October 2013 through September 2014. This is not the average of the individual figures above. Current as of October 11, 2014. All data from the San Francisco MLS. Powered by 10K Research and Marketing. | Click for Cover Page | 8 $936,072 $898,376 $1,235,064 $941,430 $1,339,412 $1,023,825 Single Family Condo/TIC/Coop September $600,000 $800,000 $1,000,000 $1,200,000 $1,400,000 $1,600,000 $1,800,000 1-2005 1-2006 1-2007 1-2008 1-2009 1-2010 1-2011 1-2012 1-2013 1-2014 Single Family Condo/TIC/Coop $1,045,818 $789,747 $1,274,003 $948,530 $1,426,485 $1,097,565 Single Family Condo/TIC/Coop Year to Date 2012 2013 2014 + 8.8% + 4.8% + 8.4% + 31.9% + 20.1% + 12.0% + 21.8% + 15.7% 2012 2013 2014 2012 2013 2014 2012 2013 2014 + 9.6% + 11.2% + 7.7% + 35.1%
- 9. Days on Market Until Sale Days on Market SingleFamily Year-Over-YearChange Condo/TIC/ Coop Year-Over-YearChange Oct-2013 34 -24.4% 38 -30.9% Nov-2013 34 -19.0% 41 -19.6% Dec-2013 42 -12.5% 44 -27.9% Jan-2014 40 -18.4% 51 -19.0% Feb-2014 38 -7.3% 40 -18.4% Mar-2014 32 -17.9% 33 -21.4% Apr-2014 35 0.0% 33 -19.5% May-2014 26 -18.8% 29 -19.4% Jun-2014 27 -22.9% 36 -5.3% Jul-2014 30 -9.1% 34 -12.8% Aug-2014 29 -23.7% 34 -10.5% Sep-2014 27 -12.9% 38 +2.7% 12-Month Avg* 33 -15.4% 37 -17.4% Historical Days on Market Until Sale by Month Average number of days between when a property is listed and when an offer is accepted in a given month. * Days on Market for all properties from October 2013 through September 2014. This is not the average of the individual figures above. Current as of October 11, 2014. All data from the San Francisco MLS. Powered by 10K Research and Marketing. | Click for Cover Page | 9 46 52 31 37 27 38 Single Family Condo/TIC/Coop September 20 40 60 80 100 120 1-2005 1-2006 1-2007 1-2008 1-2009 1-2010 1-2011 1-2012 1-2013 1-2014 Single Family Condo/TIC/Coop 56 65 36 41 31 36 Single Family Condo/TIC/Coop Year to Date 2012 2013 2014 + 2.7% - 28.8% - 12.9% - 32.6% - 36.9% - 13.9% - 35.7% - 12.2% 2012 2013 2014 2012 2013 2014 2012 2013 2014 - 29.2% - 13.8% - 18.8% - 36.6%
- 10. Inventory of Active Listings Active Listings SingleFamily Year-Over-YearChange Condo/TIC/ Coop Year-Over-YearChange Oct-2013 496 -9.7% 642 -10.5% Nov-2013 398 -10.8% 508 -15.8% Dec-2013 274 -14.4% 337 -18.0% Jan-2014 322 -5.3% 463 -8.0% Feb-2014 330 -13.8% 492 -14.9% Mar-2014 331 -18.9% 473 -23.3% Apr-2014 341 -23.5% 521 -21.4% May-2014 376 -22.8% 550 -14.5% Jun-2014 420 -10.6% 565 -14.1% Jul-2014 416 -9.4% 573 -6.7% Aug-2014 379 -19.4% 486 -17.8% Sep-2014 446 -11.9% 523 -27.7% 12-Month Avg* 377 -14.3% 511 -16.2% Historical Inventory of Active Listings by Month The number of properties available for sale in active status at the end of a given month. * Active Listings for all properties from October 2013 through September 2014. This is not the average of the individual figures above. Current as of October 11, 2014. All data from the San Francisco MLS. Powered by 10K Research and Marketing. | Click for Cover Page | 10 602 753 506 723 446 523 Single Family Condo/TIC/Coop September 200 400 600 800 1,000 1,200 1,400 1,600 1-2005 1-2006 1-2007 1-2008 1-2009 1-2010 1-2011 1-2012 1-2013 1-2014 Single Family Condo/TIC/Coop 2012 2013 2014 - 27.7% - 4.0% - 11.9% - 15.9% 2012 2013 2014 - 32.1% - 31.8%
- 11. % of Properties Sold Over List Price % of Properties Sold Over List Price SingleFamily Year-Over-YearChange Condo/TIC/ Coop Year-Over-YearChange Oct-2013 80.8% +23.4% 67.6% +11.4% Nov-2013 77.5% +16.5% 62.3% +14.5% Dec-2013 64.8% +5.0% 54.1% +17.1% Jan-2014 65.2% +1.9% 43.6% +9.8% Feb-2014 75.8% +4.3% 68.9% +25.5% Mar-2014 77.4% +3.3% 71.9% +13.9% Apr-2014 85.5% +7.3% 70.0% +4.3% May-2014 87.0% +11.8% 76.3% +12.9% Jun-2014 79.2% -1.1% 69.9% -2.6% Jul-2014 86.3% +10.5% 71.6% -2.3% Aug-2014 81.2% +8.0% 69.6% +5.5% Sep-2014 79.3% +0.8% 67.0% -2.3% 12-Month Avg 78.9% +7.8% 66.9% +6.8% Historical % of Properties Sold Over List Price by Month Percentage found when dividing the number of properties sold by properties sold over its original list price, not accounting for seller concessions. * % of Properties Sold Over List Price for all properties from October 2013 through September 2014. This is not the average of the individual figures above. Current as of October 11, 2014. All data from the San Francisco MLS. Powered by 10K Research and Marketing. | Click for Cover Page | 11 68.7% 53.1% 78.7% 68.6% 79.3% 67.0% Single Family Condo/TIC/Coop September 0.0% 20.0% 40.0% 60.0% 80.0% 100.0% 1-2005 1-2006 1-2007 1-2008 1-2009 1-2010 1-2011 1-2012 1-2013 1-2014 Single Family Condo/TIC/Coop 57.2% 42.7% 76.4% 65.4% 80.6% 68.7% Single Family Condo/TIC/Coop Year to Date 2012 2013 2014 - 2.3% + 29.2% + 0.8% + 14.6% + 53.2% + 5.5% + 33.6% + 5.0% 2012 2013 2014 2012 2013 2014 2012 2013 2014 + 64.7% + 49.3% + 87.3% + 165.5%
- 12. % of List Price Received % of List Price Received SingleFamily Year-Over-YearChange Condo/TIC/ Coop Year-Over-YearChange Oct-2013 110.2% +4.8% 105.5% +1.8% Nov-2013 108.7% +2.2% 105.0% +2.4% Dec-2013 106.8% +2.1% 103.4% +1.8% Jan-2014 107.7% +1.5% 102.9% +1.6% Feb-2014 110.2% +1.7% 106.2% +2.3% Mar-2014 111.8% +1.7% 108.4% +3.3% Apr-2014 115.0% +3.0% 108.2% +2.5% May-2014 115.7% +4.0% 109.1% +3.0% Jun-2014 113.8% +1.2% 108.4% +1.3% Jul-2014 114.1% +4.1% 108.1% +1.2% Aug-2014 111.4% +1.2% 106.4% +0.9% Sep-2014 112.1% +2.1% 105.5% -0.3% 12-Month Avg* 111.6% +2.4% 106.6% +1.7% Historical % of List Price Received by Month Percentage found when dividing a property’s sales price by its most recent list price, then taking the average for all properties sold in a given month, not accounting for seller concessions. * % of List Price Received for all properties from October 2013 through September 2014. This is not the average of the individual figures above. Current as of October 11, 2014. All data from the San Francisco MLS. Powered by 10K Research and Marketing. | Click for Cover Page | 12 106.9% 102.2% 109.8% 105.8% 112.1% 105.5% Single Family Condo/TIC/Coop September 103.9% 101.2% 110.2% 105.5% 112.8% 107.3% Single Family Condo/TIC/Coop Year to Date 95.0% 100.0% 105.0% 110.0% 115.0% 120.0% 1-2005 1-2006 1-2007 1-2008 1-2009 1-2010 1-2011 1-2012 1-2013 1-2014 Single Family Condo/TIC/Coop 2012 2013 2014 - 0.3% + 3.5% + 2.1% + 2.7% 2012 2013 2014 + 6.1% + 4.0% 2012 2013 2014 + 1.7% + 4.2% + 2.4% + 6.1% 2012 2013 2014 + 4.0% + 3.0%
- 13. Housing Affordability Ratio Affordability Ratio SingleFamily Year-Over-YearChange Condo/TIC/ Coop Year-Over-YearChange Oct-2013 51 -15.0% 61 -19.7% Nov-2013 51 -17.7% 67 -10.7% Dec-2013 49 -19.7% 69 -16.9% Jan-2014 48 -28.4% 53 -30.3% Feb-2014 42 -31.1% 54 -28.0% Mar-2014 45 -15.1% 53 -23.2% Apr-2014 40 -20.0% 56 -17.6% May-2014 42 -10.6% 56 -16.4% Jun-2014 39 -18.8% 54 -18.2% Jul-2014 42 -20.8% 55 -9.8% Aug-2014 47 -2.1% 56 -11.1% Sep-2014 43 -12.2% 56 -11.1% 12-Month Avg* 45 -22.0% 55 -20.2% Historical Housing Affordability Ratio by Month This index measures housing affordability for the region. An index of 120 means the median household income is 120% of what is necessary to qualify for the median-priced home under prevailing interest rates. A higher number means greater affordability. * Affordability Ratio for all properties from October 2013 through September 2014. This is not the average of the individual figures above. Current as of October 11, 2014. All data from the San Francisco MLS. Powered by 10K Research and Marketing. | Click for Cover Page | 13 70 75 49 63 43 56 Single Family Condo/TIC/Coop September 30 40 50 60 70 80 90 100 1-2005 1-2006 1-2007 1-2008 1-2009 1-2010 1-2011 1-2012 1-2013 1-2014 Single Family Condo/TIC/Coop 2012 2013 2014 - 11.1% - 16.0% - 12.2% - 30.0% 2012 2013 2014 - 2.8% - 17.6% 68 83 51 64 43 55 Single Family Condo/TIC/Coop Year to Date 2012 2013 2014 - 14.1% - 22.9% - 15.7% - 25.0% 2012 2013 2014 + 1.5% - 1.2%
- 14. Months Supply of Inventory Months Supply SingleFamily Year-Over-YearChange Condo/TIC/ Coop Year-Over-YearChange Oct-2013 2.2 -12.0% 2.3 -17.9% Nov-2013 1.8 -10.0% 1.8 -21.7% Dec-2013 1.3 -13.3% 1.2 -25.0% Jan-2014 1.5 0.0% 1.7 -10.5% Feb-2014 1.5 -16.7% 1.7 -22.7% Mar-2014 1.5 -21.1% 1.7 -26.1% Apr-2014 1.6 -23.8% 1.9 -24.0% May-2014 1.8 -18.2% 2.0 -16.7% Jun-2014 2.0 -4.8% 2.0 -20.0% Jul-2014 2.0 -4.8% 2.1 -8.7% Aug-2014 1.9 -9.5% 1.8 -18.2% Sep-2014 2.2 -4.3% 1.9 -26.9% 12-Month Avg* 1.8 -11.5% 1.8 -19.8% Historical Months Supply of Inventory by Month The inventory of homes for sale at the end of a given month, divided by the average monthly pending sales from the last 12 months. * Months Supply for all properties from October 2013 through September 2014. This is not the average of the individual figures above. Current as of October 11, 2014. All data from the San Francisco MLS. Powered by 10K Research and Marketing. | Click for Cover Page | 14 2.8 3.0 2.3 2.6 2.2 1.9 Single Family Condo/TIC/Coop September 0.0 2.0 4.0 6.0 8.0 10.0 1-2005 1-2006 1-2007 1-2008 1-2009 1-2010 1-2011 1-2012 1-2013 1-2014 Single Family Condo/TIC/Coop 2012 2013 2014 - 26.9% - 13.3% - 4.3% - 17.9% 2012 2013 2014 - 34.9% - 42.3%
- 15. All Properties Activity Overview Key metrics by report month and for year-to-date (YTD) starting from the first of the year. Key Metrics Historical Sparkbars 9-2013 9-2014 Percent Change YTD 2013 YTD 2014 Percent Change Current as of October 11, 2014. All data from the San Francisco MLS. Powered by 10K Research and Marketing. | Click for Cover Page | 15 Months Supply 2.5 2.1 - 16.0% -- -- -- Affordability Ratio 49 45 - 8.8% % of List Price Received 107.6% 108.4% + 0.7% 107.6% 48 73.7% + 4.8% + 1.9% 42 - 12.5% 109.6% % of Properties Sold Over List Price 73.1% 72.4% - 1.0% 70.3% Active Listings 1,229 969 - 21.2% -- Avg. Sales Price $1,073,812 $1,163,077 + 8.3% $1,092,095 Days on Market 34 33 - 2.9% 39 $979,000 + 15.2% + 13.2% 34 - 12.8% $1,235,799 -- -- Sold Listings 417 417 0.0% 4,415 4,077 - 7.7% Median Sales Price $855,000 $975,000 + 14.0% $850,000 - 8.0% Pending Sales 463 469 + 1.3% 4,527 4,212 - 7.0% New Listings 745 687 - 7.8% 5,688 5,231 9-2011 9-2012 9-2013 9-2014 9-2011 9-2012 9-2013 9-2014 9-2011 9-2012 9-2013 9-2014 9-2011 9-2012 9-2013 9-2014 9-2011 9-2012 9-2013 9-2014 9-2011 9-2012 9-2013 9-2014 9-2011 9-2012 9-2013 9-2014 9-2011 9-2012 9-2013 9-2014 9-2011 9-2012 9-2013 9-2014 9-2011 9-2012 9-2013 9-2014 9-2011 9-2012 9-2013 9-2014
- 16. Activity by District SF District 1: Northwest (Sea Cliff, Lake, Jordan Park / Laurel Heights, Outer Richmond, Central Richmond, Inner Richmond, Lone Mountain) SF District 2: Central West (Outer Sunset, Central Sunset, Inner Sunset, Outer Parkside, Parkside, Inner Parkside, Golden Gate Heights) SF District 3: Southwest (Pine Lake Park, Lake Shore, Merced Manor, Stonestown, Lakeside, Merced Heights, Ingleside, Ingleside Heights, Oceanview) SF District 4: Twin Peaks W (Forest Hill (& Ext), W Portal, St Francis Wd, Balboa Terr, Mt Dav Manor, Ingleside Terr, Monterey Hts, Wstwd Pk & H'lnds, Shrwd Fst, Miraloma Pk, Dmnd Hts, Mdtwn Terr) SF District 5: Central (Haight Ashbury, Cole Vly / Prnssus Hts, Clarndn Hts, Corona Hts, Twin Pks, Glen Pk, Noe Vly, Eureka Vly / Dolores Hts, Mission Dolores, Duboce Trngl, Buena Vista / Ashbury Hts) SF District 6: Central North (Lower Pacific Heights, Anza Vista, Western Addition, North Panhandle, Alamo Square, Hayes Valley) SF District 7: North (Marina, Cow Hollow, Presidio Heights, Pacific Heights) SF District 8: Northeast (North Waterfront, North Beach, Russian Hill, Telegraph Hill, Nob Hill, Financial District / Barbary Coast, Downtown, Van Ness / Civic Center, Tenderloin) SF District 9: Central East (Yerba Buena, South Beach, South of Market, Mission Bay, Inner Mission, Potrero Hill, Central Waterfront / Dogpatch, Bernal Heights) SF District 10: Southeast (Outer Mission, Mission Terr, Excelsior, Portola, Bayview, Silver Terr, Hunters Pt, Candlestick Pt, Bayview Hts, Little Hollywood, Visitation Vly, Crocker Amazon) 9-2013 9-2014 + / – 9-2013 9-2014 + / – 9-2013 9-2014 + / – 9-2013 9-2014 + / – 9-2013 9-2014 + / – Single Family 1 SF District 1 39 33 -15.4% 14 20 +42.9% $904,000 $1,342,500 +48.5% 35 24 -31.4% 2.1 1.8 -13.1% 2 SF District 2 91 66 -27.5% 40 37 -7.5% $860,250 $990,000 +15.1% 30 27 -9.2% 2.3 1.8 -23.1% 3 SF District 3 44 36 -18.2% 14 13 -7.1% $767,500 $805,000 +4.9% 22 19 -13.3% 3.0 2.3 -22.1% 4 SF District 4 60 51 -15.0% 22 25 +13.6% $1,300,000 $1,125,000 -13.5% 31 24 -24.1% 2.1 2.0 -3.5% 5 SF District 5 55 57 +3.6% 23 17 -26.1% $1,545,000 $1,790,000 +15.9% 31 23 -27.3% 1.7 2.2 +29.5% 6 SF District 6 10 14 +40.0% 4 1 -75.0% $1,190,000 $2,750,000 +131.1% 39 14 -63.9% 2.3 3.7 +59.5% 7 SF District 7 34 31 -8.8% 8 7 -12.5% $5,475,000 $4,355,000 -20.5% 17 25 +51.0% 2.9 3.0 +4.6% 8 SF District 8 9 8 -11.1% 0 0 -- $0 $0 -- 0 0 -- 3.7 3.7 -0.9% 9 SF District 9 43 42 -2.3% 23 21 -8.7% $1,050,000 $1,160,000 +10.5% 24 28 +18.8% 1.9 2.1 +10.7% 10 SF District 10 121 108 -10.7% 40 43 +7.5% $650,000 $709,000 +9.1% 38 33 -12.5% 2.5 2.5 +1.7% Condo/TIC/Coop 1 SF District 1 32 26 -18.8% 12 25 +108.3% $742,500 $926,666 +24.8% 22 36 +63.4% 2.3 1.9 -17.8% 2 SF District 2 23 13 -43.5% 6 1 -83.3% $850,000 $715,000 -15.9% 33 15 -55.0% 5.0 2.6 -48.2% 3 SF District 3 9 9 0.0% 1 2 +100.0% $785,000 $563,000 -28.3% 20 53 +165.0% 3.5 3.3 -7.4% 4 SF District 4 11 10 -9.1% 1 3 +200.0% $475,000 $600,000 +26.3% 29 32 +9.2% 2.2 2.1 -6.0% 5 SF District 5 79 68 -13.9% 41 33 -19.5% $1,125,000 $1,200,000 +6.7% 32 29 -11.3% 1.8 1.7 -7.5% 6 SF District 6 81 45 -44.4% 26 26 0.0% $814,500 $920,000 +13.0% 35 35 -1.5% 2.8 1.7 -38.9% 7 SF District 7 70 49 -30.0% 20 14 -30.0% $1,300,500 $1,587,500 +22.1% 38 33 -12.4% 2.2 1.9 -13.3% 8 SF District 8 155 91 -41.3% 29 44 +51.7% $820,000 $856,000 +4.4% 33 40 +21.5% 3.5 2.0 -43.6% 9 SF District 9 232 194 -16.4% 88 76 -13.6% $750,000 $902,000 +20.3% 41 39 -6.4% 2.5 1.9 -21.7% 10 SF District 10 31 18 -41.9% 5 9 +80.0% $420,000 $540,000 +28.6% 58 86 +47.2% 5.2 3.5 -32.4% Key metrics by report month for the districts of San Fransisco. Current as of October 11, 2014. All data from the San Francisco MLS. Powered by 10K Research and Marketing. | Click for Cover Page | 16 Active Listings Sold Listings Median Sales Price Days on Market Months Supply