SlideShare a Scribd company logo
1 of 16
Download to read offline
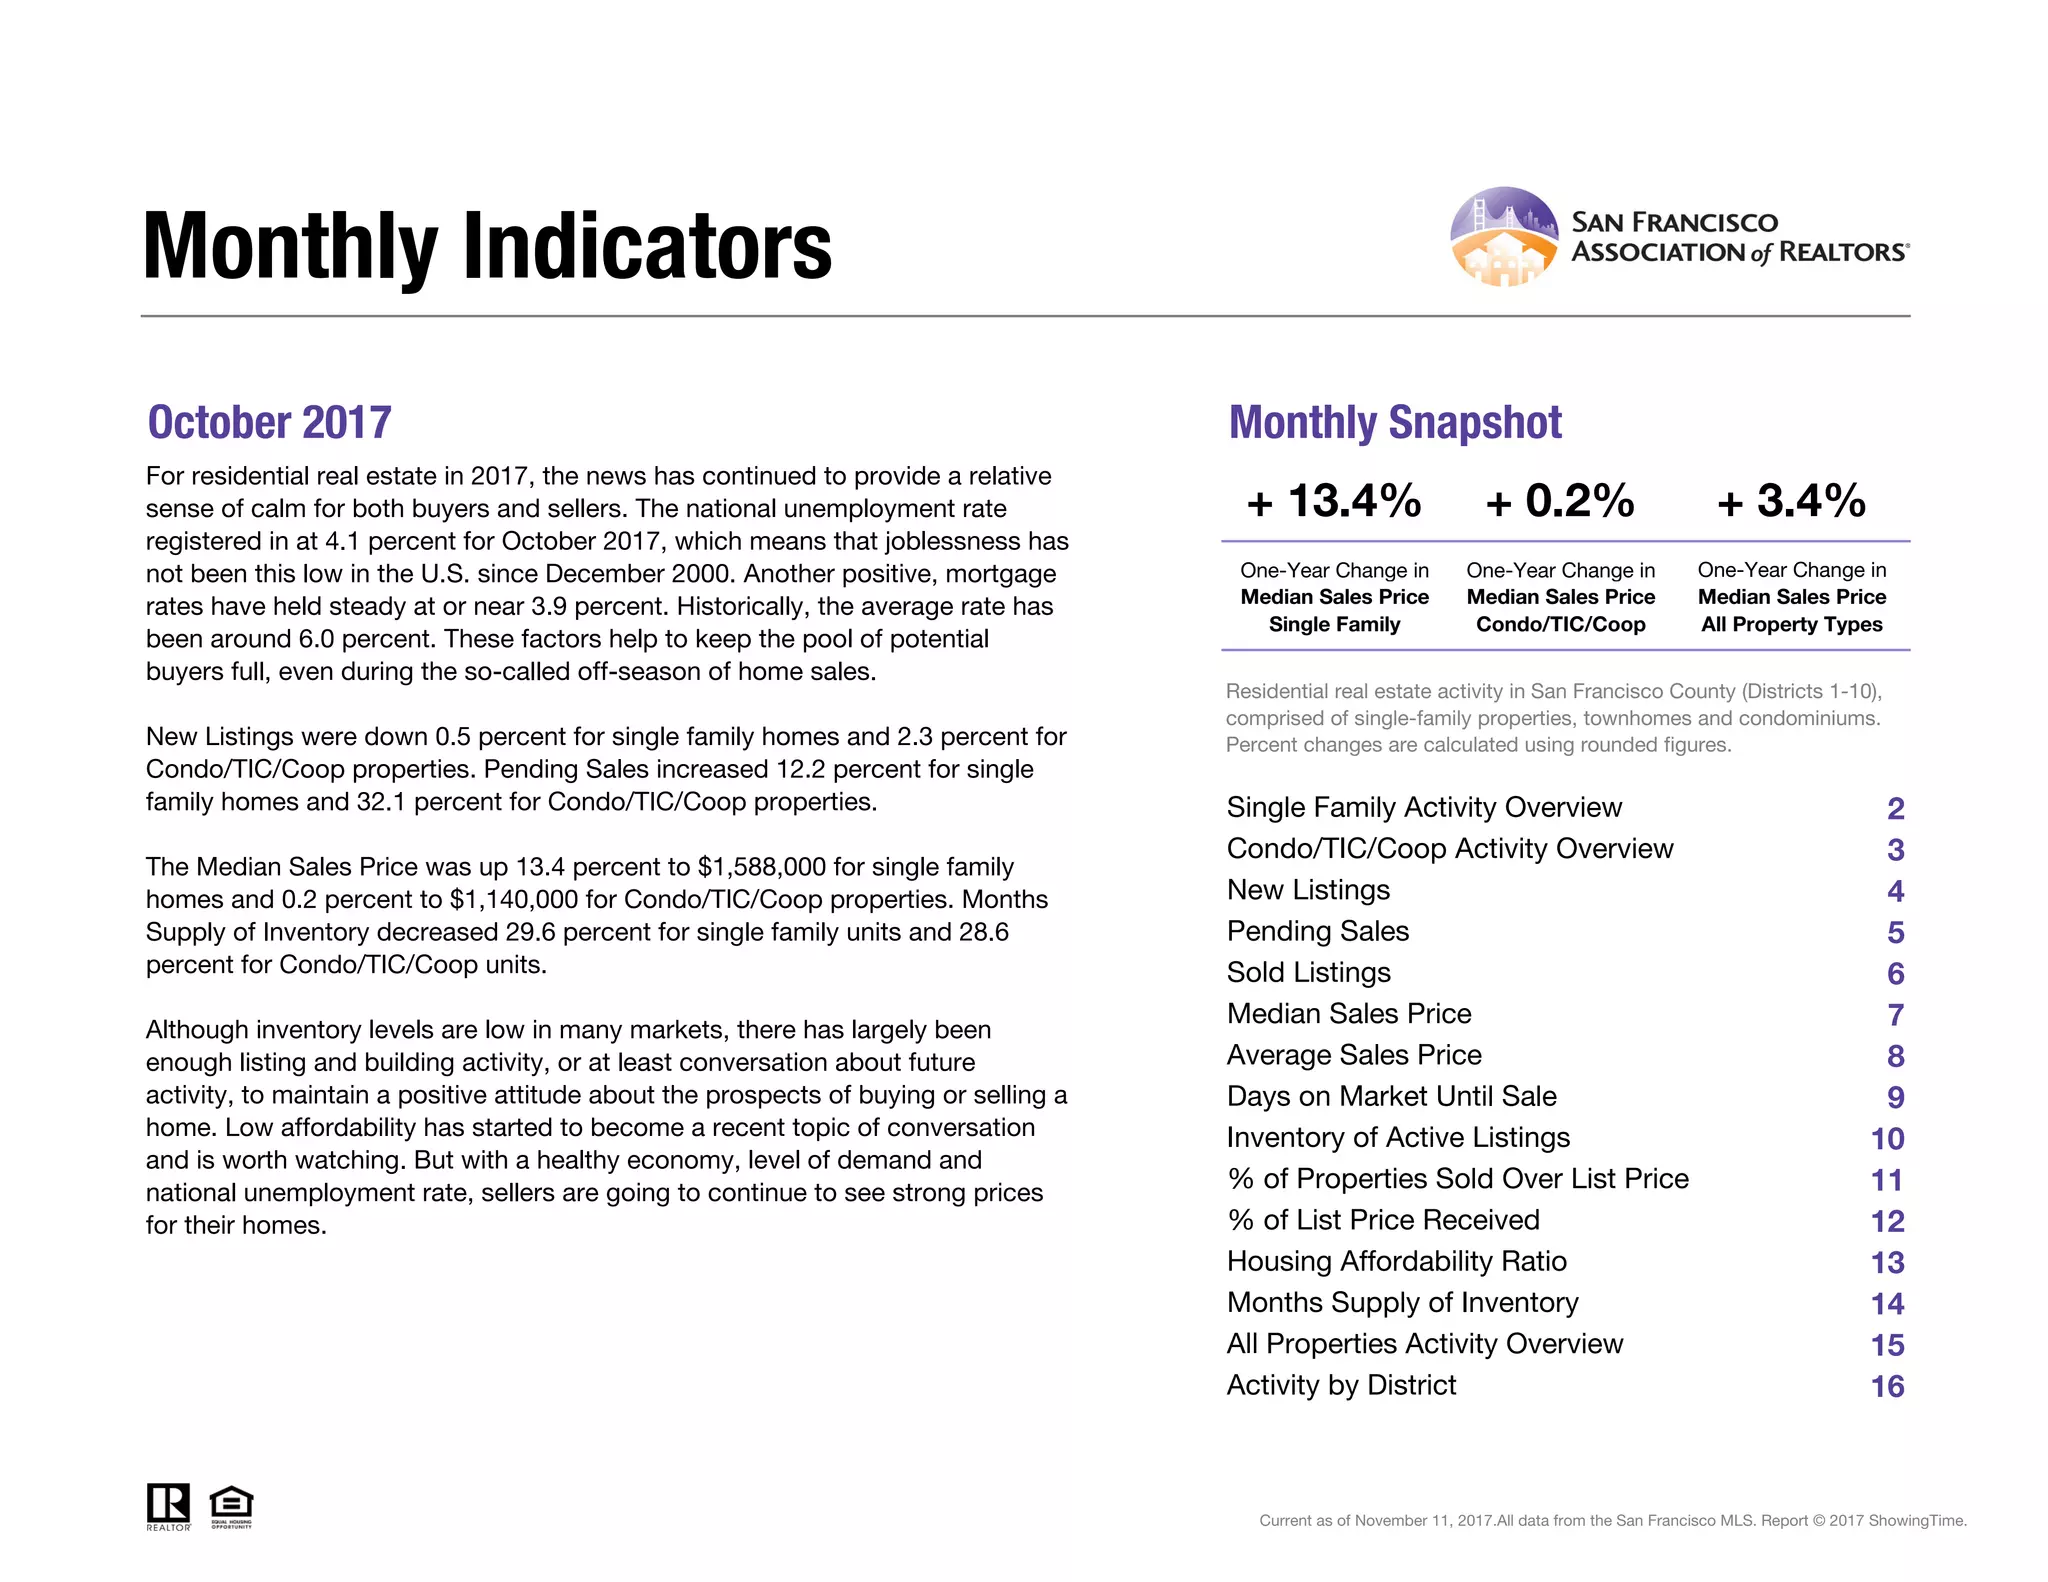
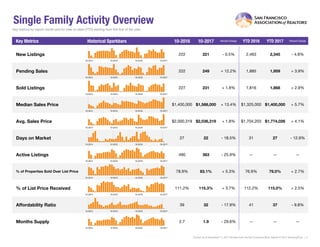
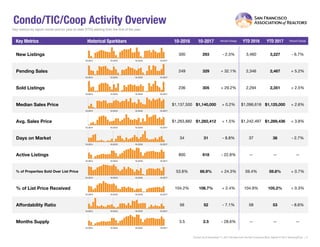
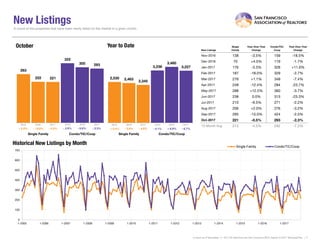
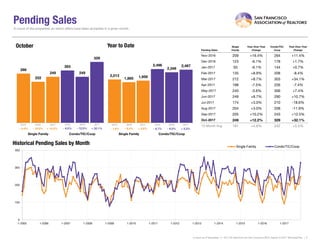
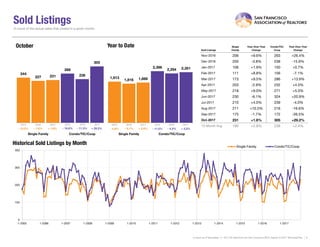
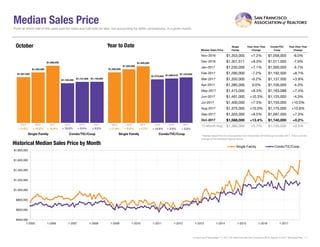
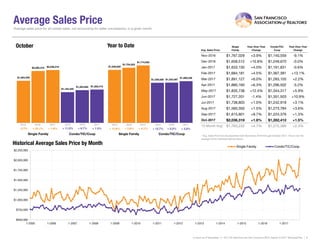
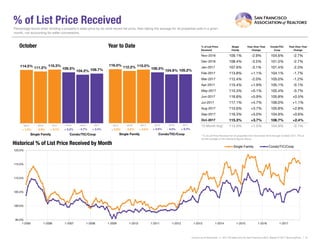
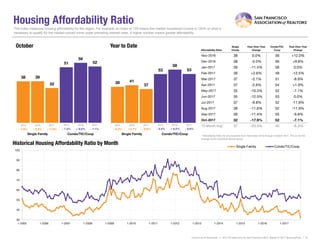
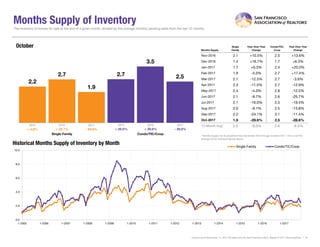
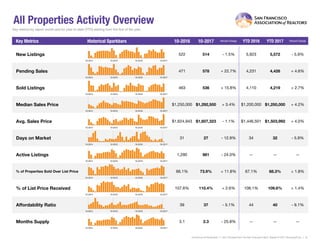
October 2017 Monthly Snapshot
One-Year Change in One-Year Change in
Median Sales Price
Single Family
Median Sales Price
Condo/TIC/Coop
2
3
4
5
6
7
8
9
10
11
12
13
14
15
16
Monthly Indicators
+ 13.4% + 0.2% + 3.4%
One-Year Change in
For residential real estate in 2017, the news has continued to provide a relative
sense of calm for both buyers and sellers. The national unemployment rate
registered in at 4.1 percent for October 2017, which means that joblessness has
not been this low in the U.S. since December 2000. Another positive, mortgage
rates have held steady at or near 3.9 percent. Historically, the average rate has
been around 6.0 percent. These factors help to keep the pool of potential
buyers full, even during the so-called off-season of home sales.
New Listings were down 0.5 percent for single family homes and 2.3 percent for
Condo/TIC/Coop properties. Pending Sales increased 12.2 percent for single
family homes and 32.1 percent for Condo/TIC/Coop properties.
The Median Sales Price was up 13.4 percent to $1,588,000 for single family
homes and 0.2 percent to $1,140,000 for Condo/TIC/Coop properties. Months
Supply of Inventory decreased 29.6 percent for single family units and 28.6
percent for Condo/TIC/Coop units.
Although inventory levels are low in many markets, there has largely been
enough listing and building activity, or at least conversation about future
activity, to maintain a positive attitude about the prospects of buying or selling a
home. Low affordability has started to become a recent topic of conversation
and is worth watching. But with a healthy economy, level of demand and
national unemployment rate, sellers are going to continue to see strong prices
for their homes.
Median Sales Price
All Property Types
Residential real estate activity in San Francisco County (Districts 1-10),
comprised of single-family properties, townhomes and condominiums.
Percent changes are calculated using rounded figures.
Single Family Activity Overview
Months Supply of Inventory
Current as of November 11, 2017.All data from the San Francisco MLS. Report © 2017 ShowingTime.
Condo/TIC/Coop Activity Overview
Inventory of Active Listings
% of Properties Sold Over List Price
% of List Price Received
Housing Affordability Ratio
All Properties Activity Overview
New Listings
Pending Sales
Sold Listings
Median Sales Price
Average Sales Price
Days on Market Until Sale
Activity by District
Single Family Activity Overview
Key metrics by report month and for year-to-date (YTD) starting from the first of the year.
Key Metrics Historical Sparkbars 10-2016 10-2017 Percent Change YTD 2016 YTD 2017 Percent Change
Current as of November 11, 2017.All data from the San Francisco MLS. Report © 2017 ShowingTime. | 2
Months Supply 2.7 1.9 - 29.6% -- -- --
Affordability Ratio 39 32 - 17.9%
% of List Price Received 111.2% 115.3% + 3.7% 112.2%
41
79.0% + 2.7%
+ 2.5%
37 - 9.8%
115.0%
% of Properties Sold Over List Price 78.9% 83.1% + 5.3% 76.9%
Active Listings 490 363 - 25.9% --
Avg. Sales Price $2,000,319 $2,036,319 + 1.8% $1,704,203
Days on Market 27 22 - 18.5% 31 27 - 12.9%
$1,774,026
-- --
Median Sales Price $1,400,000 $1,588,000 + 13.4% $1,325,000
Sold Listings 227 231 + 1.8% 1,816
New Listings 222 221 - 0.5% 2,463
Pending Sales 222 249 + 12.2% + 3.9%1,885 1,959
- 4.8%2,345
1,868 + 2.9%
$1,400,000 + 5.7%
+ 4.1%
10-2014 10-2015 10-2016 10-2017
10-2014 10-2015 10-2016 10-2017
10-2014 10-2015 10-2016 10-2017
10-2014 10-2015 10-2016 10-2017
10-2014 10-2015 10-2016 10-2017
10-2014 10-2015 10-2016 10-2017
10-2014 10-2015 10-2016 10-2017
10-2014 10-2015 10-2016 10-2017
10-2014 10-2015 10-2016 10-2017
10-2014 10-2015 10-2016 10-2017
10-2014 10-2015 10-2016 10-2017
Condo/TIC/Coop Activity Overview
Key metrics by report month and for year-to-date (YTD) starting from the first of the year.
Key Metrics Historical Sparkbars 10-2016 10-2017 Percent Change YTD 2016 YTD 2017 Percent Change
Current as of November 11, 2017.All data from the San Francisco MLS. Report © 2017 ShowingTime. | 3
Months Supply 3.5 2.5 - 28.6% -- -- --
Affordability Ratio 56 52 - 7.1%
% of List Price Received 104.2% 106.7% + 2.4% 104.9%
58
59.8% + 0.7%
+ 0.3%
53 - 8.6%
105.2%
% of Properties Sold Over List Price 53.8% 66.9% + 24.3% 59.4%
Active Listings 800 618 - 22.8% --
Avg. Sales Price $1,263,882 $1,282,412 + 1.5% $1,242,497
Days on Market 34 31 - 8.8% 37
$1,125,000 + 2.6%
+ 3.8%
36 - 2.7%
$1,289,436
-- --
Sold Listings 236 305 + 29.2% 2,294 2,351 + 2.5%
Median Sales Price $1,137,500 $1,140,000 + 0.2% $1,096,618
- 6.7%
Pending Sales 249 329 + 32.1% 2,346 2,467 + 5.2%
New Listings 300 293 - 2.3% 3,460 3,227
10-2014 10-2015 10-2016 10-2017
10-2014 10-2015 10-2016 10-2017
10-2014 10-2015 10-2016 10-2017
10-2014 10-2015 10-2016 10-2017
10-2014 10-2015 10-2016 10-2017
10-2014 10-2015 10-2016 10-2017
10-2014 10-2015 10-2016 10-2017
10-2014 10-2015 10-2016 10-2017
10-2014 10-2015 10-2016 10-2017
10-2014 10-2015 10-2016 10-2017
10-2014 10-2015 10-2016 10-2017
New Listings
New Listings
Single
Family
Year-Over-Year
Change
Condo/TIC/
Coop
Year-Over-Year
Change
Nov-2016 138 -3.5% 159 -18.5%
Dec-2016 70 +4.5% 119 -1.7%
Jan-2017 176 -3.3% 328 +11.6%
Feb-2017 187 -18.0% 329 -2.7%
Mar-2017 276 +1.1% 349 -7.4%
Apr-2017 248 -12.4% 284 -23.7%
May-2017 288 +12.5% 360 -3.7%
Jun-2017 238 0.0% 313 -23.3%
Jul-2017 210 -9.5% 271 -2.2%
Aug-2017 206 +2.0% 276 -3.2%
Sep-2017 295 -15.0% 424 -2.5%
Oct-2017 221 -0.5% 293 -2.3%
12-Month Avg 213 -4.5% 292 -7.2%
Historical New Listings by Month
Current as of November 11, 2017.All data from the San Francisco MLS. Report © 2017 ShowingTime. | 4
A count of the properties that have been newly listed on the market in a given month.
263
322
222
300
221
293
Single Family Condo/TIC/Coop
October
0
100
200
300
400
500
600
700
1-2005 1-2006 1-2007 1-2008 1-2009 1-2010 1-2011 1-2012 1-2013 1-2014 1-2015 1-2016 1-2017
Single Family Condo/TIC/Coop
2,530
3,238
2,463
3,460
2,345
3,227
Single Family Condo/TIC/Coop
Year to Date
2015 2016 2017
- 2.3%- 6.8%- 0.5%- 15.6% + 6.9%- 4.8%- 2.6% - 6.7%
2015 2016 2017 2015 2016 2017 2015 2016 2017
+ 5.2% + 0.4% - 4.1%- 3.9%
Pending Sales
Pending Sales
Single
Family
Year-Over-Year
Change
Condo/TIC/
Coop
Year-Over-Year
Change
Nov-2016 209 +19.4% 264 +11.4%
Dec-2016 123 -6.1% 178 +1.7%
Jan-2017 93 -6.1% 144 +0.7%
Feb-2017 135 +8.9% 208 -8.4%
Mar-2017 212 +8.7% 303 +34.1%
Apr-2017 198 -7.5% 226 -7.4%
May-2017 240 -3.6% 306 +7.4%
Jun-2017 249 +8.7% 290 +10.7%
Jul-2017 174 +3.0% 210 -18.6%
Aug-2017 204 +3.0% 208 -11.9%
Sep-2017 205 +10.2% 243 +12.5%
Oct-2017 249 +12.2% 329 +32.1%
12-Month Avg 191 +4.6% 242 +5.5%
Historical Pending Sales by Month
A count of the properties on which offers have been accepted in a given month.
Current as of November 11, 2017.All data from the San Francisco MLS. Report © 2017 ShowingTime. | 5
266
283
222
249249
329
Single Family Condo/TIC/Coop
October
0
100
200
300
400
1-2005 1-2006 1-2007 1-2008 1-2009 1-2010 1-2011 1-2012 1-2013 1-2014 1-2015 1-2016 1-2017
Single Family Condo/TIC/Coop
2,013
2,496
1,885
2,346
1,959
2,467
Single Family Condo/TIC/Coop
Year to Date
2015 2016 2017
+ 32.1%- 12.0%+ 12.2%- 16.5% - 6.0%+ 3.9%- 6.4% + 5.2%
2015 2016 2017 2015 2016 2017 2015 2016 2017
- 0.4% - 1.6% - 8.7%- 6.0%
Sold Listings
Sold Listings
Single
Family
Year-Over-Year
Change
Condo/TIC/
Coop
Year-Over-Year
Change
Nov-2016 206 +9.6% 263 +26.4%
Dec-2016 200 -3.8% 238 -15.9%
Jan-2017 106 +1.9% 150 +0.7%
Feb-2017 111 +8.8% 156 -7.1%
Mar-2017 173 +9.5% 286 +13.9%
Apr-2017 203 -2.9% 232 +4.5%
May-2017 218 +9.0% 271 +5.0%
Jun-2017 230 -6.1% 324 +20.9%
Jul-2017 210 +4.0% 239 -4.0%
Aug-2017 211 +10.5% 216 -16.6%
Sep-2017 175 -1.7% 172 -26.5%
Oct-2017 231 +1.8% 305 +29.2%
12-Month Avg 190 +2.8% 238 +2.4%
Historical Sold Listings by Month
A count of the actual sales that closed in a given month.
Current as of November 11, 2017.All data from the San Francisco MLS. Report © 2017 ShowingTime. | 6
244
266
227 236231
305
Single Family Condo/TIC/Coop
October
0
100
200
300
400
1-2005 1-2006 1-2007 1-2008 1-2009 1-2010 1-2011 1-2012 1-2013 1-2014 1-2015 1-2016 1-2017
Single Family Condo/TIC/Coop
1,913
2,396
1,816
2,294
1,868
2,351
Single Family Condo/TIC/Coop
Year to Date
2015 2016 2017
+ 29.2%- 11.3%+ 1.8%- 7.0% - 4.3%+ 2.9%- 5.1% + 2.5%
2015 2016 2017 2015 2016 2017 2015 2016 2017
- 12.2% - 4.8% - 11.5%- 16.6%
Median Sales Price
Median Sales Price
Single
Family
Year-Over-Year
Change
Condo/TIC/
Coop
Year-Over-Year
Change
Nov-2016 $1,353,000 +7.2% $1,058,000 -6.0%
Dec-2016 $1,301,511 +8.3% $1,011,000 -7.9%
Jan-2017 $1,250,000 +7.1% $1,000,000 -5.7%
Feb-2017 $1,290,000 -7.2% $1,192,500 +8.7%
Mar-2017 $1,350,000 -0.2% $1,137,500 +3.9%
Apr-2017 $1,380,000 0.0% $1,100,000 -4.3%
May-2017 $1,475,000 +9.3% $1,163,088 +7.4%
Jun-2017 $1,461,000 +10.3% $1,125,000 -4.3%
Jul-2017 $1,400,000 +7.3% $1,150,000 +10.0%
Aug-2017 $1,375,000 +10.0% $1,175,000 +10.8%
Sep-2017 $1,320,000 +8.5% $1,097,500 +7.3%
Oct-2017 $1,588,000 +13.4% $1,140,000 +0.2%
12-Month Avg* $1,380,000 +5.7% $1,105,500 +0.5%
Historical Median Sales Price by Month
Point at which half of the sales sold for more and half sold for less, not accounting for seller concessions, in a given month.
* Median Sales Price for all properties from November 2016 through October 2017. This is not the
average of the individual figures above.
Current as of November 11, 2017.All data from the San Francisco MLS. Report © 2017 ShowingTime. | 7
$1,267,500
$1,100,000
$1,400,000
$1,137,500
$1,588,000
$1,140,000
Single Family Condo/TIC/Coop
October
$400,000
$600,000
$800,000
$1,000,000
$1,200,000
$1,400,000
$1,600,000
$1,800,000
1-2005 1-2006 1-2007 1-2008 1-2009 1-2010 1-2011 1-2012 1-2013 1-2014 1-2015 1-2016 1-2017
Single Family Condo/TIC/Coop
$1,250,000
$1,075,000
$1,325,000
$1,096,618
$1,400,000
$1,125,000
Single Family Condo/TIC/Coop
Year to Date
2015 2016 2017
+ 0.2%+ 3.4%+ 13.4%+ 10.5% + 2.0%+ 5.7%+ 6.0% + 2.6%
2015 2016 2017 2015 2016 2017 2015 2016 2017
+ 6.5% + 17.9% + 14.6%+ 15.2%
Average Sales Price
Avg. Sales Price
Single
Family
Year-Over-Year
Change
Condo/TIC/
Coop
Year-Over-Year
Change
Nov-2016 $1,767,029 +3.9% $1,140,559 -9.1%
Dec-2016 $1,658,512 +10.8% $1,249,670 -0.0%
Jan-2017 $1,633,150 +4.0% $1,161,831 -0.6%
Feb-2017 $1,684,181 +4.5% $1,367,391 +13.1%
Mar-2017 $1,891,127 +6.0% $1,283,105 +2.2%
Apr-2017 $1,880,160 +6.3% $1,296,502 -5.2%
May-2017 $1,835,738 +12.4% $1,344,317 +5.9%
Jun-2017 $1,727,201 -1.4% $1,351,503 +10.9%
Jul-2017 $1,738,803 +1.0% $1,242,918 +3.1%
Aug-2017 $1,560,350 +1.5% $1,273,784 +3.6%
Sep-2017 $1,615,801 +8.7% $1,224,376 +1.3%
Oct-2017 $2,036,319 +1.8% $1,282,412 +1.5%
12-Month Avg* $1,763,232 +4.7% $1,272,389 +2.3%
Historical Average Sales Price by Month
Average sales price for all closed sales, not accounting for seller concessions, in a given month.
* Avg. Sales Price for all properties from November 2016 through October 2017. This is not the
average of the individual figures above.
Current as of November 11, 2017.All data from the San Francisco MLS. Report © 2017 ShowingTime. | 8
$1,624,546
$1,184,400
$2,000,319
$1,263,882
$2,036,319
$1,282,412
Single Family Condo/TIC/Coop
October
$500,000
$750,000
$1,000,000
$1,250,000
$1,500,000
$1,750,000
$2,000,000
$2,250,000
1-2005 1-2006 1-2007 1-2008 1-2009 1-2010 1-2011 1-2012 1-2013 1-2014 1-2015 1-2016 1-2017
Single Family Condo/TIC/Coop
$1,639,820
$1,239,508
$1,704,203
$1,242,497
$1,774,026
$1,289,436
Single Family Condo/TIC/Coop
Year to Date
2015 2016 2017
+ 1.5%+ 6.7%+ 1.8%+ 23.1% + 0.2%+ 4.1%+ 3.9% + 3.8%
2015 2016 2017 2015 2016 2017 2015 2016 2017
- 2.7% + 12.9% + 13.7%+ 11.0%
Days on Market Until Sale
Days on Market
Single
Family
Year-Over-Year
Change
Condo/TIC/
Coop
Year-Over-Year
Change
Nov-2016 38 +35.7% 40 +17.6%
Dec-2016 41 +24.2% 48 +11.6%
Jan-2017 42 +5.0% 59 +34.1%
Feb-2017 34 +9.7% 36 +2.9%
Mar-2017 31 +24.0% 32 +6.7%
Apr-2017 26 -18.8% 32 -15.8%
May-2017 24 -7.7% 33 0.0%
Jun-2017 27 -6.9% 37 +5.7%
Jul-2017 24 -25.0% 33 -15.4%
Aug-2017 27 -18.2% 40 -13.0%
Sep-2017 28 -31.7% 43 +7.5%
Oct-2017 22 -18.5% 31 -8.8%
12-Month Avg* 29 -5.0% 38 +0.2%
Historical Days on Market Until Sale by Month
Average number of days between when a property is listed and when an offer is accepted in a given month.
* Days on Market for all properties from November 2016 through October 2017. This is not the
average of the individual figures above.
Current as of November 11, 2017.All data from the San Francisco MLS. Report © 2017 ShowingTime. | 9
27 2627
34
22
31
Single Family Condo/TIC/Coop
October
20
40
60
80
100
120
1-2005 1-2006 1-2007 1-2008 1-2009 1-2010 1-2011 1-2012 1-2013 1-2014 1-2015 1-2016 1-2017
Single Family Condo/TIC/Coop
27
3031
37
27
36
Single Family Condo/TIC/Coop
Year to Date
2015 2016 2017
- 8.8%+ 30.8%- 18.5%0.0% + 23.3%- 12.9%+ 14.8% - 2.7%
2015 2016 2017 2015 2016 2017 2015 2016 2017
- 10.0% - 10.0% - 11.8%- 29.7%
Inventory of Active Listings
Active Listings
Single
Family
Year-Over-Year
Change
Condo/TIC/
Coop
Year-Over-Year
Change
Nov-2016 383 +5.5% 591 +8.8%
Dec-2016 260 +13.0% 405 +7.7%
Jan-2017 322 +7.7% 555 +12.1%
Feb-2017 358 -7.5% 629 +13.1%
Mar-2017 392 -12.5% 633 -3.5%
Apr-2017 421 -13.4% 645 -11.0%
May-2017 436 -6.6% 660 -11.6%
Jun-2017 393 -11.1% 615 -23.5%
Jul-2017 396 -14.5% 600 -16.8%
Aug-2017 367 -11.8% 591 -13.5%
Sep-2017 421 -20.7% 723 -12.4%
Oct-2017 363 -25.9% 618 -22.8%
12-Month Avg* 376 -10.2% 605 -8.4%
Historical Inventory of Active Listings by Month
The number of properties available for sale in active status at the end of a given month.
* Active Listings for all properties from November 2016 through October 2017. This is not the
average of the individual figures above.
Current as of November 11, 2017.All data from the San Francisco MLS. Report © 2017 ShowingTime. | 10
441
656
490
800
363
618
Single Family Condo/TIC/Coop
October
200
400
600
800
1,000
1,200
1,400
1,600
1-2005 1-2006 1-2007 1-2008 1-2009 1-2010 1-2011 1-2012 1-2013 1-2014 1-2015 1-2016 1-2017
Single Family Condo/TIC/Coop
2015 2016 2017
- 22.8%+ 22.0%- 25.9%+ 11.1%
2015 2016 2017
+ 2.3% + 16.1%
% of Properties Sold Over List Price
% of Properties
Sold Over List Price
Single
Family
Year-Over-Year
Change
Condo/TIC/
Coop
Year-Over-Year
Change
Nov-2016 72.8% -6.3% 63.1% -8.8%
Dec-2016 69.0% -13.0% 42.0% -29.3%
Jan-2017 62.3% -18.0% 38.7% -27.0%
Feb-2017 78.4% +1.2% 58.3% 0.0%
Mar-2017 74.6% -9.4% 62.2% -8.1%
Apr-2017 77.3% +2.2% 62.1% +2.8%
May-2017 78.9% -0.8% 61.3% -9.1%
Jun-2017 80.0% +11.4% 58.6% -6.5%
Jul-2017 81.4% +6.8% 62.8% +7.2%
Aug-2017 79.1% +4.2% 61.6% +23.7%
Sep-2017 86.3% +11.4% 53.5% -8.5%
Oct-2017 83.1% +5.3% 66.9% +24.3%
12-Month Avg 77.6% +0.5% 58.6% -2.5%
Historical % of Properties Sold Over List Price by Month
Percentage found when dividing the number of properties sold by properties sold over its original list price, not accounting for seller
concessions.
* % of Properties Sold Over List Price for all properties from November 2016 through October
2017. This is not the average of the individual figures above.
Current as of November 11, 2017.All data from the San Francisco MLS. Report © 2017 ShowingTime. | 11
83.2%
76.3%78.9%
53.8%
83.1%
66.9%
Single Family Condo/TIC/Coop
October
0.0%
20.0%
40.0%
60.0%
80.0%
100.0%
1-2005 1-2006 1-2007 1-2008 1-2009 1-2010 1-2011 1-2012 1-2013 1-2014 1-2015 1-2016 1-2017
Single Family Condo/TIC/Coop
83.1%
71.7%
76.9%
59.4%
79.0%
59.8%
Single Family Condo/TIC/Coop
Year to Date
2015 2016 2017
+ 24.3%- 29.5%+ 5.3%- 5.2% - 17.2%+ 2.7%- 7.5% + 0.7%
2015 2016 2017 2015 2016 2017 2015 2016 2017
+ 1.0% + 3.1% + 4.4%+ 10.1%
% of List Price Received
% of List Price
Received
Single
Family
Year-Over-Year
Change
Condo/TIC/
Coop
Year-Over-Year
Change
Nov-2016 109.1% -2.9% 104.6% -2.7%
Dec-2016 108.4% -3.5% 101.5% -2.7%
Jan-2017 107.6% -3.1% 101.4% -2.3%
Feb-2017 113.8% +1.1% 104.1% -1.7%
Mar-2017 112.4% -2.0% 105.0% -1.2%
Apr-2017 115.4% +1.9% 105.1% -0.1%
May-2017 115.3% +0.1% 105.4% -0.7%
Jun-2017 116.8% +5.9% 105.8% +0.5%
Jul-2017 117.1% +4.7% 106.0% +1.1%
Aug-2017 115.6% +3.7% 105.8% +2.8%
Sep-2017 116.3% +5.0% 104.9% +0.6%
Oct-2017 115.3% +3.7% 106.7% +2.4%
12-Month Avg* 113.9% +1.5% 104.9% -0.1%
Historical % of List Price Received by Month
Percentage found when dividing a property’s sales price by its most recent list price, then taking the average for all properties sold in a given
month, not accounting for seller concessions.
* % of List Price Received for all properties from November 2016 through October 2017. This is
not the average of the individual figures above.
Current as of November 11, 2017.All data from the San Francisco MLS. Report © 2017 ShowingTime. | 12
114.5%
109.3%111.2%
104.2%
115.3%
106.7%
Single Family Condo/TIC/Coop
October
116.0%
109.3%112.2%
104.9%
115.0%
105.2%
Single Family Condo/TIC/Coop
Year to Date
95.0%
100.0%
105.0%
110.0%
115.0%
120.0%
1-2005 1-2006 1-2007 1-2008 1-2009 1-2010 1-2011 1-2012 1-2013 1-2014 1-2015 1-2016 1-2017
Single Family Condo/TIC/Coop
2015 2016 2017
+ 2.4%- 4.7%+ 3.7%- 2.9%
2015 2016 2017
+ 1.3% + 2.2%
2015 2016 2017
+ 0.3%- 4.0%+ 2.5%- 3.3%
2015 2016 2017
+ 2.9% + 2.0%
Housing Affordability Ratio
Affordability Ratio
Single
Family
Year-Over-Year
Change
Condo/TIC/
Coop
Year-Over-Year
Change
Nov-2016 38 0.0% 56 +12.0%
Dec-2016 38 -5.0% 56 +9.8%
Jan-2017 39 -11.4% 56 0.0%
Feb-2017 39 +2.6% 49 -12.5%
Mar-2017 37 -5.1% 51 -8.9%
Apr-2017 37 -2.6% 54 +1.9%
May-2017 35 -10.3% 52 -7.1%
Jun-2017 35 -12.5% 53 0.0%
Jul-2017 37 -9.8% 52 -11.9%
Aug-2017 38 -11.6% 52 -11.9%
Sep-2017 39 -11.4% 55 -9.8%
Oct-2017 32 -17.9% 52 -7.1%
12-Month Avg* 37 -20.3% 40 -6.3%
Historical Housing Affordability Ratio by Month
This index measures housing affordability for the region. For example, an index of 120 means the median household income is 120% of what is
necessary to qualify for the median-priced home under prevailing interest rates. A higher number means greater affordability.
* Affordability Ratio for all properties from November 2016 through October 2017. This is not the
average of the individual figures above.
Current as of November 11, 2017.All data from the San Francisco MLS. Report © 2017 ShowingTime. | 13
38
51
39
56
32
52
Single Family Condo/TIC/Coop
October
30
40
50
60
70
80
90
100
1-2005 1-2006 1-2007 1-2008 1-2009 1-2010 1-2011 1-2012 1-2013 1-2014 1-2015 1-2016 1-2017
Single Family Condo/TIC/Coop
2015 2016 2017
- 7.1%+ 9.8%- 17.9%+ 2.6%
2015 2016 2017
- 2.6% - 7.3%
39
53
41
58
37
53
Single Family Condo/TIC/Coop
Year to Date
2015 2016 2017
- 8.6%+ 9.4%- 9.8%+ 5.1%
2015 2016 2017
- 9.3% - 5.4%
Months Supply of Inventory
Months Supply
Single
Family
Year-Over-Year
Change
Condo/TIC/
Coop
Year-Over-Year
Change
Nov-2016 2.1 +10.5% 2.5 +13.6%
Dec-2016 1.4 +16.7% 1.7 +6.3%
Jan-2017 1.7 +6.3% 2.4 +20.0%
Feb-2017 1.9 -5.0% 2.7 +17.4%
Mar-2017 2.1 -12.5% 2.7 -3.6%
Apr-2017 2.3 -11.5% 2.7 -12.9%
May-2017 2.4 -4.0% 2.8 -12.5%
Jun-2017 2.1 -8.7% 2.6 -25.7%
Jul-2017 2.1 -16.0% 2.5 -19.4%
Aug-2017 2.0 -9.1% 2.5 -13.8%
Sep-2017 2.2 -24.1% 3.1 -11.4%
Oct-2017 1.9 -29.6% 2.5 -28.6%
12-Month Avg* 2.0 -9.0% 2.6 -8.5%
Historical Months Supply of Inventory by Month
The inventory of homes for sale at the end of a given month, divided by the average monthly pending sales from the last 12 months.
* Months Supply for all properties from November 2016 through October 2017. This is not the
average of the individual figures above.
Current as of November 11, 2017.All data from the San Francisco MLS. Report © 2017 ShowingTime. | 14
2.2
2.72.7
3.5
1.9
2.5
Single Family Condo/TIC/Coop
October
0.0
2.0
4.0
6.0
8.0
10.0
1-2005 1-2006 1-2007 1-2008 1-2009 1-2010 1-2011 1-2012 1-2013 1-2014 1-2015 1-2016 1-2017
Single Family Condo/TIC/Coop
2015 2016 2017
- 28.6%+ 29.6%- 29.6%+ 22.7%
2015 2016 2017
+ 4.8% + 28.6%
All Properties Activity Overview
Key metrics by report month and for year-to-date (YTD) starting from the first of the year.
Key Metrics Historical Sparkbars 10-2016 10-2017 Percent Change YTD 2016 YTD 2017 Percent Change
Current as of November 11, 2017.All data from the San Francisco MLS. Report © 2017 ShowingTime. | 15
Months Supply 3.1 2.3 - 25.8% -- -- --
Affordability Ratio 39 37 - 5.1%
% of List Price Received 107.6% 110.4% + 2.6% 108.1%
44
68.3% + 1.8%
+ 1.4%
40 - 9.1%
109.6%
% of Properties Sold Over List Price 66.1% 73.9% + 11.8% 67.1%
Active Listings 1,290 981 - 24.0% --
Avg. Sales Price $1,624,943 $1,607,323 - 1.1% $1,446,501
Days on Market 31 27 - 12.9% 34
$1,250,000 + 4.2%
+ 4.0%
32 - 5.9%
$1,503,992
-- --
Sold Listings 463 536 + 15.8% 4,110 4,219 + 2.7%
Median Sales Price $1,250,000 $1,292,500 + 3.4% $1,200,000
- 5.9%
Pending Sales 471 578 + 22.7% 4,231 4,426 + 4.6%
New Listings 522 514 - 1.5% 5,923 5,572
10-2014 10-2015 10-2016 10-2017
10-2014 10-2015 10-2016 10-2017
10-2014 10-2015 10-2016 10-2017
10-2014 10-2015 10-2016 10-2017
10-2014 10-2015 10-2016 10-2017
10-2014 10-2015 10-2016 10-2017
10-2014 10-2015 10-2016 10-2017
10-2014 10-2015 10-2016 10-2017
10-2014 10-2015 10-2016 10-2017
10-2014 10-2015 10-2016 10-2017
10-2014 10-2015 10-2016 10-2017
Activity by District
SF District 1: Northwest (Sea Cliff, Lake, Jordan Park / Laurel Heights, Outer Richmond, Central Richmond, Inner Richmond, Lone Mountain)
SF District 2: Central West (Outer Sunset, Central Sunset, Inner Sunset, Outer Parkside, Parkside, Inner Parkside, Golden Gate Heights)
SF District 3: Southwest (Pine Lake Park, Lake Shore, Merced Manor, Stonestown, Lakeside, Merced Heights, Ingleside, Ingleside Heights, Oceanview)
SF District 4: Twin Peaks W (Forest Hill (& Ext), W Portal, St Francis Wd, Balboa Terr, Mt Dav Manor, Ingleside Terr, Monterey Hts, Wstwd Pk & H'lnds, Shrwd Fst, Miraloma Pk, Dmnd Hts, Mdtwn Terr)
SF District 5: Central (Haight Ashbury, Cole Vly / Prnssus Hts, Clarndn Hts, Corona Hts, Twin Pks, Glen Pk, Noe Vly, Eureka Vly / Dolores Hts, Mission Dolores, Duboce Trngl, Buena Vista / Ashbury Hts)
SF District 6: Central North (Lower Pacific Heights, Anza Vista, Western Addition, North Panhandle, Alamo Square, Hayes Valley)
SF District 7: North (Marina, Cow Hollow, Presidio Heights, Pacific Heights)
SF District 8: Northeast (North Waterfront, North Beach, Russian Hill, Telegraph Hill, Nob Hill, Financial District / Barbary Coast, Downtown, Van Ness / Civic Center, Tenderloin)
SF District 9: Central East (Yerba Buena, South Beach, South of Market, Mission Bay, Inner Mission, Potrero Hill, Central Waterfront / Dogpatch, Bernal Heights)
SF District 10: Southeast (Outer Mission, Mission Terr, Excelsior, Portola, Bayview, Silver Terr, Hunters Pt, Candlestick Pt, Bayview Hts, Little Hollywood, Visitation Vly, Crocker Amazon)
10-2016 10-2017 + / – 10-2016 10-2017 + / – 10-2016 10-2017 + / – 10-2016 10-2017 + / – 10-2016 10-2017 + / –
Single Family
1 SF District 1 42 22 -47.6% 21 21 0.0% $1,811,410 $1,825,000 +0.8% 19 19 0.0% 3.0 1.6 -46.7%
2 SF District 2 53 35 -34.0% 37 30 -18.9% $1,200,000 $1,537,500 +28.1% 25 19 -24.0% 1.6 1.0 -37.5%
3 SF District 3 33 20 -39.4% 20 17 -15.0% $925,000 $1,015,000 +9.7% 27 35 +29.6% 2.1 1.4 -33.3%
4 SF District 4 54 42 -22.2% 30 29 -3.3% $1,462,500 $1,650,000 +12.8% 26 16 -38.5% 2.1 1.6 -23.8%
5 SF District 5 88 52 -40.9% 35 37 +5.7% $2,200,000 $2,250,000 +2.3% 24 23 -4.2% 3.5 1.9 -45.7%
6 SF District 6 10 14 +40.0% 10 6 -40.0% $2,350,000 $2,563,000 +9.1% 20 11 -45.0% 3.2 4.8 +50.0%
7 SF District 7 42 36 -14.3% 15 15 0.0% $6,000,000 $5,625,000 -6.3% 40 26 -35.0% 4.8 4.5 -6.3%
8 SF District 8 11 14 +27.3% 2 4 +100.0% $2,370,945 $3,147,500 +32.8% 12 11 -8.3% 5.1 5.5 +7.8%
9 SF District 9 60 46 -23.3% 24 28 +16.7% $1,457,500 $1,652,500 +13.4% 18 16 -11.1% 2.9 2.1 -27.6%
10 SF District 10 97 82 -15.5% 33 44 +33.3% $875,000 $956,000 +9.3% 41 30 -26.8% 2.8 2.0 -28.6%
Condo/TIC/Coop
1 SF District 1 31 28 -9.7% 8 20 +150.0% $1,264,992 $1,117,500 -11.7% 36 31 -13.9% 2.6 2.8 +7.7%
2 SF District 2 14 8 -42.9% 3 3 0.0% $1,500,000 $1,100,000 -26.7% 15 40 +166.7% 3.2 2.5 -21.9%
3 SF District 3 9 4 -55.6% 4 1 -75.0% $884,000 $540,000 -38.9% 26 19 -26.9% 2.4 1.3 -45.8%
4 SF District 4 10 14 +40.0% 2 2 0.0% $662,500 $515,565 -22.2% 20 20 0.0% 4.4 4.5 +2.3%
5 SF District 5 91 55 -39.6% 47 54 +14.9% $1,300,000 $1,331,632 +2.4% 29 20 -31.0% 2.7 1.5 -44.4%
6 SF District 6 103 77 -25.2% 25 15 -40.0% $929,000 $1,100,000 +18.4% 29 21 -27.6% 3.9 2.9 -25.6%
7 SF District 7 92 56 -39.1% 20 29 +45.0% $1,597,500 $1,275,000 -20.2% 20 17 -15.0% 4.1 2.0 -51.2%
8 SF District 8 132 112 -15.2% 47 55 +17.0% $1,088,000 $1,100,000 +1.1% 36 32 -11.1% 3.4 2.8 -17.6%
9 SF District 9 292 239 -18.2% 73 115 +57.5% $1,050,000 $1,099,000 +4.7% 43 38 -11.6% 3.6 2.8 -22.2%
10 SF District 10 26 25 -3.8% 7 11 +57.1% $710,000 $730,000 +2.8% 41 51 +24.4% 4.3 3.2 -25.6%
Key metrics by report month for the districts of San Fransisco.
Current as of November 11, 2017.All data from the San Francisco MLS. Report © 2017 ShowingTime. | 16
Active Listings Sold Listings Median Sales Price Days on Market Months Supply

More Related Content

What's hot

San Francisco Market Focus April 2017
San Francisco Market Focus April 2017San Francisco Market Focus April 2017
San Francisco Market Focus April 2017Ronny Budiutama
 
San Francisco Market Focus May 2017
San Francisco Market Focus May 2017San Francisco Market Focus May 2017
San Francisco Market Focus May 2017Ronny Budiutama
 
San Francisco Real Estate Housing Market January 2017
San Francisco Real Estate Housing Market January 2017San Francisco Real Estate Housing Market January 2017
San Francisco Real Estate Housing Market January 2017Ronny Budiutama
 
Greater Boston Association of Realtors January 2017 Monthly Indicators Report
Greater Boston Association of Realtors January 2017 Monthly Indicators ReportGreater Boston Association of Realtors January 2017 Monthly Indicators Report
Greater Boston Association of Realtors January 2017 Monthly Indicators ReportJoe Schutt
 
December 2016 Greater Boston Real Estate Market Trends
December 2016 Greater Boston Real Estate Market TrendsDecember 2016 Greater Boston Real Estate Market Trends
December 2016 Greater Boston Real Estate Market TrendsJoe Schutt
 
San Francisco Real Estate Housing Market December 2016
San Francisco Real Estate Housing Market December 2016San Francisco Real Estate Housing Market December 2016
San Francisco Real Estate Housing Market December 2016Ronny Budiutama
 
GBAR Monthly Housing Market Data November 2016
GBAR Monthly Housing Market Data November 2016GBAR Monthly Housing Market Data November 2016
GBAR Monthly Housing Market Data November 2016Joe Schutt
 
San Francisco Market Focus Report May
San Francisco Market Focus Report MaySan Francisco Market Focus Report May
San Francisco Market Focus Report MayRonny Budiutama
 
San Francisco Market Focus October 2016
San Francisco Market Focus October 2016San Francisco Market Focus October 2016
San Francisco Market Focus October 2016Ronny Budiutama
 
San Francisco Market Focus June 2014
San Francisco Market Focus June 2014San Francisco Market Focus June 2014
San Francisco Market Focus June 2014Ronny Budiutama
 
San Francisco Market Focus Report July
San Francisco Market Focus Report JulySan Francisco Market Focus Report July
San Francisco Market Focus Report JulyRonny Budiutama
 
San Francisco Market Focus November 2016
San Francisco Market Focus November 2016San Francisco Market Focus November 2016
San Francisco Market Focus November 2016Ronny Budiutama
 
February 2017 Greater Boston Real Estate Market Report
February 2017 Greater Boston Real Estate Market ReportFebruary 2017 Greater Boston Real Estate Market Report
February 2017 Greater Boston Real Estate Market ReportJoe Schutt
 
San Francisco Market Focus April 2016
San Francisco Market Focus April 2016San Francisco Market Focus April 2016
San Francisco Market Focus April 2016Ronny Budiutama
 
San Francisco Market Focus February 2014
San Francisco Market Focus February 2014San Francisco Market Focus February 2014
San Francisco Market Focus February 2014Ronny Budiutama
 
San Francisco Market Focus September 2016
San Francisco Market Focus September 2016San Francisco Market Focus September 2016
San Francisco Market Focus September 2016Ronny Budiutama
 
San Francisco Market Focus October 2014
San Francisco Market Focus October 2014San Francisco Market Focus October 2014
San Francisco Market Focus October 2014Ronny Budiutama
 
Greater Boston Association of Realtors Monthly Housing Data: October 2016
Greater Boston Association of Realtors Monthly Housing Data: October 2016Greater Boston Association of Realtors Monthly Housing Data: October 2016
Greater Boston Association of Realtors Monthly Housing Data: October 2016Joe Schutt
 
San Francisco Market Focus June 2013
San Francisco Market Focus June 2013San Francisco Market Focus June 2013
San Francisco Market Focus June 2013Ronny Budiutama
 
San Francisco Market Data December 2014
San Francisco Market Data December 2014San Francisco Market Data December 2014
San Francisco Market Data December 2014Ronny Budiutama
 

What's hot (20)

San Francisco Market Focus April 2017
San Francisco Market Focus April 2017San Francisco Market Focus April 2017
San Francisco Market Focus April 2017
 
San Francisco Market Focus May 2017
San Francisco Market Focus May 2017San Francisco Market Focus May 2017
San Francisco Market Focus May 2017
 
San Francisco Real Estate Housing Market January 2017
San Francisco Real Estate Housing Market January 2017San Francisco Real Estate Housing Market January 2017
San Francisco Real Estate Housing Market January 2017
 
Greater Boston Association of Realtors January 2017 Monthly Indicators Report
Greater Boston Association of Realtors January 2017 Monthly Indicators ReportGreater Boston Association of Realtors January 2017 Monthly Indicators Report
Greater Boston Association of Realtors January 2017 Monthly Indicators Report
 
December 2016 Greater Boston Real Estate Market Trends
December 2016 Greater Boston Real Estate Market TrendsDecember 2016 Greater Boston Real Estate Market Trends
December 2016 Greater Boston Real Estate Market Trends
 
San Francisco Real Estate Housing Market December 2016
San Francisco Real Estate Housing Market December 2016San Francisco Real Estate Housing Market December 2016
San Francisco Real Estate Housing Market December 2016
 
GBAR Monthly Housing Market Data November 2016
GBAR Monthly Housing Market Data November 2016GBAR Monthly Housing Market Data November 2016
GBAR Monthly Housing Market Data November 2016
 
San Francisco Market Focus Report May
San Francisco Market Focus Report MaySan Francisco Market Focus Report May
San Francisco Market Focus Report May
 
San Francisco Market Focus October 2016
San Francisco Market Focus October 2016San Francisco Market Focus October 2016
San Francisco Market Focus October 2016
 
San Francisco Market Focus June 2014
San Francisco Market Focus June 2014San Francisco Market Focus June 2014
San Francisco Market Focus June 2014
 
San Francisco Market Focus Report July
San Francisco Market Focus Report JulySan Francisco Market Focus Report July
San Francisco Market Focus Report July
 
San Francisco Market Focus November 2016
San Francisco Market Focus November 2016San Francisco Market Focus November 2016
San Francisco Market Focus November 2016
 
February 2017 Greater Boston Real Estate Market Report
February 2017 Greater Boston Real Estate Market ReportFebruary 2017 Greater Boston Real Estate Market Report
February 2017 Greater Boston Real Estate Market Report
 
San Francisco Market Focus April 2016
San Francisco Market Focus April 2016San Francisco Market Focus April 2016
San Francisco Market Focus April 2016
 
San Francisco Market Focus February 2014
San Francisco Market Focus February 2014San Francisco Market Focus February 2014
San Francisco Market Focus February 2014
 
San Francisco Market Focus September 2016
San Francisco Market Focus September 2016San Francisco Market Focus September 2016
San Francisco Market Focus September 2016
 
San Francisco Market Focus October 2014
San Francisco Market Focus October 2014San Francisco Market Focus October 2014
San Francisco Market Focus October 2014
 
Greater Boston Association of Realtors Monthly Housing Data: October 2016
Greater Boston Association of Realtors Monthly Housing Data: October 2016Greater Boston Association of Realtors Monthly Housing Data: October 2016
Greater Boston Association of Realtors Monthly Housing Data: October 2016
 
San Francisco Market Focus June 2013
San Francisco Market Focus June 2013San Francisco Market Focus June 2013
San Francisco Market Focus June 2013
 
San Francisco Market Data December 2014
San Francisco Market Data December 2014San Francisco Market Data December 2014
San Francisco Market Data December 2014
 

Similar to San Francisco Market Focus October 2017

San Francisco Market Focus August 2017
San Francisco Market Focus August 2017San Francisco Market Focus August 2017
San Francisco Market Focus August 2017Ronny Budiutama
 
San Francisco Market Focus Report September 2018
San Francisco Market Focus Report September 2018San Francisco Market Focus Report September 2018
San Francisco Market Focus Report September 2018Ronny Budiutama
 
San Francisco Market Focus Report November 2018
San Francisco Market Focus Report November 2018San Francisco Market Focus Report November 2018
San Francisco Market Focus Report November 2018Ronny Budiutama
 
San Francisco Market Focus April 2018
San Francisco Market Focus April 2018San Francisco Market Focus April 2018
San Francisco Market Focus April 2018Ronny Budiutama
 
San Francisco Market Focus March 2018
San Francisco Market Focus March 2018San Francisco Market Focus March 2018
San Francisco Market Focus March 2018Ronny Budiutama
 
San Francisco Market Focus Report Aug 2018
San Francisco Market Focus Report Aug 2018San Francisco Market Focus Report Aug 2018
San Francisco Market Focus Report Aug 2018Ronny Budiutama
 
San Francisco market focus report June 2018
San Francisco market focus report June 2018San Francisco market focus report June 2018
San Francisco market focus report June 2018Ronny Budiutama
 
San Francisco Market Focus July 2016
San Francisco Market Focus July 2016San Francisco Market Focus July 2016
San Francisco Market Focus July 2016Ronny Budiutama
 
San Francisco Market Focus August 2016
San Francisco Market Focus August 2016San Francisco Market Focus August 2016
San Francisco Market Focus August 2016Ronny Budiutama
 
San Francisco Market Focus December 2015
San Francisco Market Focus December 2015San Francisco Market Focus December 2015
San Francisco Market Focus December 2015Ronny Budiutama
 
January 2018 San Francisco Market Update
January 2018 San Francisco Market UpdateJanuary 2018 San Francisco Market Update
January 2018 San Francisco Market UpdateRonny Budiutama
 
San Francisco Market Focus February 2018
San Francisco Market Focus February 2018San Francisco Market Focus February 2018
San Francisco Market Focus February 2018Ronny Budiutama
 
San Francisco Market Focus Report December 2018
San Francisco Market Focus Report December 2018San Francisco Market Focus Report December 2018
San Francisco Market Focus Report December 2018Ronny Budiutama
 
San Francisco Market Focus November 2015
San Francisco Market Focus November 2015San Francisco Market Focus November 2015
San Francisco Market Focus November 2015Ronny Budiutama
 
San Francisco Market Focus June 2016
San Francisco Market Focus June 2016San Francisco Market Focus June 2016
San Francisco Market Focus June 2016Ronny Budiutama
 
San Francisco Market Focus October 2015
San Francisco Market Focus October 2015San Francisco Market Focus October 2015
San Francisco Market Focus October 2015Ronny Budiutama
 
San Francisco Market Focus February 2016
San Francisco Market Focus February 2016San Francisco Market Focus February 2016
San Francisco Market Focus February 2016Ronny Budiutama
 
San Francisco Market Focus September 2015
San Francisco Market Focus September 2015San Francisco Market Focus September 2015
San Francisco Market Focus September 2015Ronny Budiutama
 
San Francisco November 2023 Market Report
San Francisco November 2023 Market ReportSan Francisco November 2023 Market Report
San Francisco November 2023 Market ReportRonny Budiutama
 

Similar to San Francisco Market Focus October 2017 (19)

San Francisco Market Focus August 2017
San Francisco Market Focus August 2017San Francisco Market Focus August 2017
San Francisco Market Focus August 2017
 
San Francisco Market Focus Report September 2018
San Francisco Market Focus Report September 2018San Francisco Market Focus Report September 2018
San Francisco Market Focus Report September 2018
 
San Francisco Market Focus Report November 2018
San Francisco Market Focus Report November 2018San Francisco Market Focus Report November 2018
San Francisco Market Focus Report November 2018
 
San Francisco Market Focus April 2018
San Francisco Market Focus April 2018San Francisco Market Focus April 2018
San Francisco Market Focus April 2018
 
San Francisco Market Focus March 2018
San Francisco Market Focus March 2018San Francisco Market Focus March 2018
San Francisco Market Focus March 2018
 
San Francisco Market Focus Report Aug 2018
San Francisco Market Focus Report Aug 2018San Francisco Market Focus Report Aug 2018
San Francisco Market Focus Report Aug 2018
 
San Francisco market focus report June 2018
San Francisco market focus report June 2018San Francisco market focus report June 2018
San Francisco market focus report June 2018
 
San Francisco Market Focus July 2016
San Francisco Market Focus July 2016San Francisco Market Focus July 2016
San Francisco Market Focus July 2016
 
San Francisco Market Focus August 2016
San Francisco Market Focus August 2016San Francisco Market Focus August 2016
San Francisco Market Focus August 2016
 
San Francisco Market Focus December 2015
San Francisco Market Focus December 2015San Francisco Market Focus December 2015
San Francisco Market Focus December 2015
 
January 2018 San Francisco Market Update
January 2018 San Francisco Market UpdateJanuary 2018 San Francisco Market Update
January 2018 San Francisco Market Update
 
San Francisco Market Focus February 2018
San Francisco Market Focus February 2018San Francisco Market Focus February 2018
San Francisco Market Focus February 2018
 
San Francisco Market Focus Report December 2018
San Francisco Market Focus Report December 2018San Francisco Market Focus Report December 2018
San Francisco Market Focus Report December 2018
 
San Francisco Market Focus November 2015
San Francisco Market Focus November 2015San Francisco Market Focus November 2015
San Francisco Market Focus November 2015
 
San Francisco Market Focus June 2016
San Francisco Market Focus June 2016San Francisco Market Focus June 2016
San Francisco Market Focus June 2016
 
San Francisco Market Focus October 2015
San Francisco Market Focus October 2015San Francisco Market Focus October 2015
San Francisco Market Focus October 2015
 
San Francisco Market Focus February 2016
San Francisco Market Focus February 2016San Francisco Market Focus February 2016
San Francisco Market Focus February 2016
 
San Francisco Market Focus September 2015
San Francisco Market Focus September 2015San Francisco Market Focus September 2015
San Francisco Market Focus September 2015
 
San Francisco November 2023 Market Report
San Francisco November 2023 Market ReportSan Francisco November 2023 Market Report
San Francisco November 2023 Market Report
 

More from Ronny Budiutama

San Francisco January 2024 Market Report
San Francisco January 2024 Market ReportSan Francisco January 2024 Market Report
San Francisco January 2024 Market ReportRonny Budiutama
 
San Francisco December 2023 Market Report
San Francisco December 2023 Market ReportSan Francisco December 2023 Market Report
San Francisco December 2023 Market ReportRonny Budiutama
 
2023 Annual San Francisco Housing Market
2023 Annual San Francisco Housing Market2023 Annual San Francisco Housing Market
2023 Annual San Francisco Housing MarketRonny Budiutama
 
October 2023 Report: San Francisco Real Estate Market Insights
October 2023 Report: San Francisco Real Estate Market InsightsOctober 2023 Report: San Francisco Real Estate Market Insights
October 2023 Report: San Francisco Real Estate Market InsightsRonny Budiutama
 
CA Weekly MLS Market Data Report - August 2023
CA Weekly MLS Market Data Report - August 2023CA Weekly MLS Market Data Report - August 2023
CA Weekly MLS Market Data Report - August 2023Ronny Budiutama
 
San Francisco Market Report July 2023.pdf
San Francisco Market Report July 2023.pdfSan Francisco Market Report July 2023.pdf
San Francisco Market Report July 2023.pdfRonny Budiutama
 
San Francisco May 2023 Market Report.pdf
San Francisco May 2023 Market Report.pdfSan Francisco May 2023 Market Report.pdf
San Francisco May 2023 Market Report.pdfRonny Budiutama
 
San Francisco June 2023 Market Report.pdf
San Francisco June 2023 Market Report.pdfSan Francisco June 2023 Market Report.pdf
San Francisco June 2023 Market Report.pdfRonny Budiutama
 
San Francisco Market Report March 2023.pdf
San Francisco Market Report March 2023.pdfSan Francisco Market Report March 2023.pdf
San Francisco Market Report March 2023.pdfRonny Budiutama
 
San Francisco Market Report February 2023
San Francisco Market Report February 2023San Francisco Market Report February 2023
San Francisco Market Report February 2023Ronny Budiutama
 
San Francisco Market Report January 2023.pdf
San Francisco Market Report January 2023.pdfSan Francisco Market Report January 2023.pdf
San Francisco Market Report January 2023.pdfRonny Budiutama
 
Annual Report on the San Francisco County Housing Market.pdf
Annual Report on the San Francisco County Housing Market.pdfAnnual Report on the San Francisco County Housing Market.pdf
Annual Report on the San Francisco County Housing Market.pdfRonny Budiutama
 
San Francisco Market Report December 2022.pdf
San Francisco Market Report December 2022.pdfSan Francisco Market Report December 2022.pdf
San Francisco Market Report December 2022.pdfRonny Budiutama
 
San Francisco Market Report November 2022.pdf
San Francisco Market Report November 2022.pdfSan Francisco Market Report November 2022.pdf
San Francisco Market Report November 2022.pdfRonny Budiutama
 
San Francisco Market Report October 2022.pdf
San Francisco Market Report October 2022.pdfSan Francisco Market Report October 2022.pdf
San Francisco Market Report October 2022.pdfRonny Budiutama
 
San Francisco Market Report September 2022.pdf
San Francisco Market Report September 2022.pdfSan Francisco Market Report September 2022.pdf
San Francisco Market Report September 2022.pdfRonny Budiutama
 
San Francisco Market Report August 2022.pdf
San Francisco Market Report August 2022.pdfSan Francisco Market Report August 2022.pdf
San Francisco Market Report August 2022.pdfRonny Budiutama
 
San Francisco Market Report July 2022.pdf
San Francisco Market Report July 2022.pdfSan Francisco Market Report July 2022.pdf
San Francisco Market Report July 2022.pdfRonny Budiutama
 
San Francisco Market Report June 2022.pdf
San Francisco Market Report June 2022.pdfSan Francisco Market Report June 2022.pdf
San Francisco Market Report June 2022.pdfRonny Budiutama
 
San Francisco Market Report May 2022.
San Francisco Market Report May 2022.San Francisco Market Report May 2022.
San Francisco Market Report May 2022.Ronny Budiutama
 

More from Ronny Budiutama (20)

San Francisco January 2024 Market Report
San Francisco January 2024 Market ReportSan Francisco January 2024 Market Report
San Francisco January 2024 Market Report
 
San Francisco December 2023 Market Report
San Francisco December 2023 Market ReportSan Francisco December 2023 Market Report
San Francisco December 2023 Market Report
 
2023 Annual San Francisco Housing Market
2023 Annual San Francisco Housing Market2023 Annual San Francisco Housing Market
2023 Annual San Francisco Housing Market
 
October 2023 Report: San Francisco Real Estate Market Insights
October 2023 Report: San Francisco Real Estate Market InsightsOctober 2023 Report: San Francisco Real Estate Market Insights
October 2023 Report: San Francisco Real Estate Market Insights
 
CA Weekly MLS Market Data Report - August 2023
CA Weekly MLS Market Data Report - August 2023CA Weekly MLS Market Data Report - August 2023
CA Weekly MLS Market Data Report - August 2023
 
San Francisco Market Report July 2023.pdf
San Francisco Market Report July 2023.pdfSan Francisco Market Report July 2023.pdf
San Francisco Market Report July 2023.pdf
 
San Francisco May 2023 Market Report.pdf
San Francisco May 2023 Market Report.pdfSan Francisco May 2023 Market Report.pdf
San Francisco May 2023 Market Report.pdf
 
San Francisco June 2023 Market Report.pdf
San Francisco June 2023 Market Report.pdfSan Francisco June 2023 Market Report.pdf
San Francisco June 2023 Market Report.pdf
 
San Francisco Market Report March 2023.pdf
San Francisco Market Report March 2023.pdfSan Francisco Market Report March 2023.pdf
San Francisco Market Report March 2023.pdf
 
San Francisco Market Report February 2023
San Francisco Market Report February 2023San Francisco Market Report February 2023
San Francisco Market Report February 2023
 
San Francisco Market Report January 2023.pdf
San Francisco Market Report January 2023.pdfSan Francisco Market Report January 2023.pdf
San Francisco Market Report January 2023.pdf
 
Annual Report on the San Francisco County Housing Market.pdf
Annual Report on the San Francisco County Housing Market.pdfAnnual Report on the San Francisco County Housing Market.pdf
Annual Report on the San Francisco County Housing Market.pdf
 
San Francisco Market Report December 2022.pdf
San Francisco Market Report December 2022.pdfSan Francisco Market Report December 2022.pdf
San Francisco Market Report December 2022.pdf
 
San Francisco Market Report November 2022.pdf
San Francisco Market Report November 2022.pdfSan Francisco Market Report November 2022.pdf
San Francisco Market Report November 2022.pdf
 
San Francisco Market Report October 2022.pdf
San Francisco Market Report October 2022.pdfSan Francisco Market Report October 2022.pdf
San Francisco Market Report October 2022.pdf
 
San Francisco Market Report September 2022.pdf
San Francisco Market Report September 2022.pdfSan Francisco Market Report September 2022.pdf
San Francisco Market Report September 2022.pdf
 
San Francisco Market Report August 2022.pdf
San Francisco Market Report August 2022.pdfSan Francisco Market Report August 2022.pdf
San Francisco Market Report August 2022.pdf
 
San Francisco Market Report July 2022.pdf
San Francisco Market Report July 2022.pdfSan Francisco Market Report July 2022.pdf
San Francisco Market Report July 2022.pdf
 
San Francisco Market Report June 2022.pdf
San Francisco Market Report June 2022.pdfSan Francisco Market Report June 2022.pdf
San Francisco Market Report June 2022.pdf
 
San Francisco Market Report May 2022.
San Francisco Market Report May 2022.San Francisco Market Report May 2022.
San Francisco Market Report May 2022.
 

Recently uploaded

Rustomjee Cleon Bandra East, Mumbai - Brochure.pdf
Rustomjee Cleon Bandra East, Mumbai - Brochure.pdfRustomjee Cleon Bandra East, Mumbai - Brochure.pdf
Rustomjee Cleon Bandra East, Mumbai - Brochure.pdfmonikasharma630
 
9990771857 Call Girls in Noida Sector 11 Noida (Call Girls) Delhi
9990771857 Call Girls in Noida Sector 11 Noida (Call Girls) Delhi9990771857 Call Girls in Noida Sector 11 Noida (Call Girls) Delhi
9990771857 Call Girls in Noida Sector 11 Noida (Call Girls) Delhidelhimodel235
 
Call girls in Jeewan Park .Delhi↫8447779280↬ ꧂Escorts Service In Delhi Ncr
Call girls in Jeewan Park .Delhi↫8447779280↬ ꧂Escorts Service In Delhi NcrCall girls in Jeewan Park .Delhi↫8447779280↬ ꧂Escorts Service In Delhi Ncr
Call girls in Jeewan Park .Delhi↫8447779280↬ ꧂Escorts Service In Delhi Ncrasmaqueen5
 
Low Rate Call Girls in Triveni Complex Delhi Call 9990771857
Low Rate Call Girls in Triveni Complex Delhi Call 9990771857Low Rate Call Girls in Triveni Complex Delhi Call 9990771857
Low Rate Call Girls in Triveni Complex Delhi Call 9990771857delhimodel235
 
Call Girls in shastri nagar Delhi 8264348440 ✅ call girls ❤️
Call Girls in shastri nagar Delhi 8264348440 ✅ call girls ❤️Call Girls in shastri nagar Delhi 8264348440 ✅ call girls ❤️
Call Girls in shastri nagar Delhi 8264348440 ✅ call girls ❤️soniya singh
 
Sankla East World Hadapsar Pune E-Brochure.pdf
Sankla East World Hadapsar Pune  E-Brochure.pdfSankla East World Hadapsar Pune  E-Brochure.pdf
Sankla East World Hadapsar Pune E-Brochure.pdfManishSaxena95
 
FULL ENJOY 🔝 8264348440 🔝 Call Girls in DLF phase 3 | Gurgaon
FULL ENJOY 🔝 8264348440 🔝 Call Girls in DLF phase 3 | GurgaonFULL ENJOY 🔝 8264348440 🔝 Call Girls in DLF phase 3 | Gurgaon
FULL ENJOY 🔝 8264348440 🔝 Call Girls in DLF phase 3 | Gurgaonsoniya singh
 
Call Girls in Janakpuri ↫8447779280↫Short 1500 Night 6000-Escorts Service In ...
Call Girls in Janakpuri ↫8447779280↫Short 1500 Night 6000-Escorts Service In ...Call Girls in Janakpuri ↫8447779280↫Short 1500 Night 6000-Escorts Service In ...
Call Girls in Janakpuri ↫8447779280↫Short 1500 Night 6000-Escorts Service In ...asmaqueen5
 
Puravankara Mundhwa Pune E-Brochure.pdf
Puravankara Mundhwa Pune  E-Brochure.pdfPuravankara Mundhwa Pune  E-Brochure.pdf
Puravankara Mundhwa Pune E-Brochure.pdfManishSaxena95
 
Magarpatta Nova Elegance Mundhwa Pune E-Brochure.pdf
Magarpatta Nova Elegance Mundhwa Pune  E-Brochure.pdfMagarpatta Nova Elegance Mundhwa Pune  E-Brochure.pdf
Magarpatta Nova Elegance Mundhwa Pune E-Brochure.pdfManishSaxena95
 
Call Girls in Sarai Kale Khan Delhi 💯Call Us 🔝8264348440🔝
Call Girls in Sarai Kale Khan Delhi 💯Call Us 🔝8264348440🔝Call Girls in Sarai Kale Khan Delhi 💯Call Us 🔝8264348440🔝
Call Girls in Sarai Kale Khan Delhi 💯Call Us 🔝8264348440🔝soniya singh
 
How to Build Multifamily and Laneway Suites in Toronto!! (feat. Expert Archi...
How to Build Multifamily and Laneway Suites  in Toronto!! (feat. Expert Archi...How to Build Multifamily and Laneway Suites  in Toronto!! (feat. Expert Archi...
How to Build Multifamily and Laneway Suites in Toronto!! (feat. Expert Archi...Volition Properties
 
Call Girls in Model Town Delhi 💯Call Us 🔝8264348440🔝
Call Girls in Model Town Delhi 💯Call Us 🔝8264348440🔝Call Girls in Model Town Delhi 💯Call Us 🔝8264348440🔝
Call Girls in Model Town Delhi 💯Call Us 🔝8264348440🔝soniya singh
 
Call Girls in Kashmiri Gate Delhi 💯Call Us 🔝8264348440🔝
Call Girls in Kashmiri Gate Delhi 💯Call Us 🔝8264348440🔝Call Girls in Kashmiri Gate Delhi 💯Call Us 🔝8264348440🔝
Call Girls in Kashmiri Gate Delhi 💯Call Us 🔝8264348440🔝soniya singh
 
call girls in Shahdara (DELHI) 🔝 >༒9953330565🔝 genuine Escort Service 🔝✔️✔️
call girls in Shahdara (DELHI) 🔝 >༒9953330565🔝 genuine Escort Service 🔝✔️✔️call girls in Shahdara (DELHI) 🔝 >༒9953330565🔝 genuine Escort Service 🔝✔️✔️
call girls in Shahdara (DELHI) 🔝 >༒9953330565🔝 genuine Escort Service 🔝✔️✔️9953056974 Low Rate Call Girls In Saket, Delhi NCR
 
9990771857 Call Girls in Noida Sector 10 Noida (Call Girls) Delhi
9990771857 Call Girls in Noida Sector 10 Noida (Call Girls) Delhi9990771857 Call Girls in Noida Sector 10 Noida (Call Girls) Delhi
9990771857 Call Girls in Noida Sector 10 Noida (Call Girls) Delhidelhimodel235
 
Call Girls in laxmi Nagar Delhi 💯Call Us 🔝 9582086666🔝 South Delhi Escorts Se...
Call Girls in laxmi Nagar Delhi 💯Call Us 🔝 9582086666🔝 South Delhi Escorts Se...Call Girls in laxmi Nagar Delhi 💯Call Us 🔝 9582086666🔝 South Delhi Escorts Se...
Call Girls in laxmi Nagar Delhi 💯Call Us 🔝 9582086666🔝 South Delhi Escorts Se...delhimodel235
 
9990771857 Call Girls in Noida Sector 34 Noida (Call Girls) Delhi
9990771857 Call Girls in Noida Sector 34 Noida (Call Girls) Delhi9990771857 Call Girls in Noida Sector 34 Noida (Call Girls) Delhi
9990771857 Call Girls in Noida Sector 34 Noida (Call Girls) Delhidelhimodel235
 
Call Girls Janta Market {Delhi//8447779280)) ₹↬Short 2000 Full Night 5500 ↫Es...
Call Girls Janta Market {Delhi//8447779280)) ₹↬Short 2000 Full Night 5500 ↫Es...Call Girls Janta Market {Delhi//8447779280)) ₹↬Short 2000 Full Night 5500 ↫Es...
Call Girls Janta Market {Delhi//8447779280)) ₹↬Short 2000 Full Night 5500 ↫Es...asmaqueen5
 

Recently uploaded (20)

Rustomjee Cleon Bandra East, Mumbai - Brochure.pdf
Rustomjee Cleon Bandra East, Mumbai - Brochure.pdfRustomjee Cleon Bandra East, Mumbai - Brochure.pdf
Rustomjee Cleon Bandra East, Mumbai - Brochure.pdf
 
9990771857 Call Girls in Noida Sector 11 Noida (Call Girls) Delhi
9990771857 Call Girls in Noida Sector 11 Noida (Call Girls) Delhi9990771857 Call Girls in Noida Sector 11 Noida (Call Girls) Delhi
9990771857 Call Girls in Noida Sector 11 Noida (Call Girls) Delhi
 
Call girls in Jeewan Park .Delhi↫8447779280↬ ꧂Escorts Service In Delhi Ncr
Call girls in Jeewan Park .Delhi↫8447779280↬ ꧂Escorts Service In Delhi NcrCall girls in Jeewan Park .Delhi↫8447779280↬ ꧂Escorts Service In Delhi Ncr
Call girls in Jeewan Park .Delhi↫8447779280↬ ꧂Escorts Service In Delhi Ncr
 
Low Rate Call Girls in Triveni Complex Delhi Call 9990771857
Low Rate Call Girls in Triveni Complex Delhi Call 9990771857Low Rate Call Girls in Triveni Complex Delhi Call 9990771857
Low Rate Call Girls in Triveni Complex Delhi Call 9990771857
 
Call Girls in shastri nagar Delhi 8264348440 ✅ call girls ❤️
Call Girls in shastri nagar Delhi 8264348440 ✅ call girls ❤️Call Girls in shastri nagar Delhi 8264348440 ✅ call girls ❤️
Call Girls in shastri nagar Delhi 8264348440 ✅ call girls ❤️
 
Sankla East World Hadapsar Pune E-Brochure.pdf
Sankla East World Hadapsar Pune  E-Brochure.pdfSankla East World Hadapsar Pune  E-Brochure.pdf
Sankla East World Hadapsar Pune E-Brochure.pdf
 
FULL ENJOY 🔝 8264348440 🔝 Call Girls in DLF phase 3 | Gurgaon
FULL ENJOY 🔝 8264348440 🔝 Call Girls in DLF phase 3 | GurgaonFULL ENJOY 🔝 8264348440 🔝 Call Girls in DLF phase 3 | Gurgaon
FULL ENJOY 🔝 8264348440 🔝 Call Girls in DLF phase 3 | Gurgaon
 
Call Girls in Janakpuri ↫8447779280↫Short 1500 Night 6000-Escorts Service In ...
Call Girls in Janakpuri ↫8447779280↫Short 1500 Night 6000-Escorts Service In ...Call Girls in Janakpuri ↫8447779280↫Short 1500 Night 6000-Escorts Service In ...
Call Girls in Janakpuri ↫8447779280↫Short 1500 Night 6000-Escorts Service In ...
 
Puravankara Mundhwa Pune E-Brochure.pdf
Puravankara Mundhwa Pune  E-Brochure.pdfPuravankara Mundhwa Pune  E-Brochure.pdf
Puravankara Mundhwa Pune E-Brochure.pdf
 
Low Rate Call Girls in Triveni Complex Delhi Call 9873940964
Low Rate Call Girls in Triveni Complex Delhi Call 9873940964Low Rate Call Girls in Triveni Complex Delhi Call 9873940964
Low Rate Call Girls in Triveni Complex Delhi Call 9873940964
 
Magarpatta Nova Elegance Mundhwa Pune E-Brochure.pdf
Magarpatta Nova Elegance Mundhwa Pune  E-Brochure.pdfMagarpatta Nova Elegance Mundhwa Pune  E-Brochure.pdf
Magarpatta Nova Elegance Mundhwa Pune E-Brochure.pdf
 
Call Girls in Sarai Kale Khan Delhi 💯Call Us 🔝8264348440🔝
Call Girls in Sarai Kale Khan Delhi 💯Call Us 🔝8264348440🔝Call Girls in Sarai Kale Khan Delhi 💯Call Us 🔝8264348440🔝
Call Girls in Sarai Kale Khan Delhi 💯Call Us 🔝8264348440🔝
 
How to Build Multifamily and Laneway Suites in Toronto!! (feat. Expert Archi...
How to Build Multifamily and Laneway Suites  in Toronto!! (feat. Expert Archi...How to Build Multifamily and Laneway Suites  in Toronto!! (feat. Expert Archi...
How to Build Multifamily and Laneway Suites in Toronto!! (feat. Expert Archi...
 
Call Girls in Model Town Delhi 💯Call Us 🔝8264348440🔝
Call Girls in Model Town Delhi 💯Call Us 🔝8264348440🔝Call Girls in Model Town Delhi 💯Call Us 🔝8264348440🔝
Call Girls in Model Town Delhi 💯Call Us 🔝8264348440🔝
 
Call Girls in Kashmiri Gate Delhi 💯Call Us 🔝8264348440🔝
Call Girls in Kashmiri Gate Delhi 💯Call Us 🔝8264348440🔝Call Girls in Kashmiri Gate Delhi 💯Call Us 🔝8264348440🔝
Call Girls in Kashmiri Gate Delhi 💯Call Us 🔝8264348440🔝
 
call girls in Shahdara (DELHI) 🔝 >༒9953330565🔝 genuine Escort Service 🔝✔️✔️
call girls in Shahdara (DELHI) 🔝 >༒9953330565🔝 genuine Escort Service 🔝✔️✔️call girls in Shahdara (DELHI) 🔝 >༒9953330565🔝 genuine Escort Service 🔝✔️✔️
call girls in Shahdara (DELHI) 🔝 >༒9953330565🔝 genuine Escort Service 🔝✔️✔️
 
9990771857 Call Girls in Noida Sector 10 Noida (Call Girls) Delhi
9990771857 Call Girls in Noida Sector 10 Noida (Call Girls) Delhi9990771857 Call Girls in Noida Sector 10 Noida (Call Girls) Delhi
9990771857 Call Girls in Noida Sector 10 Noida (Call Girls) Delhi
 
Call Girls in laxmi Nagar Delhi 💯Call Us 🔝 9582086666🔝 South Delhi Escorts Se...
Call Girls in laxmi Nagar Delhi 💯Call Us 🔝 9582086666🔝 South Delhi Escorts Se...Call Girls in laxmi Nagar Delhi 💯Call Us 🔝 9582086666🔝 South Delhi Escorts Se...
Call Girls in laxmi Nagar Delhi 💯Call Us 🔝 9582086666🔝 South Delhi Escorts Se...
 
9990771857 Call Girls in Noida Sector 34 Noida (Call Girls) Delhi
9990771857 Call Girls in Noida Sector 34 Noida (Call Girls) Delhi9990771857 Call Girls in Noida Sector 34 Noida (Call Girls) Delhi
9990771857 Call Girls in Noida Sector 34 Noida (Call Girls) Delhi
 
Call Girls Janta Market {Delhi//8447779280)) ₹↬Short 2000 Full Night 5500 ↫Es...
Call Girls Janta Market {Delhi//8447779280)) ₹↬Short 2000 Full Night 5500 ↫Es...Call Girls Janta Market {Delhi//8447779280)) ₹↬Short 2000 Full Night 5500 ↫Es...
Call Girls Janta Market {Delhi//8447779280)) ₹↬Short 2000 Full Night 5500 ↫Es...
 

San Francisco Market Focus October 2017

  • 1. October 2017 Monthly Snapshot One-Year Change in One-Year Change in Median Sales Price Single Family Median Sales Price Condo/TIC/Coop 2 3 4 5 6 7 8 9 10 11 12 13 14 15 16 Monthly Indicators + 13.4% + 0.2% + 3.4% One-Year Change in For residential real estate in 2017, the news has continued to provide a relative sense of calm for both buyers and sellers. The national unemployment rate registered in at 4.1 percent for October 2017, which means that joblessness has not been this low in the U.S. since December 2000. Another positive, mortgage rates have held steady at or near 3.9 percent. Historically, the average rate has been around 6.0 percent. These factors help to keep the pool of potential buyers full, even during the so-called off-season of home sales. New Listings were down 0.5 percent for single family homes and 2.3 percent for Condo/TIC/Coop properties. Pending Sales increased 12.2 percent for single family homes and 32.1 percent for Condo/TIC/Coop properties. The Median Sales Price was up 13.4 percent to $1,588,000 for single family homes and 0.2 percent to $1,140,000 for Condo/TIC/Coop properties. Months Supply of Inventory decreased 29.6 percent for single family units and 28.6 percent for Condo/TIC/Coop units. Although inventory levels are low in many markets, there has largely been enough listing and building activity, or at least conversation about future activity, to maintain a positive attitude about the prospects of buying or selling a home. Low affordability has started to become a recent topic of conversation and is worth watching. But with a healthy economy, level of demand and national unemployment rate, sellers are going to continue to see strong prices for their homes. Median Sales Price All Property Types Residential real estate activity in San Francisco County (Districts 1-10), comprised of single-family properties, townhomes and condominiums. Percent changes are calculated using rounded figures. Single Family Activity Overview Months Supply of Inventory Current as of November 11, 2017.All data from the San Francisco MLS. Report © 2017 ShowingTime. Condo/TIC/Coop Activity Overview Inventory of Active Listings % of Properties Sold Over List Price % of List Price Received Housing Affordability Ratio All Properties Activity Overview New Listings Pending Sales Sold Listings Median Sales Price Average Sales Price Days on Market Until Sale Activity by District
  • 2. Single Family Activity Overview Key metrics by report month and for year-to-date (YTD) starting from the first of the year. Key Metrics Historical Sparkbars 10-2016 10-2017 Percent Change YTD 2016 YTD 2017 Percent Change Current as of November 11, 2017.All data from the San Francisco MLS. Report © 2017 ShowingTime. | 2 Months Supply 2.7 1.9 - 29.6% -- -- -- Affordability Ratio 39 32 - 17.9% % of List Price Received 111.2% 115.3% + 3.7% 112.2% 41 79.0% + 2.7% + 2.5% 37 - 9.8% 115.0% % of Properties Sold Over List Price 78.9% 83.1% + 5.3% 76.9% Active Listings 490 363 - 25.9% -- Avg. Sales Price $2,000,319 $2,036,319 + 1.8% $1,704,203 Days on Market 27 22 - 18.5% 31 27 - 12.9% $1,774,026 -- -- Median Sales Price $1,400,000 $1,588,000 + 13.4% $1,325,000 Sold Listings 227 231 + 1.8% 1,816 New Listings 222 221 - 0.5% 2,463 Pending Sales 222 249 + 12.2% + 3.9%1,885 1,959 - 4.8%2,345 1,868 + 2.9% $1,400,000 + 5.7% + 4.1% 10-2014 10-2015 10-2016 10-2017 10-2014 10-2015 10-2016 10-2017 10-2014 10-2015 10-2016 10-2017 10-2014 10-2015 10-2016 10-2017 10-2014 10-2015 10-2016 10-2017 10-2014 10-2015 10-2016 10-2017 10-2014 10-2015 10-2016 10-2017 10-2014 10-2015 10-2016 10-2017 10-2014 10-2015 10-2016 10-2017 10-2014 10-2015 10-2016 10-2017 10-2014 10-2015 10-2016 10-2017
  • 3. Condo/TIC/Coop Activity Overview Key metrics by report month and for year-to-date (YTD) starting from the first of the year. Key Metrics Historical Sparkbars 10-2016 10-2017 Percent Change YTD 2016 YTD 2017 Percent Change Current as of November 11, 2017.All data from the San Francisco MLS. Report © 2017 ShowingTime. | 3 Months Supply 3.5 2.5 - 28.6% -- -- -- Affordability Ratio 56 52 - 7.1% % of List Price Received 104.2% 106.7% + 2.4% 104.9% 58 59.8% + 0.7% + 0.3% 53 - 8.6% 105.2% % of Properties Sold Over List Price 53.8% 66.9% + 24.3% 59.4% Active Listings 800 618 - 22.8% -- Avg. Sales Price $1,263,882 $1,282,412 + 1.5% $1,242,497 Days on Market 34 31 - 8.8% 37 $1,125,000 + 2.6% + 3.8% 36 - 2.7% $1,289,436 -- -- Sold Listings 236 305 + 29.2% 2,294 2,351 + 2.5% Median Sales Price $1,137,500 $1,140,000 + 0.2% $1,096,618 - 6.7% Pending Sales 249 329 + 32.1% 2,346 2,467 + 5.2% New Listings 300 293 - 2.3% 3,460 3,227 10-2014 10-2015 10-2016 10-2017 10-2014 10-2015 10-2016 10-2017 10-2014 10-2015 10-2016 10-2017 10-2014 10-2015 10-2016 10-2017 10-2014 10-2015 10-2016 10-2017 10-2014 10-2015 10-2016 10-2017 10-2014 10-2015 10-2016 10-2017 10-2014 10-2015 10-2016 10-2017 10-2014 10-2015 10-2016 10-2017 10-2014 10-2015 10-2016 10-2017 10-2014 10-2015 10-2016 10-2017
  • 4. New Listings New Listings Single Family Year-Over-Year Change Condo/TIC/ Coop Year-Over-Year Change Nov-2016 138 -3.5% 159 -18.5% Dec-2016 70 +4.5% 119 -1.7% Jan-2017 176 -3.3% 328 +11.6% Feb-2017 187 -18.0% 329 -2.7% Mar-2017 276 +1.1% 349 -7.4% Apr-2017 248 -12.4% 284 -23.7% May-2017 288 +12.5% 360 -3.7% Jun-2017 238 0.0% 313 -23.3% Jul-2017 210 -9.5% 271 -2.2% Aug-2017 206 +2.0% 276 -3.2% Sep-2017 295 -15.0% 424 -2.5% Oct-2017 221 -0.5% 293 -2.3% 12-Month Avg 213 -4.5% 292 -7.2% Historical New Listings by Month Current as of November 11, 2017.All data from the San Francisco MLS. Report © 2017 ShowingTime. | 4 A count of the properties that have been newly listed on the market in a given month. 263 322 222 300 221 293 Single Family Condo/TIC/Coop October 0 100 200 300 400 500 600 700 1-2005 1-2006 1-2007 1-2008 1-2009 1-2010 1-2011 1-2012 1-2013 1-2014 1-2015 1-2016 1-2017 Single Family Condo/TIC/Coop 2,530 3,238 2,463 3,460 2,345 3,227 Single Family Condo/TIC/Coop Year to Date 2015 2016 2017 - 2.3%- 6.8%- 0.5%- 15.6% + 6.9%- 4.8%- 2.6% - 6.7% 2015 2016 2017 2015 2016 2017 2015 2016 2017 + 5.2% + 0.4% - 4.1%- 3.9%
  • 5. Pending Sales Pending Sales Single Family Year-Over-Year Change Condo/TIC/ Coop Year-Over-Year Change Nov-2016 209 +19.4% 264 +11.4% Dec-2016 123 -6.1% 178 +1.7% Jan-2017 93 -6.1% 144 +0.7% Feb-2017 135 +8.9% 208 -8.4% Mar-2017 212 +8.7% 303 +34.1% Apr-2017 198 -7.5% 226 -7.4% May-2017 240 -3.6% 306 +7.4% Jun-2017 249 +8.7% 290 +10.7% Jul-2017 174 +3.0% 210 -18.6% Aug-2017 204 +3.0% 208 -11.9% Sep-2017 205 +10.2% 243 +12.5% Oct-2017 249 +12.2% 329 +32.1% 12-Month Avg 191 +4.6% 242 +5.5% Historical Pending Sales by Month A count of the properties on which offers have been accepted in a given month. Current as of November 11, 2017.All data from the San Francisco MLS. Report © 2017 ShowingTime. | 5 266 283 222 249249 329 Single Family Condo/TIC/Coop October 0 100 200 300 400 1-2005 1-2006 1-2007 1-2008 1-2009 1-2010 1-2011 1-2012 1-2013 1-2014 1-2015 1-2016 1-2017 Single Family Condo/TIC/Coop 2,013 2,496 1,885 2,346 1,959 2,467 Single Family Condo/TIC/Coop Year to Date 2015 2016 2017 + 32.1%- 12.0%+ 12.2%- 16.5% - 6.0%+ 3.9%- 6.4% + 5.2% 2015 2016 2017 2015 2016 2017 2015 2016 2017 - 0.4% - 1.6% - 8.7%- 6.0%
  • 6. Sold Listings Sold Listings Single Family Year-Over-Year Change Condo/TIC/ Coop Year-Over-Year Change Nov-2016 206 +9.6% 263 +26.4% Dec-2016 200 -3.8% 238 -15.9% Jan-2017 106 +1.9% 150 +0.7% Feb-2017 111 +8.8% 156 -7.1% Mar-2017 173 +9.5% 286 +13.9% Apr-2017 203 -2.9% 232 +4.5% May-2017 218 +9.0% 271 +5.0% Jun-2017 230 -6.1% 324 +20.9% Jul-2017 210 +4.0% 239 -4.0% Aug-2017 211 +10.5% 216 -16.6% Sep-2017 175 -1.7% 172 -26.5% Oct-2017 231 +1.8% 305 +29.2% 12-Month Avg 190 +2.8% 238 +2.4% Historical Sold Listings by Month A count of the actual sales that closed in a given month. Current as of November 11, 2017.All data from the San Francisco MLS. Report © 2017 ShowingTime. | 6 244 266 227 236231 305 Single Family Condo/TIC/Coop October 0 100 200 300 400 1-2005 1-2006 1-2007 1-2008 1-2009 1-2010 1-2011 1-2012 1-2013 1-2014 1-2015 1-2016 1-2017 Single Family Condo/TIC/Coop 1,913 2,396 1,816 2,294 1,868 2,351 Single Family Condo/TIC/Coop Year to Date 2015 2016 2017 + 29.2%- 11.3%+ 1.8%- 7.0% - 4.3%+ 2.9%- 5.1% + 2.5% 2015 2016 2017 2015 2016 2017 2015 2016 2017 - 12.2% - 4.8% - 11.5%- 16.6%
  • 7. Median Sales Price Median Sales Price Single Family Year-Over-Year Change Condo/TIC/ Coop Year-Over-Year Change Nov-2016 $1,353,000 +7.2% $1,058,000 -6.0% Dec-2016 $1,301,511 +8.3% $1,011,000 -7.9% Jan-2017 $1,250,000 +7.1% $1,000,000 -5.7% Feb-2017 $1,290,000 -7.2% $1,192,500 +8.7% Mar-2017 $1,350,000 -0.2% $1,137,500 +3.9% Apr-2017 $1,380,000 0.0% $1,100,000 -4.3% May-2017 $1,475,000 +9.3% $1,163,088 +7.4% Jun-2017 $1,461,000 +10.3% $1,125,000 -4.3% Jul-2017 $1,400,000 +7.3% $1,150,000 +10.0% Aug-2017 $1,375,000 +10.0% $1,175,000 +10.8% Sep-2017 $1,320,000 +8.5% $1,097,500 +7.3% Oct-2017 $1,588,000 +13.4% $1,140,000 +0.2% 12-Month Avg* $1,380,000 +5.7% $1,105,500 +0.5% Historical Median Sales Price by Month Point at which half of the sales sold for more and half sold for less, not accounting for seller concessions, in a given month. * Median Sales Price for all properties from November 2016 through October 2017. This is not the average of the individual figures above. Current as of November 11, 2017.All data from the San Francisco MLS. Report © 2017 ShowingTime. | 7 $1,267,500 $1,100,000 $1,400,000 $1,137,500 $1,588,000 $1,140,000 Single Family Condo/TIC/Coop October $400,000 $600,000 $800,000 $1,000,000 $1,200,000 $1,400,000 $1,600,000 $1,800,000 1-2005 1-2006 1-2007 1-2008 1-2009 1-2010 1-2011 1-2012 1-2013 1-2014 1-2015 1-2016 1-2017 Single Family Condo/TIC/Coop $1,250,000 $1,075,000 $1,325,000 $1,096,618 $1,400,000 $1,125,000 Single Family Condo/TIC/Coop Year to Date 2015 2016 2017 + 0.2%+ 3.4%+ 13.4%+ 10.5% + 2.0%+ 5.7%+ 6.0% + 2.6% 2015 2016 2017 2015 2016 2017 2015 2016 2017 + 6.5% + 17.9% + 14.6%+ 15.2%
  • 8. Average Sales Price Avg. Sales Price Single Family Year-Over-Year Change Condo/TIC/ Coop Year-Over-Year Change Nov-2016 $1,767,029 +3.9% $1,140,559 -9.1% Dec-2016 $1,658,512 +10.8% $1,249,670 -0.0% Jan-2017 $1,633,150 +4.0% $1,161,831 -0.6% Feb-2017 $1,684,181 +4.5% $1,367,391 +13.1% Mar-2017 $1,891,127 +6.0% $1,283,105 +2.2% Apr-2017 $1,880,160 +6.3% $1,296,502 -5.2% May-2017 $1,835,738 +12.4% $1,344,317 +5.9% Jun-2017 $1,727,201 -1.4% $1,351,503 +10.9% Jul-2017 $1,738,803 +1.0% $1,242,918 +3.1% Aug-2017 $1,560,350 +1.5% $1,273,784 +3.6% Sep-2017 $1,615,801 +8.7% $1,224,376 +1.3% Oct-2017 $2,036,319 +1.8% $1,282,412 +1.5% 12-Month Avg* $1,763,232 +4.7% $1,272,389 +2.3% Historical Average Sales Price by Month Average sales price for all closed sales, not accounting for seller concessions, in a given month. * Avg. Sales Price for all properties from November 2016 through October 2017. This is not the average of the individual figures above. Current as of November 11, 2017.All data from the San Francisco MLS. Report © 2017 ShowingTime. | 8 $1,624,546 $1,184,400 $2,000,319 $1,263,882 $2,036,319 $1,282,412 Single Family Condo/TIC/Coop October $500,000 $750,000 $1,000,000 $1,250,000 $1,500,000 $1,750,000 $2,000,000 $2,250,000 1-2005 1-2006 1-2007 1-2008 1-2009 1-2010 1-2011 1-2012 1-2013 1-2014 1-2015 1-2016 1-2017 Single Family Condo/TIC/Coop $1,639,820 $1,239,508 $1,704,203 $1,242,497 $1,774,026 $1,289,436 Single Family Condo/TIC/Coop Year to Date 2015 2016 2017 + 1.5%+ 6.7%+ 1.8%+ 23.1% + 0.2%+ 4.1%+ 3.9% + 3.8% 2015 2016 2017 2015 2016 2017 2015 2016 2017 - 2.7% + 12.9% + 13.7%+ 11.0%
  • 9. Days on Market Until Sale Days on Market Single Family Year-Over-Year Change Condo/TIC/ Coop Year-Over-Year Change Nov-2016 38 +35.7% 40 +17.6% Dec-2016 41 +24.2% 48 +11.6% Jan-2017 42 +5.0% 59 +34.1% Feb-2017 34 +9.7% 36 +2.9% Mar-2017 31 +24.0% 32 +6.7% Apr-2017 26 -18.8% 32 -15.8% May-2017 24 -7.7% 33 0.0% Jun-2017 27 -6.9% 37 +5.7% Jul-2017 24 -25.0% 33 -15.4% Aug-2017 27 -18.2% 40 -13.0% Sep-2017 28 -31.7% 43 +7.5% Oct-2017 22 -18.5% 31 -8.8% 12-Month Avg* 29 -5.0% 38 +0.2% Historical Days on Market Until Sale by Month Average number of days between when a property is listed and when an offer is accepted in a given month. * Days on Market for all properties from November 2016 through October 2017. This is not the average of the individual figures above. Current as of November 11, 2017.All data from the San Francisco MLS. Report © 2017 ShowingTime. | 9 27 2627 34 22 31 Single Family Condo/TIC/Coop October 20 40 60 80 100 120 1-2005 1-2006 1-2007 1-2008 1-2009 1-2010 1-2011 1-2012 1-2013 1-2014 1-2015 1-2016 1-2017 Single Family Condo/TIC/Coop 27 3031 37 27 36 Single Family Condo/TIC/Coop Year to Date 2015 2016 2017 - 8.8%+ 30.8%- 18.5%0.0% + 23.3%- 12.9%+ 14.8% - 2.7% 2015 2016 2017 2015 2016 2017 2015 2016 2017 - 10.0% - 10.0% - 11.8%- 29.7%
  • 10. Inventory of Active Listings Active Listings Single Family Year-Over-Year Change Condo/TIC/ Coop Year-Over-Year Change Nov-2016 383 +5.5% 591 +8.8% Dec-2016 260 +13.0% 405 +7.7% Jan-2017 322 +7.7% 555 +12.1% Feb-2017 358 -7.5% 629 +13.1% Mar-2017 392 -12.5% 633 -3.5% Apr-2017 421 -13.4% 645 -11.0% May-2017 436 -6.6% 660 -11.6% Jun-2017 393 -11.1% 615 -23.5% Jul-2017 396 -14.5% 600 -16.8% Aug-2017 367 -11.8% 591 -13.5% Sep-2017 421 -20.7% 723 -12.4% Oct-2017 363 -25.9% 618 -22.8% 12-Month Avg* 376 -10.2% 605 -8.4% Historical Inventory of Active Listings by Month The number of properties available for sale in active status at the end of a given month. * Active Listings for all properties from November 2016 through October 2017. This is not the average of the individual figures above. Current as of November 11, 2017.All data from the San Francisco MLS. Report © 2017 ShowingTime. | 10 441 656 490 800 363 618 Single Family Condo/TIC/Coop October 200 400 600 800 1,000 1,200 1,400 1,600 1-2005 1-2006 1-2007 1-2008 1-2009 1-2010 1-2011 1-2012 1-2013 1-2014 1-2015 1-2016 1-2017 Single Family Condo/TIC/Coop 2015 2016 2017 - 22.8%+ 22.0%- 25.9%+ 11.1% 2015 2016 2017 + 2.3% + 16.1%
  • 11. % of Properties Sold Over List Price % of Properties Sold Over List Price Single Family Year-Over-Year Change Condo/TIC/ Coop Year-Over-Year Change Nov-2016 72.8% -6.3% 63.1% -8.8% Dec-2016 69.0% -13.0% 42.0% -29.3% Jan-2017 62.3% -18.0% 38.7% -27.0% Feb-2017 78.4% +1.2% 58.3% 0.0% Mar-2017 74.6% -9.4% 62.2% -8.1% Apr-2017 77.3% +2.2% 62.1% +2.8% May-2017 78.9% -0.8% 61.3% -9.1% Jun-2017 80.0% +11.4% 58.6% -6.5% Jul-2017 81.4% +6.8% 62.8% +7.2% Aug-2017 79.1% +4.2% 61.6% +23.7% Sep-2017 86.3% +11.4% 53.5% -8.5% Oct-2017 83.1% +5.3% 66.9% +24.3% 12-Month Avg 77.6% +0.5% 58.6% -2.5% Historical % of Properties Sold Over List Price by Month Percentage found when dividing the number of properties sold by properties sold over its original list price, not accounting for seller concessions. * % of Properties Sold Over List Price for all properties from November 2016 through October 2017. This is not the average of the individual figures above. Current as of November 11, 2017.All data from the San Francisco MLS. Report © 2017 ShowingTime. | 11 83.2% 76.3%78.9% 53.8% 83.1% 66.9% Single Family Condo/TIC/Coop October 0.0% 20.0% 40.0% 60.0% 80.0% 100.0% 1-2005 1-2006 1-2007 1-2008 1-2009 1-2010 1-2011 1-2012 1-2013 1-2014 1-2015 1-2016 1-2017 Single Family Condo/TIC/Coop 83.1% 71.7% 76.9% 59.4% 79.0% 59.8% Single Family Condo/TIC/Coop Year to Date 2015 2016 2017 + 24.3%- 29.5%+ 5.3%- 5.2% - 17.2%+ 2.7%- 7.5% + 0.7% 2015 2016 2017 2015 2016 2017 2015 2016 2017 + 1.0% + 3.1% + 4.4%+ 10.1%
  • 12. % of List Price Received % of List Price Received Single Family Year-Over-Year Change Condo/TIC/ Coop Year-Over-Year Change Nov-2016 109.1% -2.9% 104.6% -2.7% Dec-2016 108.4% -3.5% 101.5% -2.7% Jan-2017 107.6% -3.1% 101.4% -2.3% Feb-2017 113.8% +1.1% 104.1% -1.7% Mar-2017 112.4% -2.0% 105.0% -1.2% Apr-2017 115.4% +1.9% 105.1% -0.1% May-2017 115.3% +0.1% 105.4% -0.7% Jun-2017 116.8% +5.9% 105.8% +0.5% Jul-2017 117.1% +4.7% 106.0% +1.1% Aug-2017 115.6% +3.7% 105.8% +2.8% Sep-2017 116.3% +5.0% 104.9% +0.6% Oct-2017 115.3% +3.7% 106.7% +2.4% 12-Month Avg* 113.9% +1.5% 104.9% -0.1% Historical % of List Price Received by Month Percentage found when dividing a property’s sales price by its most recent list price, then taking the average for all properties sold in a given month, not accounting for seller concessions. * % of List Price Received for all properties from November 2016 through October 2017. This is not the average of the individual figures above. Current as of November 11, 2017.All data from the San Francisco MLS. Report © 2017 ShowingTime. | 12 114.5% 109.3%111.2% 104.2% 115.3% 106.7% Single Family Condo/TIC/Coop October 116.0% 109.3%112.2% 104.9% 115.0% 105.2% Single Family Condo/TIC/Coop Year to Date 95.0% 100.0% 105.0% 110.0% 115.0% 120.0% 1-2005 1-2006 1-2007 1-2008 1-2009 1-2010 1-2011 1-2012 1-2013 1-2014 1-2015 1-2016 1-2017 Single Family Condo/TIC/Coop 2015 2016 2017 + 2.4%- 4.7%+ 3.7%- 2.9% 2015 2016 2017 + 1.3% + 2.2% 2015 2016 2017 + 0.3%- 4.0%+ 2.5%- 3.3% 2015 2016 2017 + 2.9% + 2.0%
  • 13. Housing Affordability Ratio Affordability Ratio Single Family Year-Over-Year Change Condo/TIC/ Coop Year-Over-Year Change Nov-2016 38 0.0% 56 +12.0% Dec-2016 38 -5.0% 56 +9.8% Jan-2017 39 -11.4% 56 0.0% Feb-2017 39 +2.6% 49 -12.5% Mar-2017 37 -5.1% 51 -8.9% Apr-2017 37 -2.6% 54 +1.9% May-2017 35 -10.3% 52 -7.1% Jun-2017 35 -12.5% 53 0.0% Jul-2017 37 -9.8% 52 -11.9% Aug-2017 38 -11.6% 52 -11.9% Sep-2017 39 -11.4% 55 -9.8% Oct-2017 32 -17.9% 52 -7.1% 12-Month Avg* 37 -20.3% 40 -6.3% Historical Housing Affordability Ratio by Month This index measures housing affordability for the region. For example, an index of 120 means the median household income is 120% of what is necessary to qualify for the median-priced home under prevailing interest rates. A higher number means greater affordability. * Affordability Ratio for all properties from November 2016 through October 2017. This is not the average of the individual figures above. Current as of November 11, 2017.All data from the San Francisco MLS. Report © 2017 ShowingTime. | 13 38 51 39 56 32 52 Single Family Condo/TIC/Coop October 30 40 50 60 70 80 90 100 1-2005 1-2006 1-2007 1-2008 1-2009 1-2010 1-2011 1-2012 1-2013 1-2014 1-2015 1-2016 1-2017 Single Family Condo/TIC/Coop 2015 2016 2017 - 7.1%+ 9.8%- 17.9%+ 2.6% 2015 2016 2017 - 2.6% - 7.3% 39 53 41 58 37 53 Single Family Condo/TIC/Coop Year to Date 2015 2016 2017 - 8.6%+ 9.4%- 9.8%+ 5.1% 2015 2016 2017 - 9.3% - 5.4%
  • 14. Months Supply of Inventory Months Supply Single Family Year-Over-Year Change Condo/TIC/ Coop Year-Over-Year Change Nov-2016 2.1 +10.5% 2.5 +13.6% Dec-2016 1.4 +16.7% 1.7 +6.3% Jan-2017 1.7 +6.3% 2.4 +20.0% Feb-2017 1.9 -5.0% 2.7 +17.4% Mar-2017 2.1 -12.5% 2.7 -3.6% Apr-2017 2.3 -11.5% 2.7 -12.9% May-2017 2.4 -4.0% 2.8 -12.5% Jun-2017 2.1 -8.7% 2.6 -25.7% Jul-2017 2.1 -16.0% 2.5 -19.4% Aug-2017 2.0 -9.1% 2.5 -13.8% Sep-2017 2.2 -24.1% 3.1 -11.4% Oct-2017 1.9 -29.6% 2.5 -28.6% 12-Month Avg* 2.0 -9.0% 2.6 -8.5% Historical Months Supply of Inventory by Month The inventory of homes for sale at the end of a given month, divided by the average monthly pending sales from the last 12 months. * Months Supply for all properties from November 2016 through October 2017. This is not the average of the individual figures above. Current as of November 11, 2017.All data from the San Francisco MLS. Report © 2017 ShowingTime. | 14 2.2 2.72.7 3.5 1.9 2.5 Single Family Condo/TIC/Coop October 0.0 2.0 4.0 6.0 8.0 10.0 1-2005 1-2006 1-2007 1-2008 1-2009 1-2010 1-2011 1-2012 1-2013 1-2014 1-2015 1-2016 1-2017 Single Family Condo/TIC/Coop 2015 2016 2017 - 28.6%+ 29.6%- 29.6%+ 22.7% 2015 2016 2017 + 4.8% + 28.6%
  • 15. All Properties Activity Overview Key metrics by report month and for year-to-date (YTD) starting from the first of the year. Key Metrics Historical Sparkbars 10-2016 10-2017 Percent Change YTD 2016 YTD 2017 Percent Change Current as of November 11, 2017.All data from the San Francisco MLS. Report © 2017 ShowingTime. | 15 Months Supply 3.1 2.3 - 25.8% -- -- -- Affordability Ratio 39 37 - 5.1% % of List Price Received 107.6% 110.4% + 2.6% 108.1% 44 68.3% + 1.8% + 1.4% 40 - 9.1% 109.6% % of Properties Sold Over List Price 66.1% 73.9% + 11.8% 67.1% Active Listings 1,290 981 - 24.0% -- Avg. Sales Price $1,624,943 $1,607,323 - 1.1% $1,446,501 Days on Market 31 27 - 12.9% 34 $1,250,000 + 4.2% + 4.0% 32 - 5.9% $1,503,992 -- -- Sold Listings 463 536 + 15.8% 4,110 4,219 + 2.7% Median Sales Price $1,250,000 $1,292,500 + 3.4% $1,200,000 - 5.9% Pending Sales 471 578 + 22.7% 4,231 4,426 + 4.6% New Listings 522 514 - 1.5% 5,923 5,572 10-2014 10-2015 10-2016 10-2017 10-2014 10-2015 10-2016 10-2017 10-2014 10-2015 10-2016 10-2017 10-2014 10-2015 10-2016 10-2017 10-2014 10-2015 10-2016 10-2017 10-2014 10-2015 10-2016 10-2017 10-2014 10-2015 10-2016 10-2017 10-2014 10-2015 10-2016 10-2017 10-2014 10-2015 10-2016 10-2017 10-2014 10-2015 10-2016 10-2017 10-2014 10-2015 10-2016 10-2017
  • 16. Activity by District SF District 1: Northwest (Sea Cliff, Lake, Jordan Park / Laurel Heights, Outer Richmond, Central Richmond, Inner Richmond, Lone Mountain) SF District 2: Central West (Outer Sunset, Central Sunset, Inner Sunset, Outer Parkside, Parkside, Inner Parkside, Golden Gate Heights) SF District 3: Southwest (Pine Lake Park, Lake Shore, Merced Manor, Stonestown, Lakeside, Merced Heights, Ingleside, Ingleside Heights, Oceanview) SF District 4: Twin Peaks W (Forest Hill (& Ext), W Portal, St Francis Wd, Balboa Terr, Mt Dav Manor, Ingleside Terr, Monterey Hts, Wstwd Pk & H'lnds, Shrwd Fst, Miraloma Pk, Dmnd Hts, Mdtwn Terr) SF District 5: Central (Haight Ashbury, Cole Vly / Prnssus Hts, Clarndn Hts, Corona Hts, Twin Pks, Glen Pk, Noe Vly, Eureka Vly / Dolores Hts, Mission Dolores, Duboce Trngl, Buena Vista / Ashbury Hts) SF District 6: Central North (Lower Pacific Heights, Anza Vista, Western Addition, North Panhandle, Alamo Square, Hayes Valley) SF District 7: North (Marina, Cow Hollow, Presidio Heights, Pacific Heights) SF District 8: Northeast (North Waterfront, North Beach, Russian Hill, Telegraph Hill, Nob Hill, Financial District / Barbary Coast, Downtown, Van Ness / Civic Center, Tenderloin) SF District 9: Central East (Yerba Buena, South Beach, South of Market, Mission Bay, Inner Mission, Potrero Hill, Central Waterfront / Dogpatch, Bernal Heights) SF District 10: Southeast (Outer Mission, Mission Terr, Excelsior, Portola, Bayview, Silver Terr, Hunters Pt, Candlestick Pt, Bayview Hts, Little Hollywood, Visitation Vly, Crocker Amazon) 10-2016 10-2017 + / – 10-2016 10-2017 + / – 10-2016 10-2017 + / – 10-2016 10-2017 + / – 10-2016 10-2017 + / – Single Family 1 SF District 1 42 22 -47.6% 21 21 0.0% $1,811,410 $1,825,000 +0.8% 19 19 0.0% 3.0 1.6 -46.7% 2 SF District 2 53 35 -34.0% 37 30 -18.9% $1,200,000 $1,537,500 +28.1% 25 19 -24.0% 1.6 1.0 -37.5% 3 SF District 3 33 20 -39.4% 20 17 -15.0% $925,000 $1,015,000 +9.7% 27 35 +29.6% 2.1 1.4 -33.3% 4 SF District 4 54 42 -22.2% 30 29 -3.3% $1,462,500 $1,650,000 +12.8% 26 16 -38.5% 2.1 1.6 -23.8% 5 SF District 5 88 52 -40.9% 35 37 +5.7% $2,200,000 $2,250,000 +2.3% 24 23 -4.2% 3.5 1.9 -45.7% 6 SF District 6 10 14 +40.0% 10 6 -40.0% $2,350,000 $2,563,000 +9.1% 20 11 -45.0% 3.2 4.8 +50.0% 7 SF District 7 42 36 -14.3% 15 15 0.0% $6,000,000 $5,625,000 -6.3% 40 26 -35.0% 4.8 4.5 -6.3% 8 SF District 8 11 14 +27.3% 2 4 +100.0% $2,370,945 $3,147,500 +32.8% 12 11 -8.3% 5.1 5.5 +7.8% 9 SF District 9 60 46 -23.3% 24 28 +16.7% $1,457,500 $1,652,500 +13.4% 18 16 -11.1% 2.9 2.1 -27.6% 10 SF District 10 97 82 -15.5% 33 44 +33.3% $875,000 $956,000 +9.3% 41 30 -26.8% 2.8 2.0 -28.6% Condo/TIC/Coop 1 SF District 1 31 28 -9.7% 8 20 +150.0% $1,264,992 $1,117,500 -11.7% 36 31 -13.9% 2.6 2.8 +7.7% 2 SF District 2 14 8 -42.9% 3 3 0.0% $1,500,000 $1,100,000 -26.7% 15 40 +166.7% 3.2 2.5 -21.9% 3 SF District 3 9 4 -55.6% 4 1 -75.0% $884,000 $540,000 -38.9% 26 19 -26.9% 2.4 1.3 -45.8% 4 SF District 4 10 14 +40.0% 2 2 0.0% $662,500 $515,565 -22.2% 20 20 0.0% 4.4 4.5 +2.3% 5 SF District 5 91 55 -39.6% 47 54 +14.9% $1,300,000 $1,331,632 +2.4% 29 20 -31.0% 2.7 1.5 -44.4% 6 SF District 6 103 77 -25.2% 25 15 -40.0% $929,000 $1,100,000 +18.4% 29 21 -27.6% 3.9 2.9 -25.6% 7 SF District 7 92 56 -39.1% 20 29 +45.0% $1,597,500 $1,275,000 -20.2% 20 17 -15.0% 4.1 2.0 -51.2% 8 SF District 8 132 112 -15.2% 47 55 +17.0% $1,088,000 $1,100,000 +1.1% 36 32 -11.1% 3.4 2.8 -17.6% 9 SF District 9 292 239 -18.2% 73 115 +57.5% $1,050,000 $1,099,000 +4.7% 43 38 -11.6% 3.6 2.8 -22.2% 10 SF District 10 26 25 -3.8% 7 11 +57.1% $710,000 $730,000 +2.8% 41 51 +24.4% 4.3 3.2 -25.6% Key metrics by report month for the districts of San Fransisco. Current as of November 11, 2017.All data from the San Francisco MLS. Report © 2017 ShowingTime. | 16 Active Listings Sold Listings Median Sales Price Days on Market Months Supply