San Francisco Market Data December 2014
•
1 like•460 views

San Francisco Market Data December 2014

Recommended
Recommended
More Related Content
What's hot
What's hot (20)
Viewers also liked
Viewers also liked (8)
Similar to San Francisco Market Data December 2014
Similar to San Francisco Market Data December 2014 (20)
More from Ronny Budiutama
More from Ronny Budiutama (20)
Recently uploaded
Recently uploaded (20)
San Francisco Market Data December 2014
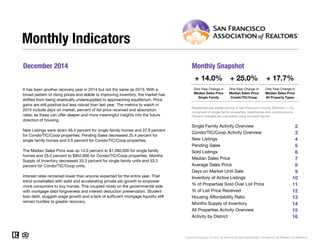
- 1. December 2014 Monthly Snapshot One-Year Change in One-Year Change in Median Sales Price Single Family Median Sales Price Condo/TIC/Coop 2 Monthly Indicators + 14.0% + 25.0% + 17.7% One-Year Change inIt has been another recovery year in 2014 but not the same as 2013. With a broad pattern of rising prices and stable to improving inventory, the market has shifted from being drastically undersupplied to approaching equilibrium. Price gains are still positive but less robust than last year. The metrics to watch in 2015 include days on market, percent of list price received and absorption rates, as these can offer deeper and more meaningful insights into the future direction of housing. Median Sales Price All Property Types Residential real estate activity in San Francisco County (Districts 1-10), comprised of single-family properties, townhomes and condominiums. Percent changes are calculated using rounded figures. Single Family Activity Overview 2 3 4 5 6 7 8 9 10 11 12 13 14 15 16 Current as of January 12, 2015. All data from the San Francisco MLS. Powered by 10K Research and Marketing. Condo/TIC/Coop Activity Overview Inventory of Active Listings % of Properties Sold Over List Price % of List Price Received Housing Affordability Ratio All Properties Activity Overview New Listings Pending Sales Sold Listings Median Sales Price Average Sales Price Days on Market Until Sale Activity by District New Listings were down 46.4 percent for single family homes and 37.9 percent for Condo/TIC/Coop properties. Pending Sales decreased 25.4 percent for single family homes and 0.5 percent for Condo/TIC/Coop properties. The Median Sales Price was up 14.0 percent to $1,080,000 for single family homes and 25.0 percent to $952,800 for Condo/TIC/Coop properties. Months Supply of Inventory decreased 33.3 percent for single family units and 33.3 percent for Condo/TIC/Coop units. Interest rates remained lower than anyone expected for the entire year. That trend snowballed with solid and accelerating private job growth to empower more consumers to buy homes. This coupled nicely on the governmental side with mortgage debt forgiveness and interest deduction preservation. Student loan debt, sluggish wage growth and a lack of sufficient mortgage liquidity still remain hurdles to greater recovery. Single Family Activity Overview Months Supply of Inventory
- 2. Single Family Activity Overview Key metrics by report month and for year-to-date (YTD) starting from the first of the year. Key Metrics Historical Sparkbars 12-2013 12-2014 Percent Change YTD 2013 YTD 2014 Percent Change - 9.8%2,695 2,393 - 10.1% $1,075,000 + 18.0% + 12.5% Pending Sales 173 129 - 25.4% - 8.8%2,630 2,398 New Listings 112 60 - 46.4% 2,989 Sold Listings 216 185 - 14.4% 2,662 Median Sales Price $947,000 $1,080,000 + 14.0% $910,750 $1,454,944Avg. Sales Price $1,376,546 $1,370,699 - 0.4% $1,293,474 12-2011 12-2012 12-2013 12-2014 12-2011 12-2012 12-2013 12-2014 12-2011 12-2012 12-2013 12-2014 12-2011 12-2012 12-2013 12-2014 12-2011 12-2012 12-2013 12-2014 32 - 11.1% -- -- Days on Market 42 40 - 4.8% 36 Active Listings 273 159 - 41.8% -- % of Properties Sold Over List Price 64.8% 74.1% + 14.4% 76.0% 51 80.1% + 5.4% + 2.3% 43 - 15.7% 112.3%% of List Price Received 106.8% 109.2% + 2.2% 109.8% Current as of January 12, 2015. All data from the San Francisco MLS. Powered by 10K Research and Marketing. | Click for Cover Page | 2 Months Supply 1.2 0.8 - 33.3% -- -- -- Affordability Ratio 49 43 - 12.2% 12-2011 12-2012 12-2013 12-2014 12-2011 12-2012 12-2013 12-2014 12-2011 12-2012 12-2013 12-2014 12-2011 12-2012 12-2013 12-2014 12-2011 12-2012 12-2013 12-2014 12-2011 12-2012 12-2013 12-2014 12-2011 12-2012 12-2013 12-2014
- 3. Condo/TIC/Coop Activity Overview Key metrics by report month and for year-to-date (YTD) starting from the first of the year. Key Metrics Historical Sparkbars 12-2013 12-2014 Percent Change YTD 2013 YTD 2014 Percent Change - 7.6% Pending Sales 202 201 - 0.5% 3,351 3,159 - 5.7% New Listings 116 72 - 37.9% 3,887 3,593 Sold Listings 246 217 - 11.8% 3,333 3,135 - 5.9% Median Sales Price $762,500 $952,800 + 25.0% $820,000 $945,000 + 15.2% + 14.1%$1,098,346Avg. Sales Price $1,020,083 $1,153,534 + 13.1% $962,394 12-2011 12-2012 12-2013 12-2014 12-2011 12-2012 12-2013 12-2014 12-2011 12-2012 12-2013 12-2014 12-2011 12-2012 12-2013 12-2014 12-2011 12-2012 12-2013 12-2014 37 - 9.8% -- -- Days on Market 44 50 + 13.6% 41 Active Listings 337 199 - 40.9% -- % of Properties Sold Over List Price 54.1% 54.4% + 0.6% 64.5% 65 67.6% + 4.8% + 1.5% 57 - 12.3% 106.9%% of List Price Received 103.4% 103.5% + 0.1% 105.3% Current as of January 12, 2015. All data from the San Francisco MLS. Powered by 10K Research and Marketing. | Click for Cover Page | 3 Months Supply 1.2 0.8 - 33.3% -- -- -- Affordability Ratio 69 56 - 18.8% 12-2011 12-2012 12-2013 12-2014 12-2011 12-2012 12-2013 12-2014 12-2011 12-2012 12-2013 12-2014 12-2011 12-2012 12-2013 12-2014 12-2011 12-2012 12-2013 12-2014 12-2011 12-2012 12-2013 12-2014 12-2011 12-2012 12-2013 12-2014
- 4. New Listings New Listings Single Family Year-Over-Year Change Condo/TIC/ Coop Year-Over-Year Change Jan-2014 207 +1.5% 338 +8.7% Feb-2014 196 -7.1% 304 -3.8% Mar-2014 235 -7.5% 303 -18.1% Apr-2014 243 -19.5% 368 -7.1% May-2014 274 -19.2% 356 -7.3% Jun-2014 280 -4.4% 358 -0.3% Jul-2014 267 +3.1% 351 +5.7% Aug-2014 223 -18.0% 272 -20.2% Sep-2014 351 +19.0% 388 -13.8% Oct-2014 245 -11.6% 328 +2.2% Nov-2014 114 -33.3% 155 -18.8% Dec-2014 60 -46.4% 72 -37.9% 12-Month Avg 225 -9.8% 299 -7.6% A count of the properties that have been newly listed on the market in a given month. 102 114112 116 60 72 December 2,972 3,590 2,989 3,887 2,695 3,593 Year to Date 2012 2013 2014 - 37 9%+ 1 8%46 4%+ 9 8% + 8 3%9 8%+ 0 6% 7 6% 2012 2013 2014 2012 2013 2014 2012 2013 2014 12 8% 11 5% 6 0%+ 2 7% 12 Month Avg 225 9.8% 299 7.6% Historical New Listings by Month Current as of January 12, 2015. All data from the San Francisco MLS. Powered by 10K Research and Marketing. | Click for Cover Page | 4 Single Family Condo/TIC/Coop 0 100 200 300 400 500 600 700 1-2005 1-2006 1-2007 1-2008 1-2009 1-2010 1-2011 1-2012 1-2013 1-2014 Single Family Condo/TIC/Coop Single Family Condo/TIC/Coop 2012 2013 2014 - 37.9%+ 1.8%- 46.4%+ 9.8% + 8.3%- 9.8%+ 0.6% - 7.6% 2012 2013 2014 2012 2013 2014 2012 2013 2014 - 12.8% - 11.5% - 6.0%+ 2.7%
- 5. Pending Sales Pending Sales Single Family Year-Over-Year Change Condo/TIC/ Coop Year-Over-Year Change Jan-2014 132 -16.5% 185 +6.3% Feb-2014 166 +11.4% 251 +15.7% Mar-2014 217 +4.8% 295 -2.3% Apr-2014 209 -13.6% 294 -4.9% May-2014 216 -19.7% 296 -17.8% Jun-2014 201 -27.4% 307 +5.9% Jul-2014 227 -8.5% 277 -16.6% Aug-2014 204 -10.9% 265 -12.3% Sep-2014 214 +1.9% 268 +5.5% Oct-2014 271 +11.1% 300 -11.8% Nov-2014 212 -5.4% 220 -18.2% Dec-2014 129 -25.4% 201 -0.5% 12-Month Avg 200 -8.8% 263 -5.7% A count of the properties on which offers have been accepted in a given month. 170 203 173 202 129 201 December 2,647 3,154 2,630 3,351 2,398 3,159 Year to Date 2012 2013 2014 - 0 5%- 0 5%25 4%+ 1 8% + 6 2%8 8%0 6% 5 7% 2012 2013 2014 2012 2013 2014 2012 2013 2014 1 7% + 6 6% + 22 4%+ 23 0% 12 Month Avg 200 8.8% 263 5.7% Historical Pending Sales by Month Current as of January 12, 2015. All data from the San Francisco MLS. Powered by 10K Research and Marketing. | Click for Cover Page | 5 Single Family Condo/TIC/Coop 0 100 200 300 400 1-2005 1-2006 1-2007 1-2008 1-2009 1-2010 1-2011 1-2012 1-2013 1-2014 Single Family Condo/TIC/Coop Single Family Condo/TIC/Coop 2012 2013 2014 - 0.5%- 0.5%- 25.4%+ 1.8% + 6.2%- 8.8%- 0.6% - 5.7% 2012 2013 2014 2012 2013 2014 2012 2013 2014 - 1.7% + 6.6% + 22.4%+ 23.0%
- 6. Sold Listings Sold Listings Single Family Year-Over-Year Change Condo/TIC/ Coop Year-Over-Year Change Jan-2014 133 -17.4% 180 +15.4% Feb-2014 157 +21.7% 222 +13.8% Mar-2014 177 -14.5% 268 -5.0% Apr-2014 207 -6.8% 327 +7.6% May-2014 230 -8.7% 295 -22.4% Jun-2014 192 -29.7% 285 +2.9% Jul-2014 229 -17.9% 276 -19.1% Aug-2014 210 -11.8% 287 -5.3% Sep-2014 195 +3.2% 246 +7.4% Oct-2014 279 +9.0% 318 -5.4% Nov-2014 199 -17.1% 214 -24.6% Dec-2014 185 -14.4% 217 -11.8% 12-Month Avg 199 -10.1% 261 -5.9% A count of the actual sales that closed in a given month. 209 251 216 246 185 217 December 2,634 3,169 2,662 3,333 2,393 3,135 Year to Date 2012 2013 2014 - 11 8%- 2 0%14 4%+ 3 3% + 5 2%10 1%+ 1 1% 5 9% 2012 2013 2014 2012 2013 2014 2012 2013 2014 9 5% + 6 4% + 23 4%+ 26 1% 12 Month Avg 199 10.1% 261 5.9% Historical Sold Listings by Month Current as of January 12, 2015. All data from the San Francisco MLS. Powered by 10K Research and Marketing. | Click for Cover Page | 6 Single Family Condo/TIC/Coop 0 100 200 300 400 1-2005 1-2006 1-2007 1-2008 1-2009 1-2010 1-2011 1-2012 1-2013 1-2014 Single Family Condo/TIC/Coop Single Family Condo/TIC/Coop 2012 2013 2014 - 11.8%- 2.0%- 14.4%+ 3.3% + 5.2%- 10.1%+ 1.1% - 5.9% 2012 2013 2014 2012 2013 2014 2012 2013 2014 - 9.5% + 6.4% + 23.4%+ 26.1%
- 7. Median Sales Price Median Sales Price Single Family Year-Over-Year Change Condo/TIC/ Coop Year-Over-Year Change Jan-2014 $925,000 +24.2% $950,000 +24.6% Feb-2014 $1,050,000 +31.2% $937,000 +24.9% Mar-2014 $985,000 +7.1% $965,000 +17.3% Apr-2014 $1,100,000 +10.0% $905,000 +7.1% May-2014 $1,090,500 +7.2% $940,000 +13.3% Jun-2014 $1,175,000 +25.3% $960,000 +23.1% Jul-2014 $1,082,000 +24.4% $944,500 +11.1% Aug-2014 $964,000 +3.2% $930,000 +14.8% Sep-2014 $1,040,000 +12.1% $915,000 +10.8% Oct-2014 $1,190,000 +31.5% $952,500 +10.2% Nov-2014 $1,140,000 +19.1% $1,020,000 +23.5% Dec-2014 $1,080,000 +14.0% $952,800 +25.0% 12-Month Avg* $1,075,000 +18.0% $945,000 +15.2% Point at which half of the sales sold for more and half sold for less, not accounting for seller concessions, in a given month. $835,000 $699,000 $947,000 $762,500 $1,080,000 $952,800 December $760,000 $708,000 $910,750 $820,000 $1,075,000 $945,000 Year to Date 2012 2013 2014 + 25 0%+ 9 1%+ 14 0%+ 13 4% + 15 8%+ 18 0%+ 19 8% + 15 2% 2012 2013 2014 2012 2013 2014 2012 2013 2014 + 36 9% + 10 1% + 12 6%+ 11 8% 12 Month Avg $1,075,000 +18.0% $945,000 +15.2% Historical Median Sales Price by Month * Median Sales Price for all properties from January 2014 through December 2014. This is not the average of the individual figures above. Current as of January 12, 2015. All data from the San Francisco MLS. Powered by 10K Research and Marketing. | Click for Cover Page | 7 Single Family Condo/TIC/Coop $500,000 $600,000 $700,000 $800,000 $900,000 $1,000,000 $1,100,000 $1,200,000 1-2005 1-2006 1-2007 1-2008 1-2009 1-2010 1-2011 1-2012 1-2013 1-2014 Single Family Condo/TIC/Coop Single Family Condo/TIC/Coop 2012 2013 2014 + 25.0%+ 9.1%+ 14.0%+ 13.4% + 15.8%+ 18.0%+ 19.8% + 15.2% 2012 2013 2014 2012 2013 2014 2012 2013 2014 + 36.9% + 10.1% + 12.6%+ 11.8%
- 8. Average Sales Price Avg. Sales Price Single Family Year-Over-Year Change Condo/TIC/ Coop Year-Over-Year Change Jan-2014 $1,238,831 +36.1% $1,126,706 +35.3% Feb-2014 $1,462,472 +25.4% $994,160 +13.6% Mar-2014 $1,423,755 +4.3% $1,059,955 +11.2% Apr-2014 $1,510,889 +10.9% $1,114,835 +14.6% May-2014 $1,459,316 -2.1% $1,160,115 +18.4% Jun-2014 $1,597,260 +33.9% $1,169,090 +25.7% Jul-2014 $1,408,308 +10.1% $1,093,443 +7.4% Aug-2014 $1,326,633 +1.9% $1,092,040 +17.5% Sep-2014 $1,330,906 +8.0% $1,014,968 +7.8% Oct-2014 $1,670,076 +23.9% $1,068,872 +6.0% Nov-2014 $1,509,296 +14.0% $1,124,689 +14.9% Dec-2014 $1,370,699 -0.4% $1,153,534 +13.1% 12-Month Avg* $1,454,944 +12.5% $1,098,346 +14.1% Average sales price for all closed sales, not accounting for seller concessions, in a given month. $1,385,197 $855,315 $1,376,546 $1,020,083 $1,370,699 $1,153,534 December $1,104,071 $818,439 $1,293,474 $962,394 $1,454,944 $1,098,346 Year to Date 2012 2013 2014 + 13 1%+ 19 3%0 4%0 6% + 17 6%+ 12 5%+ 17 2% + 14 1% 2012 2013 2014 2012 2013 2014 2012 2013 2014 + 68 4% + 16 4% + 10 3%+ 3 6% 12 Month Avg $1,454,944 +12.5% $1,098,346 +14.1% Historical Average Sales Price by Month * Avg. Sales Price for all properties from January 2014 through December 2014. This is not the average of the individual figures above. Current as of January 12, 2015. All data from the San Francisco MLS. Powered by 10K Research and Marketing. | Click for Cover Page | 8 Single Family Condo/TIC/Coop $600,000 $800,000 $1,000,000 $1,200,000 $1,400,000 $1,600,000 $1,800,000 1-2005 1-2006 1-2007 1-2008 1-2009 1-2010 1-2011 1-2012 1-2013 1-2014 Single Family Condo/TIC/Coop Single Family Condo/TIC/Coop 2012 2013 2014 + 13.1%+ 19.3%- 0.4%- 0.6% + 17.6%+ 12.5%+ 17.2% + 14.1% 2012 2013 2014 2012 2013 2014 2012 2013 2014 + 68.4% + 16.4% + 10.3%+ 3.6%
- 9. Days on Market Until Sale Days on Market Single Family Year-Over-Year Change Condo/TIC/ Coop Year-Over-Year Change Jan-2014 40 -18.4% 51 -19.0% Feb-2014 38 -7.3% 40 -18.4% Mar-2014 32 -17.9% 32 -23.8% Apr-2014 35 0.0% 33 -19.5% May-2014 26 -18.8% 29 -19.4% Jun-2014 27 -22.9% 36 -5.3% Jul-2014 30 -9.1% 34 -12.8% Aug-2014 29 -23.7% 34 -10.5% Sep-2014 27 -10.0% 39 +5.4% Oct-2014 31 -8.8% 38 0.0% Nov-2014 31 -8.8% 39 -4.9% Dec-2014 40 -4.8% 50 +13.6% 12-Month Avg* 32 -12.3% 37 -9.3% Average number of days between when a property is listed and when an offer is accepted in a given month. 48 61 42 44 40 50 December 53 62 36 41 32 37 Year to Date 2012 2013 2014 + 13 6%- 27 9%4 8%12 5% 33 9%11 1%32 1% 9 8% 2012 2013 2014 2012 2013 2014 2012 2013 2014 23 8% 15 9% 22 5%- 28 2% 12 Month Avg 32 12.3% 37 9.3% Historical Days on Market Until Sale by Month * Days on Market for all properties from January 2014 through December 2014. This is not the average of the individual figures above. Current as of January 12, 2015. All data from the San Francisco MLS. Powered by 10K Research and Marketing. | Click for Cover Page | 9 Single Family Condo/TIC/Coop 20 40 60 80 100 120 1-2005 1-2006 1-2007 1-2008 1-2009 1-2010 1-2011 1-2012 1-2013 1-2014 Single Family Condo/TIC/Coop Single Family Condo/TIC/Coop 2012 2013 2014 + 13.6%- 27.9%- 4.8%- 12.5% - 33.9%- 11.1%- 32.1% - 9.8% 2012 2013 2014 2012 2013 2014 2012 2013 2014 - 23.8% - 15.9% - 22.5%- 28.2%
- 10. Inventory of Active Listings Active Listings Single Family Year-Over-Year Change Condo/TIC/ Coop Year-Over-Year Change Jan-2014 323 -5.0% 464 -7.6% Feb-2014 331 -13.6% 493 -14.6% Mar-2014 334 -18.1% 475 -22.9% Apr-2014 344 -22.9% 524 -20.8% May-2014 380 -21.8% 556 -13.4% Jun-2014 428 -8.7% 573 -12.8% Jul-2014 430 -6.1% 581 -5.2% Aug-2014 399 -14.9% 514 -12.9% Sep-2014 494 -2.0% 576 -20.2% Oct-2014 419 -15.2% 549 -14.4% Nov-2014 289 -27.2% 426 -16.0% Dec-2014 159 -41.8% 199 -40.9% 12-Month Avg* 361 -15.5% 494 -16.1% The number of properties available for sale in active status at the end of a given month. 320 410 273 337 159 199 December 2012 2013 2014 40 9%17 8%41 8%14 7% 2012 2013 2014 35 6% 35 3% 12 Month Avg 361 15.5% 494 16.1% Historical Inventory of Active Listings by Month * Active Listings for all properties from January 2014 through December 2014. This is not the average of the individual figures above. Current as of January 12, 2015. All data from the San Francisco MLS. Powered by 10K Research and Marketing. | Click for Cover Page | 10 Single Family Condo/TIC/Coop 0 250 500 750 1,000 1,250 1,500 1-2005 1-2006 1-2007 1-2008 1-2009 1-2010 1-2011 1-2012 1-2013 1-2014 Single Family Condo/TIC/Coop 2012 2013 2014 - 40.9%- 17.8%- 41.8%- 14.7% 2012 2013 2014 - 35.6% - 35.3%
- 11. % of Properties Sold Over List Price % of Properties Sold Over List Price Single Family Year-Over-Year Change Condo/TIC/ Coop Year-Over-Year Change Jan-2014 65.4% +2.2% 43.6% +9.8% Feb-2014 75.8% +4.3% 68.9% +25.5% Mar-2014 77.4% +3.3% 71.6% +13.5% Apr-2014 85.5% +7.3% 70.0% +4.3% May-2014 87.0% +11.8% 76.3% +12.9% Jun-2014 79.2% -1.2% 69.5% -3.2% Jul-2014 85.6% +9.6% 71.4% -2.6% Aug-2014 81.0% +7.7% 69.3% +5.0% Sep-2014 77.9% -1.1% 66.3% -3.4% Oct-2014 82.4% +2.0% 69.5% +2.8% Nov-2014 79.8% +3.0% 67.8% +8.8% Dec-2014 74.1% +14.4% 54.4% +0.6% 12-Month Avg 80.1% +5.4% 67.6% +4.7% Percentage found when dividing the number of properties sold by properties sold over its original list price, not accounting for seller concessions. 61.7% 46.2% 64.8% 54.1% 74.1% 54.4% December 59.3% 45.5% 76.0% 64.5% 80.1% 67.6% Year to Date 2012 2013 2014 + 0 6%+ 17 1%+ 14 4%+ 5 0% + 41 8%+ 5 4%+ 28 2% + 4 8% 2012 2013 2014 2012 2013 2014 2012 2013 2014 + 65 9% + 50 1% + 94 4%+ 95 8% 12 Month Avg 80.1% +5.4% 67.6% +4.7% Historical % of Properties Sold Over List Price by Month * % of Properties Sold Over List Price for all properties from January 2014 through December 2014. This is not the average of the individual figures above. Current as of January 12, 2015. All data from the San Francisco MLS. Powered by 10K Research and Marketing. | Click for Cover Page | 11 Single Family Condo/TIC/Coop 0.0% 20.0% 40.0% 60.0% 80.0% 100.0% 1-2005 1-2006 1-2007 1-2008 1-2009 1-2010 1-2011 1-2012 1-2013 1-2014 Single Family Condo/TIC/Coop Single Family Condo/TIC/Coop 2012 2013 2014 + 0.6%+ 17.1%+ 14.4%+ 5.0% + 41.8%+ 5.4%+ 28.2% + 4.8% 2012 2013 2014 2012 2013 2014 2012 2013 2014 + 65.9% + 50.1% + 94.4%+ 95.8%
- 12. % of List Price Received % of List Price Received Single Family Year-Over-Year Change Condo/TIC/ Coop Year-Over-Year Change Jan-2014 107.7% +1.5% 102.9% +1.6% Feb-2014 110.2% +1.7% 106.2% +2.3% Mar-2014 111.8% +1.7% 108.3% +3.2% Apr-2014 115.0% +3.0% 108.2% +2.5% May-2014 115.7% +4.0% 109.1% +3.0% Jun-2014 113.8% +1.2% 108.3% +1.2% Jul-2014 114.0% +4.0% 108.1% +1.2% Aug-2014 111.3% +1.1% 106.4% +0.9% Sep-2014 111.8% +1.8% 105.3% -0.5% Oct-2014 113.0% +2.5% 107.1% +1.5% Nov-2014 111.4% +2.5% 106.6% +1.5% Dec-2014 109.2% +2.2% 103.5% +0.1% 12-Month Avg* 112.3% +2.3% 106.9% +1.5% Percentage found when dividing a property’s sales price by its most recent list price, then taking the average for all properties sold in a given month, not accounting for seller concessions. 104.6% 101.6% 106.8% 103.4% 109.2% 103.5% December 104.4% 101.5% 109.8% 105.3% 112.3% 106.9% Year to Date 2012 2013 2014 0 1%1 8%2 2%2 1% 2012 2013 2014 3 9% 3 3% 2012 2013 2014 + 1 5%3 7%2 3%5 2% 2012 2013 2014 4 3% 3 3% 12 Month Avg 112.3% +2.3% 106.9% +1.5% Historical % of List Price Received by Month * % of List Price Received for all properties from January 2014 through December 2014. This is not the average of the individual figures above. Current as of January 12, 2015. All data from the San Francisco MLS. Powered by 10K Research and Marketing. | Click for Cover Page | 12 Single Family Condo/TIC/Coop Single Family Condo/TIC/Coop 95.0% 100.0% 105.0% 110.0% 115.0% 120.0% 1-2005 1-2006 1-2007 1-2008 1-2009 1-2010 1-2011 1-2012 1-2013 1-2014 Single Family Condo/TIC/Coop 2012 2013 2014 + 0.1%+ 1.8%+ 2.2%+ 2.1% 2012 2013 2014 + 3.9% + 3.3% 2012 2013 2014 + 1.5%+ 3.7%+ 2.3%+ 5.2% 2012 2013 2014 + 4.3% + 3.3%
- 13. Housing Affordability Ratio Affordability Ratio Single Family Year-Over-Year Change Condo/TIC/ Coop Year-Over-Year Change Jan-2014 47 -29.9% 53 -30.3% Feb-2014 42 -31.1% 54 -28.0% Mar-2014 45 -15.1% 53 -23.2% Apr-2014 40 -20.0% 56 -17.6% May-2014 42 -10.6% 56 -16.4% Jun-2014 39 -18.8% 54 -18.2% Jul-2014 42 -20.8% 55 -9.8% Aug-2014 47 -2.1% 56 -11.1% Sep-2014 43 -12.2% 57 -9.5% Oct-2014 39 -23.5% 55 -9.8% Nov-2014 40 -21.6% 52 -22.4% Dec-2014 43 -12.2% 56 -18.8% 12-Month Avg* 42 -17.9% 52 -16.6% This index measures housing affordability for the region. An index of 120 means the median household income is 120% of what is necessary to qualify for the median-priced home under prevailing interest rates. A higher number means greater affordability. 61 83 49 69 43 56 December 2012 2013 2014 18 8%16 9%12 2%19 7% 2012 2013 2014 20 8% 1 2% 67 82 51 65 43 57 Year to Date 2012 2013 2014 12 3%20 7%15 7%23 9% 2012 2013 2014 1 5% 2 4% 12 Month Avg 42 17.9% 52 16.6% Historical Housing Affordability Ratio by Month * Affordability Ratio for all properties from January 2014 through December 2014. This is not the average of the individual figures above. Current as of January 12, 2015. All data from the San Francisco MLS. Powered by 10K Research and Marketing. | Click for Cover Page | 13 Single Family Condo/TIC/Coop 30 40 50 60 70 80 90 100 1-2005 1-2006 1-2007 1-2008 1-2009 1-2010 1-2011 1-2012 1-2013 1-2014 Single Family Condo/TIC/Coop 2012 2013 2014 - 18.8%- 16.9%- 12.2%- 19.7% 2012 2013 2014 - 20.8% - 1.2% Single Family Condo/TIC/Coop 2012 2013 2014 - 12.3%- 20.7%- 15.7%- 23.9% 2012 2013 2014 - 1.5% - 2.4%
- 14. Months Supply of Inventory Months Supply Single Family Year-Over-Year Change Condo/TIC/ Coop Year-Over-Year Change Jan-2014 1.5 0.0% 1.7 -10.5% Feb-2014 1.5 -16.7% 1.7 -22.7% Mar-2014 1.5 -21.1% 1.7 -26.1% Apr-2014 1.6 -23.8% 1.9 -24.0% May-2014 1.8 -18.2% 2.0 -16.7% Jun-2014 2.1 0.0% 2.1 -16.0% Jul-2014 2.1 0.0% 2.1 -8.7% Aug-2014 2.0 -4.8% 1.9 -13.6% Sep-2014 2.4 +9.1% 2.1 -19.2% Oct-2014 2.0 -9.1% 2.1 -8.7% Nov-2014 1.4 -22.2% 1.6 -11.1% Dec-2014 0.8 -33.3% 0.8 -33.3% 12-Month Avg* 1.7 -11.1% 1.8 -17.4% The inventory of homes for sale at the end of a given month, divided by the average monthly pending sales from the last 12 months. 1.5 1.6 1.2 1.2 0.8 0.8 December 2012 2013 2014 33 3%25 0%33 3%20 0% 2012 2013 2014 37 5% 46 7% 12 Month Avg 1.7 11.1% 1.8 17.4% Historical Months Supply of Inventory by Month * Months Supply for all properties from January 2014 through December 2014. This is not the average of the individual figures above. Current as of January 12, 2015. All data from the San Francisco MLS. Powered by 10K Research and Marketing. | Click for Cover Page | 14 Single Family Condo/TIC/Coop 0.0 2.0 4.0 6.0 8.0 10.0 1-2005 1-2006 1-2007 1-2008 1-2009 1-2010 1-2011 1-2012 1-2013 1-2014 Single Family Condo/TIC/Coop 2012 2013 2014 - 33.3%- 25.0%- 33.3%- 20.0% 2012 2013 2014 - 37.5% - 46.7%
- 15. All Properties Activity Overview Key metrics by report month and for year-to-date (YTD) starting from the first of the year. Key Metrics Historical Sparkbars 12-2013 12-2014 Percent Change YTD 2013 YTD 2014 Percent Change - 8.6% Pending Sales 375 330 - 12.0% 5,981 5,557 - 7.1% New Listings 228 132 - 42.1% 6,876 6,288 Sold Listings 462 402 - 13.0% 5,995 5,528 - 7.8% Median Sales Price $843,500 $992,500 + 17.7% $850,000 $995,000 + 17.1% + 12.9%$1,252,667Avg. Sales Price $1,186,741 $1,253,473 + 5.6% $1,109,344 12-2011 12-2012 12-2013 12-2014 12-2011 12-2012 12-2013 12-2014 12-2011 12-2012 12-2013 12-2014 12-2011 12-2012 12-2013 12-2014 12-2011 12-2012 12-2013 12-2014 35 - 10.3% -- -- Days on Market 43 45 + 4.7% 39 Active Listings 610 358 - 41.3% -- % of Properties Sold Over List Price 59.1% 63.4% + 7.3% 69.6% 48 73.0% + 4.9% + 1.9% 43 - 10.6% 109.3%% of List Price Received 105.0% 106.1% + 1.0% 107.3% Current as of January 12, 2015. All data from the San Francisco MLS. Powered by 10K Research and Marketing. | Click for Cover Page | 15 Months Supply 1.2 0.8 - 33.3% -- -- -- Affordability Ratio 45 43 - 4.6% 12-2011 12-2012 12-2013 12-2014 12-2011 12-2012 12-2013 12-2014 12-2011 12-2012 12-2013 12-2014 12-2011 12-2012 12-2013 12-2014 12-2011 12-2012 12-2013 12-2014 12-2011 12-2012 12-2013 12-2014 12-2011 12-2012 12-2013 12-2014
- 16. Activity by District SF District 1: Northwest (Sea Cliff, Lake, Jordan Park / Laurel Heights, Outer Richmond, Central Richmond, Inner Richmond, Lone Mountain) SF District 2: Central West (Outer Sunset, Central Sunset, Inner Sunset, Outer Parkside, Parkside, Inner Parkside, Golden Gate Heights) SF District 3: Southwest (Pine Lake Park, Lake Shore, Merced Manor, Stonestown, Lakeside, Merced Heights, Ingleside, Ingleside Heights, Oceanview) SF District 4: Twin Peaks W (Forest Hill (& Ext), W Portal, St Francis Wd, Balboa Terr, Mt Dav Manor, Ingleside Terr, Monterey Hts, Wstwd Pk & H'lnds, Shrwd Fst, Miraloma Pk, Dmnd Hts, Mdtwn Terr) SF District 5: Central (Haight Ashbury, Cole Vly / Prnssus Hts, Clarndn Hts, Corona Hts, Twin Pks, Glen Pk, Noe Vly, Eureka Vly / Dolores Hts, Mission Dolores, Duboce Trngl, Buena Vista / Ashbury Hts) SF District 6: Central North (Lower Pacific Heights, Anza Vista, Western Addition, North Panhandle, Alamo Square, Hayes Valley) SF District 7: North (Marina, Cow Hollow, Presidio Heights, Pacific Heights) SF District 8: Northeast (North Waterfront, North Beach, Russian Hill, Telegraph Hill, Nob Hill, Financial District / Barbary Coast, Downtown, Van Ness / Civic Center, Tenderloin) SF District 9: Central East (Yerba Buena, South Beach, South of Market, Mission Bay, Inner Mission, Potrero Hill, Central Waterfront / Dogpatch, Bernal Heights) SF District 10: Southeast (Outer Mission, Mission Terr, Excelsior, Portola, Bayview, Silver Terr, Hunters Pt, Candlestick Pt, Bayview Hts, Little Hollywood, Visitation Vly, Crocker Amazon) 12-2013 12-2014 + / – 12-2013 12-2014 + / – 12-2013 12-2014 + / – 12-2013 12-2014 + / – 12-2013 12-2014 + / – Single Family 1 SF District 1 17 12 -29.4% 18 12 -33.3% $1,225,000 $1,479,000 +20.7% 27 51 +88.0% 0.9 0.7 -25.5% 2 SF District 2 35 17 -51.4% 42 43 +2.4% $825,000 $908,000 +10.1% 40 38 -3.0% 0.9 0.5 -45.4% Key metrics by report month for the districts of San Fransisco. Active Listings Sold Listings Median Sales Price Days on Market Months Supply 2 SF District 2 35 17 -51.4% 42 43 +2.4% $825,000 $908,000 +10.1% 40 38 -3.0% 0.9 0.5 -45.4% 3 SF District 3 29 15 -48.3% 16 12 -25.0% $799,750 $757,500 -5.3% 49 55 +12.7% 1.9 1.0 -46.8% 4 SF District 4 31 13 -58.1% 35 29 -17.1% $1,130,000 $1,250,000 +10.6% 52 31 -40.6% 1.1 0.5 -55.2% 5 SF District 5 26 12 -53.8% 25 23 -8.0% $1,750,000 $1,670,000 -4.6% 36 41 +16.2% 0.8 0.4 -45.8% 6 SF District 6 7 4 -42.9% 3 6 +100.0% $1,488,000 $3,275,000 +120.1% 45 37 -18.1% 1.8 1.1 -40.4% 7 SF District 7 18 9 -50.0% 14 8 -42.9% $3,862,500 $3,487,500 -9.7% 67 76 +12.6% 1.6 0.9 -40.1% 8 SF District 8 3 3 0.0% 3 2 -33.3% $2,500,000 $1,840,000 -26.4% 126 66 -48.2% 1.4 1.4 0.0% 9 SF District 9 24 13 -45.8% 20 12 -40.0% $1,251,000 $1,215,000 -2.9% 31 28 -9.7% 1.0 0.7 -33.9% 10 SF District 10 83 61 -26.5% 40 38 -5.0% $592,500 $697,500 +17.7% 36 35 -2.6% 1.9 1.4 -24.8% Condo/TIC/Coop 1 SF District 1 20 11 -45.0% 11 9 -18.2% $760,000 $700,000 -7.9% 50 41 -16.5% 1.5 0.8 -47.4% 2 SF District 2 4 4 0.0% 4 0 -100.0% $650,000 $0 -100.0% 44 0 -100.0% 0.9 0.9 +3.1% 3 SF District 3 4 4 0.0% 3 3 0.0% $430,000 $545,000 +26.7% 32 30 -8.2% 1.4 1.3 -5.7% 4 SF District 4 7 1 -85.7% 2 4 +100.0% $362,500 $515,000 +42.1% 43 66 +54.7% 1.4 0.2 -85.2% 5 SF District 5 41 26 -36.6% 23 25 +8.7% $1,299,000 $1,010,000 -22.2% 39 48 +22.7% 1.0 0.7 -32.1% 6 SF District 6 38 19 -50.0% 34 30 -11.8% $629,000 $907,000 +44.2% 38 47 +25.2% 1.3 0.7 -43.5% 7 SF District 7 27 15 -44.4% 20 26 +30.0% $1,100,000 $1,374,500 +25.0% 38 47 +23.6% 0.8 0.6 -31.9% 8 SF District 8 83 34 -59.0% 50 47 -6.0% $872,500 $870,000 -0.3% 45 57 +27.8% 1.8 0.8 -56.5% 9 SF District 9 97 75 -22.7% 91 70 -23.1% $765,000 $912,500 +19.3% 47 46 -2.2% 1.0 0.8 -22.7% 10 SF District 10 16 10 -37.5% 8 3 -62.5% $499,500 $513,000 +2.7% 62 129 +108.4% 2.5 2.1 -16.7% Current as of January 12, 2015. All data from the San Francisco MLS. Powered by 10K Research and Marketing. | Click for Cover Page | 16