San Francisco Market Report January 2023.pdf
•
0 likes•25 views

San Francisco Market Report January 2023

Recommended
Recommended
More Related Content
Similar to San Francisco Market Report January 2023.pdf
Similar to San Francisco Market Report January 2023.pdf (20)
Recently uploaded
Recently uploaded (20)
San Francisco Market Report January 2023.pdf
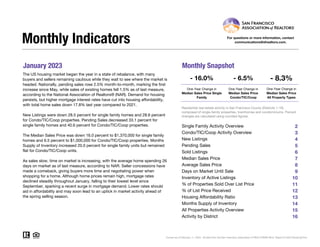
- 1. January 2023 Monthly Snapshot One-Year Change in One-Year Change in Median Sales Price Single Family Median Sales Price Condo/TIC/Coop 2 3 4 5 6 7 8 9 10 11 12 13 14 15 16 Current as of February 11, 2023. All data from the San Francisco Association of REALTORS® MLS. Report © 2023 ShowingTime. Condo/TIC/Coop Activity Overview Inventory of Active Listings % of Properties Sold Over List Price % of List Price Received Housing Affordability Ratio All Properties Activity Overview New Listings Pending Sales Sold Listings Median Sales Price Average Sales Price Days on Market Until Sale Activity by District Monthly Indicators - 16.0% - 6.5% - 8.3% One-Year Change in The US housing market began the year in a state of rebalance, with many buyers and sellers remaining cautious while they wait to see where the market is headed. Nationally, pending sales rose 2.5% month-to-month, marking the first increase since May, while sales of existing homes fell 1.5% as of last measure, according to the National Association of Realtors® (NAR). Demand for housing persists, but higher mortgage interest rates have cut into housing affordability, with total home sales down 17.8% last year compared to 2021. New Listings were down 28.5 percent for single family homes and 28.6 percent for Condo/TIC/Coop properties. Pending Sales decreased 33.1 percent for single family homes and 40.6 percent for Condo/TIC/Coop properties. The Median Sales Price was down 16.0 percent to $1,370,000 for single family homes and 6.5 percent to $1,000,000 for Condo/TIC/Coop properties. Months Supply of Inventory increased 20.0 percent for single family units but remained flat for Condo/TIC/Coop units. As sales slow, time on market is increasing, with the average home spending 26 days on market as of last measure, according to NAR. Seller concessions have made a comeback, giving buyers more time and negotiating power when shopping for a home. Although home prices remain high, mortgage rates declined steadily throughout January, falling to their lowest level since September, sparking a recent surge in mortgage demand. Lower rates should aid in affordability and may soon lead to an uptick in market activity ahead of the spring selling season. Median Sales Price All Property Types Residential real estate activity in San Francisco County (Districts 1-10) composed of single-family properties, townhomes and condominiums. Percent changes are calculated using rounded figures. Single Family Activity Overview Months Supply of Inventory For questions or more information, contact communications@sfrealtors.com.
- 2. Single Family Activity Overview Key metrics by report month and for year-to-date (YTD) starting from the first of the year. Key Metrics Historical Sparkbars 1-2022 1-2023 Percent Change YTD 2022 YTD 2023 Percent Change - 28.5% 163 99 - 23.8% $1,370,000 - 16.0% - 7.8% Pending Sales 145 97 - 33.1% - 33.1% 145 97 New Listings 228 163 - 28.5% 228 Sold Listings 130 99 - 23.8% 130 Median Sales Price $1,630,000 $1,370,000 - 16.0% $1,630,000 50 + 22.0% $1,818,925 -- -- Days on Market 41 50 + 22.0% 41 Avg. Sales Price $1,971,756 $1,818,925 - 7.8% $1,971,756 Active Listings 262 226 - 13.7% -- % of Properties Sold Over List Price 75.4% 44.4% - 41.1% 75.4% 32 44.4% - 41.1% - 11.9% 31 - 3.1% 103.4% % of List Price Received 117.4% 103.4% - 11.9% 117.4% Current as of February 11, 2023. All data from the San Francisco Association of REALTORS® MLS. Report © 2023 ShowingTime. | 2 Months Supply 1.0 1.2 + 20.0% -- -- -- Affordability Ratio 32 31 - 3.1% 1-2020 1-2021 1-2022 1-2023 1-2020 1-2021 1-2022 1-2023 1-2020 1-2021 1-2022 1-2023 1-2020 1-2021 1-2022 1-2023 1-2020 1-2021 1-2022 1-2023 1-2020 1-2021 1-2022 1-2023 1-2020 1-2021 1-2022 1-2023 1-2020 1-2021 1-2022 1-2023 1-2020 1-2021 1-2022 1-2023 1-2020 1-2021 1-2022 1-2023 1-2020 1-2021 1-2022 1-2023
- 3. Condo/TIC/Coop Activity Overview Key metrics by report month and for year-to-date (YTD) starting from the first of the year. Key Metrics Historical Sparkbars 1-2022 1-2023 Percent Change YTD 2022 YTD 2023 Percent Change - 28.6% Pending Sales 251 149 - 40.6% 251 149 - 40.6% New Listings 472 337 - 28.6% 472 337 Sold Listings 186 101 - 45.7% 186 101 - 45.7% Median Sales Price $1,070,000 $1,000,000 - 6.5% $1,070,000 $1,000,000 - 6.5% - 3.4% 87 + 27.9% $1,266,773 -- -- Days on Market 68 87 + 27.9% 68 Avg. Sales Price $1,311,263 $1,266,773 - 3.4% $1,311,263 Active Listings 834 577 - 30.8% -- % of Properties Sold Over List Price 38.7% 18.8% - 51.4% 38.7% 57 18.8% - 51.4% - 3.2% 48 - 15.8% 97.9% % of List Price Received 101.1% 97.9% - 3.2% 101.1% Current as of February 11, 2023. All data from the San Francisco Association of REALTORS® MLS. Report © 2023 ShowingTime. | 3 Months Supply 2.3 2.3 0.0% -- -- -- Affordability Ratio 57 48 - 15.8% 1-2020 1-2021 1-2022 1-2023 1-2020 1-2021 1-2022 1-2023 1-2020 1-2021 1-2022 1-2023 1-2020 1-2021 1-2022 1-2023 1-2020 1-2021 1-2022 1-2023 1-2020 1-2021 1-2022 1-2023 1-2020 1-2021 1-2022 1-2023 1-2020 1-2021 1-2022 1-2023 1-2020 1-2021 1-2022 1-2023 1-2020 1-2021 1-2022 1-2023 1-2020 1-2021 1-2022 1-2023
- 4. New Listings New Listings Single Family Year-Over-Year Change Condo/TIC/ Coop Year-Over-Year Change Feb-2022 288 +14.7% 535 +6.4% Mar-2022 343 +5.9% 614 +13.7% Apr-2022 329 -4.9% 542 +0.2% May-2022 301 -15.4% 516 +1.2% Jun-2022 321 -4.5% 447 -10.6% Jul-2022 240 -21.6% 381 -16.8% Aug-2022 238 -14.1% 307 -20.9% Sep-2022 365 -13.7% 576 -20.2% Oct-2022 243 -27.0% 378 -28.5% Nov-2022 152 -11.1% 153 -42.3% Dec-2022 73 -12.0% 78 -46.9% Jan-2023 163 -28.5% 337 -28.6% 12-Month Avg 255 -11.0% 405 -12.8% Historical New Listings by Month Current as of February 11, 2023. All data from the San Francisco Association of REALTORS® MLS. Report © 2023 ShowingTime. | 4 A count of the properties that have been newly listed on the market in a given month. 253 538 228 472 163 337 Single Family Condo/TIC/Coop January 0 200 400 600 800 1-2005 1-2006 1-2007 1-2008 1-2009 1-2010 1-2011 1-2012 1-2013 1-2014 1-2015 1-2016 1-2017 1-2018 1-2019 1-2020 1-2021 1-2022 1-2023 Single Family Condo/TIC/Coop 253 538 228 472 163 337 Single Family Condo/TIC/Coop Year to Date 2021 2022 2023 - 28.6% - 12.3% - 28.5% - 9.9% - 12.3% - 28.5% - 9.9% - 28.6% 2021 2022 2023 2021 2022 2023 2021 2022 2023 + 24.0% + 24.0% + 60.1% + 60.1%
- 5. Pending Sales Pending Sales Single Family Year-Over-Year Change Condo/TIC/ Coop Year-Over-Year Change Feb-2022 216 -4.4% 287 -24.7% Mar-2022 288 -0.3% 436 -8.0% Apr-2022 269 -5.9% 345 -28.1% May-2022 249 -18.9% 332 -28.3% Jun-2022 197 -28.1% 257 -33.8% Jul-2022 182 -29.7% 222 -39.0% Aug-2022 180 -20.4% 232 -26.6% Sep-2022 188 -42.9% 213 -36.8% Oct-2022 197 -27.8% 223 -44.9% Nov-2022 165 -36.3% 164 -54.4% Dec-2022 117 -9.3% 127 -43.8% Jan-2023 97 -33.1% 149 -40.6% 12-Month Avg 195 -21.9% 249 -32.8% Historical Pending Sales by Month Current as of February 11, 2023. All data from the San Francisco Association of REALTORS® MLS. Report © 2023 ShowingTime. | 5 A count of the properties on which offers have been accepted in a given month. 169 292 145 251 97 149 Single Family Condo/TIC/Coop January 0 100 200 300 400 500 600 1-2005 1-2006 1-2007 1-2008 1-2009 1-2010 1-2011 1-2012 1-2013 1-2014 1-2015 1-2016 1-2017 1-2018 1-2019 1-2020 1-2021 1-2022 1-2023 Single Family Condo/TIC/Coop 169 292 145 251 97 149 Single Family Condo/TIC/Coop Year to Date 2021 2022 2023 - 40.6% - 14.0% - 33.1% - 14.2% - 14.0% - 33.1% - 14.2% - 40.6% 2021 2022 2023 2021 2022 2023 2021 2022 2023 + 43.2% + 43.2% + 81.4% + 81.4%
- 6. Sold Listings Sold Listings Single Family Year-Over-Year Change Condo/TIC/ Coop Year-Over-Year Change Feb-2022 159 -2.5% 250 -10.1% Mar-2022 257 -5.2% 394 -13.8% Apr-2022 257 -11.1% 380 -17.7% May-2022 282 +6.0% 368 -17.1% Jun-2022 249 -23.6% 309 -34.7% Jul-2022 183 -28.2% 232 -37.1% Aug-2022 189 -26.2% 236 -32.2% Sep-2022 179 -26.9% 210 -28.1% Oct-2022 192 -38.1% 223 -38.7% Nov-2022 186 -36.5% 206 -51.5% Dec-2022 153 -29.2% 145 -55.4% Jan-2023 99 -23.8% 101 -45.7% 12-Month Avg 199 -21.0% 255 -31.0% Historical Sold Listings by Month Current as of February 11, 2023. All data from the San Francisco Association of REALTORS® MLS. Report © 2023 ShowingTime. | 6 A count of the actual sales that closed in a given month. 161 270 130 186 99 101 Single Family Condo/TIC/Coop January 0 100 200 300 400 500 1-2005 1-2006 1-2007 1-2008 1-2009 1-2010 1-2011 1-2012 1-2013 1-2014 1-2015 1-2016 1-2017 1-2018 1-2019 1-2020 1-2021 1-2022 1-2023 Single Family Condo/TIC/Coop 161 270 130 186 99 101 Single Family Condo/TIC/Coop Year to Date 2021 2022 2023 - 45.7% - 31.1% - 23.8% - 19.3% - 31.1% - 23.8% - 19.3% - 45.7% 2021 2022 2023 2021 2022 2023 2021 2022 2023 + 47.7% + 47.7% + 78.8% + 78.8%
- 7. Median Sales Price Median Sales Price Single Family Year-Over-Year Change Condo/TIC/ Coop Year-Over-Year Change Feb-2022 $1,930,000 +17.0% $1,227,500 +2.6% Mar-2022 $2,000,000 +15.9% $1,206,750 -1.2% Apr-2022 $2,050,000 +13.9% $1,362,500 +13.5% May-2022 $2,007,500 +6.4% $1,215,000 -1.1% Jun-2022 $1,880,000 -3.1% $1,240,000 -0.8% Jul-2022 $1,670,000 -9.7% $1,198,500 -1.0% Aug-2022 $1,610,000 -12.9% $997,500 -13.3% Sep-2022 $1,650,000 -5.7% $1,160,000 -3.3% Oct-2022 $1,670,000 -7.5% $1,200,000 -3.8% Nov-2022 $1,500,000 -20.2% $1,136,500 -9.8% Dec-2022 $1,550,000 -8.3% $950,000 -26.9% Jan-2023 $1,370,000 -16.0% $1,000,000 -6.5% 12-Month Avg* $1,770,000 -2.2% $1,200,000 -1.6% Historical Median Sales Price by Month * Median Sales Price for all properties from February 2022 through January 2023. This is not the average of the individual figures above. Current as of February 11, 2023. All data from the San Francisco Association of REALTORS® MLS. Report © 2023 ShowingTime. | 7 Point at which half of the sales sold for more and half sold for less, not accounting for seller concessions, in a given month. $1,575,000 $1,072,500 $1,630,000 $1,070,000 $1,370,000 $1,000,000 Single Family Condo/TIC/Coop January $500,000 $750,000 $1,000,000 $1,250,000 $1,500,000 $1,750,000 $2,000,000 $2,250,000 1-2005 1-2006 1-2007 1-2008 1-2009 1-2010 1-2011 1-2012 1-2013 1-2014 1-2015 1-2016 1-2017 1-2018 1-2019 1-2020 1-2021 1-2022 1-2023 Single Family Condo/TIC/Coop $1,575,000 $1,072,500 $1,630,000 $1,070,000 $1,370,000 $1,000,000 Single Family Condo/TIC/Coop Year to Date 2021 2022 2023 - 6.5% - 0.2% - 16.0% + 3.5% - 0.2% - 16.0% + 3.5% - 6.5% 2021 2022 2023 2021 2022 2023 2021 2022 2023 + 7.9% + 7.9% - 7.2% - 7.2%
- 8. Average Sales Price Average Sales Price Single Family Year-Over-Year Change Condo/TIC/ Coop Year-Over-Year Change Feb-2022 $2,417,245 +7.1% $1,398,389 +4.0% Mar-2022 $2,534,210 +14.6% $1,411,860 +3.1% Apr-2022 $2,515,877 +3.5% $1,464,116 +8.7% May-2022 $2,411,895 -2.7% $1,403,091 +1.7% Jun-2022 $2,355,940 -5.8% $1,366,119 -1.5% Jul-2022 $2,061,331 -10.1% $1,471,068 +8.4% Aug-2022 $1,950,088 -8.4% $1,175,621 -17.5% Sep-2022 $1,886,008 -12.9% $1,343,336 +0.8% Oct-2022 $2,211,462 -6.3% $1,419,037 -2.9% Nov-2022 $1,895,086 -19.4% $1,399,284 -9.1% Dec-2022 $1,874,472 -20.8% $1,104,823 -25.8% Jan-2023 $1,818,925 -7.8% $1,266,773 -3.4% 12-Month Avg* $2,212,301 -4.4% $1,373,395 -1.9% Historical Average Sales Price by Month * Avg. Sales Price for all properties from February 2022 through January 2023. This is not the average of the individual figures above. Current as of February 11, 2023. All data from the San Francisco Association of REALTORS® MLS. Report © 2023 ShowingTime. | 8 Average sales price for all closed sales, not accounting for seller concessions, in a given month. $1,945,877 $1,211,039 $1,971,756 $1,311,263 $1,818,925 $1,266,773 Single Family Condo/TIC/Coop January $500,000 $1,000,000 $1,500,000 $2,000,000 $2,500,000 $3,000,000 1-2005 1-2006 1-2007 1-2008 1-2009 1-2010 1-2011 1-2012 1-2013 1-2014 1-2015 1-2016 1-2017 1-2018 1-2019 1-2020 1-2021 1-2022 1-2023 Single Family Condo/TIC/Coop $1,945,877 $1,211,039 $1,971,756 $1,311,263 $1,818,925 $1,266,773 Single Family Condo/TIC/Coop Year to Date 2021 2022 2023 - 3.4% + 8.3% - 7.8% + 1.3% + 8.3% - 7.8% + 1.3% - 3.4% 2021 2022 2023 2021 2022 2023 2021 2022 2023 - 8.5% - 8.5% - 4.5% - 4.5%
- 9. Days on Market Until Sale Days on Market Until Sale Single Family Year-Over-Year Change Condo/TIC/ Coop Year-Over-Year Change Feb-2022 22 -35.3% 36 -45.5% Mar-2022 16 -38.5% 34 -29.2% Apr-2022 16 -20.0% 32 -31.9% May-2022 21 +5.0% 37 -5.1% Jun-2022 17 -10.5% 39 +5.4% Jul-2022 21 +10.5% 49 +16.7% Aug-2022 26 +4.0% 50 +16.3% Sep-2022 28 +21.7% 58 +45.0% Oct-2022 28 +40.0% 43 +19.4% Nov-2022 35 +66.7% 51 +24.4% Dec-2022 38 +22.6% 74 +57.4% Jan-2023 50 +22.0% 87 +27.9% 12-Month Avg* 24 +3.1% 44 -1.1% Historical Days on Market Until Sale by Month * Days on Market for all properties from February 2022 through January 2023. This is not the average of the individual figures above. Current as of February 11, 2023. All data from the San Francisco Association of REALTORS® MLS. Report © 2023 ShowingTime. | 9 Average number of days between when a property is listed and when an offer is accepted in a given month. 40 75 41 68 50 87 Single Family Condo/TIC/Coop January 0 20 40 60 80 100 120 1-2005 1-2006 1-2007 1-2008 1-2009 1-2010 1-2011 1-2012 1-2013 1-2014 1-2015 1-2016 1-2017 1-2018 1-2019 1-2020 1-2021 1-2022 1-2023 Single Family Condo/TIC/Coop 40 75 41 68 50 87 Single Family Condo/TIC/Coop Year to Date 2021 2022 2023 + 27.9% - 9.3% + 22.0% + 2.5% - 9.3% + 22.0% + 2.5% + 27.9% 2021 2022 2023 2021 2022 2023 2021 2022 2023 0.0% 0.0% + 11.9% + 11.9%
- 10. Inventory of Active Listings Inventory of Active Listings Single Family Year-Over-Year Change Condo/TIC/ Coop Year-Over-Year Change Feb-2022 301 -21.0% 993 -19.7% Mar-2022 318 -13.4% 1,048 -8.8% Apr-2022 337 -14.5% 1,109 -0.3% May-2022 331 -18.5% 1,119 +4.5% Jun-2022 377 -9.4% 1,100 +3.8% Jul-2022 365 -14.1% 1,017 -4.1% Aug-2022 346 -19.5% 889 -13.3% Sep-2022 477 +0.8% 1,100 -15.5% Oct-2022 465 -4.7% 1,087 -16.6% Nov-2022 362 -0.3% 849 -22.3% Dec-2022 200 -2.4% 488 -27.9% Jan-2023 226 -13.7% 577 -30.8% 12-Month Avg* 342 -11.0% 948 -12.0% Historical Inventory of Active Listings by Month * Active Listings for all properties from February 2022 through January 2023. This is not the average of the individual figures above. Current as of February 11, 2023. All data from the San Francisco Association of REALTORS® MLS. Report © 2023 ShowingTime. | 10 The number of properties available for sale in active status at the end of a given month. 403 1,246 262 834 226 577 Single Family Condo/TIC/Coop January 0 500 1,000 1,500 2,000 2,500 1-2005 1-2006 1-2007 1-2008 1-2009 1-2010 1-2011 1-2012 1-2013 1-2014 1-2015 1-2016 1-2017 1-2018 1-2019 1-2020 1-2021 1-2022 1-2023 Single Family Condo/TIC/Coop 2021 2022 2023 - 30.8% - 33.1% - 13.7% - 35.0% 2021 2022 2023 + 33.9% + 107.0%
- 11. % of Properties Sold Over List Price % of Properties Sold Over List Price Single Family Year-Over-Year Change Condo/TIC/ Coop Year-Over-Year Change Feb-2022 86.8% +27.5% 58.4% +65.4% Mar-2022 86.4% +17.1% 58.1% +35.4% Apr-2022 88.7% +16.6% 62.9% +39.2% May-2022 86.9% +9.0% 55.3% +3.6% Jun-2022 86.3% +5.0% 57.3% +5.5% Jul-2022 78.1% -6.5% 40.1% -27.9% Aug-2022 75.7% -10.3% 37.3% -31.7% Sep-2022 67.0% -20.7% 31.0% -43.1% Oct-2022 64.1% -24.1% 37.7% -37.9% Nov-2022 57.5% -27.7% 30.6% -45.2% Dec-2022 48.4% -38.5% 15.9% -65.8% Jan-2023 44.4% -41.1% 18.8% -51.4% 12-Month Avg 75.6% -5.3% 46.8% -7.2% Historical % of Properties Sold Over List Price by Month * % of Properties Sold Over List Price for all properties from February 2022 through January 2023. This is not the average of the individual figures above. Current as of February 11, 2023. All data from the San Francisco Association of REALTORS® MLS. Report © 2023 ShowingTime. | 11 Percentage found when dividing the number of properties sold by properties sold over its original list price, not accounting for seller concessions. 57.8% 21.9% 75.4% 38.7% 44.4% 18.8% Single Family Condo/TIC/Coop January 0.0% 20.0% 40.0% 60.0% 80.0% 100.0% 1-2005 1-2006 1-2007 1-2008 1-2009 1-2010 1-2011 1-2012 1-2013 1-2014 1-2015 1-2016 1-2017 1-2018 1-2019 1-2020 1-2021 1-2022 1-2023 Single Family Condo/TIC/Coop 57.8% 21.9% 75.4% 38.7% 44.4% 18.8% Single Family Condo/TIC/Coop Year to Date 2021 2022 2023 - 51.4% + 76.7% - 41.1% + 30.4% + 76.7% - 41.1% + 30.4% - 51.4% 2021 2022 2023 2021 2022 2023 2021 2022 2023 - 7.7% - 7.7% - 32.6% - 32.6%
- 12. % of List Price Received % of List Price Received Single Family Year-Over-Year Change Condo/TIC/ Coop Year-Over-Year Change Feb-2022 121.2% +10.5% 106.1% +5.4% Mar-2022 121.9% +8.7% 106.4% +3.9% Apr-2022 123.1% +8.2% 107.2% +3.4% May-2022 119.6% +2.4% 105.9% +0.7% Jun-2022 116.8% +0.5% 105.3% 0.0% Jul-2022 110.9% -6.4% 101.5% -3.1% Aug-2022 108.4% -6.6% 100.7% -3.5% Sep-2022 108.5% -6.7% 100.6% -4.2% Oct-2022 107.1% -8.5% 100.4% -4.8% Nov-2022 104.9% -8.6% 99.2% -5.2% Dec-2022 102.8% -10.1% 98.1% -5.2% Jan-2023 103.4% -11.9% 97.9% -3.2% 12-Month Avg* 113.7% -1.4% 103.5% -0.5% Historical % of List Price Received by Month * % of List Price Received for all properties from February 2022 through January 2023. This is not the average of the individual figures above. Current as of February 11, 2023. All data from the San Francisco Association of REALTORS® MLS. Report © 2023 ShowingTime. | 12 Percentage found when dividing a property’s sales price by its most recent list price, then taking the average for all properties sold in a given month, not accounting for seller concessions. 105.3% 98.7% 117.4% 101.1% 103.4% 97.9% Single Family Condo/TIC/Coop January 105.3% 98.7% 117.4% 101.1% 103.4% 97.9% Single Family Condo/TIC/Coop Year to Date 90.0% 100.0% 110.0% 120.0% 130.0% 1-2005 1-2006 1-2007 1-2008 1-2009 1-2010 1-2011 1-2012 1-2013 1-2014 1-2015 1-2016 1-2017 1-2018 1-2019 1-2020 1-2021 1-2022 1-2023 Single Family Condo/TIC/Coop 2021 2022 2023 - 3.2% + 2.4% - 11.9% + 11.5% 2021 2022 2023 - 1.6% - 1.7% 2021 2022 2023 - 3.2% + 2.4% - 11.9% + 11.5% 2021 2022 2023 - 1.6% - 1.7%
- 13. Housing Affordability Ratio Housing Affordability Ratio Single Family Year-Over-Year Change Condo/TIC/ Coop Year-Over-Year Change Feb-2022 27 -18.2% 49 -7.5% Mar-2022 24 -25.0% 45 -13.5% Apr-2022 21 -32.3% 37 -32.7% May-2022 22 -26.7% 42 -22.2% Jun-2022 23 -17.9% 40 -23.1% Jul-2022 27 -10.0% 43 -20.4% Aug-2022 28 -6.7% 51 -10.5% Sep-2022 24 -25.0% 39 -29.1% Oct-2022 23 -25.8% 37 -30.2% Nov-2022 27 -10.0% 39 -27.8% Dec-2022 27 -15.6% 49 0.0% Jan-2023 31 -3.1% 48 -15.8% 12-Month Avg* 25 +0.4% 43 -10.8% Historical Housing Affordability Ratio by Month * Affordability Ratio for all properties from February 2022 through January 2023. This is not the average of the individual figures above. Current as of February 11, 2023. All data from the San Francisco Association of REALTORS® MLS. Report © 2023 ShowingTime. | 13 This index measures housing affordability for the region. For example, an index of 120 means the median household income is 120% of what is necessary to qualify for the median-priced home under prevailing interest rates. A higher number means greater affordability. 36 63 32 57 31 48 Single Family Condo/TIC/Coop January 20 40 60 80 100 1-2005 1-2006 1-2007 1-2008 1-2009 1-2010 1-2011 1-2012 1-2013 1-2014 1-2015 1-2016 1-2017 1-2018 1-2019 1-2020 1-2021 1-2022 1-2023 Single Family Condo/TIC/Coop 2021 2022 2023 - 15.8% - 9.5% - 3.1% - 11.1% 2021 2022 2023 - 2.7% + 14.5% 36 63 32 57 31 48 Single Family Condo/TIC/Coop Year to Date 2021 2022 2023 - 15.8% - 9.5% - 3.1% - 11.1% 2021 2022 2023 - 2.7% + 14.5%
- 14. Months Supply of Inventory Months Supply of Inventory Single Family Year-Over-Year Change Condo/TIC/ Coop Year-Over-Year Change Feb-2022 1.2 -29.4% 2.7 -42.6% Mar-2022 1.3 -18.8% 2.9 -27.5% Apr-2022 1.4 -12.5% 3.2 -8.6% May-2022 1.4 -12.5% 3.3 +6.5% Jun-2022 1.6 0.0% 3.4 +13.3% Jul-2022 1.6 0.0% 3.2 +10.3% Aug-2022 1.5 -6.3% 2.9 +3.6% Sep-2022 2.2 +22.2% 3.7 +5.7% Oct-2022 2.2 +15.8% 3.9 +11.4% Nov-2022 1.8 +28.6% 3.2 +10.3% Dec-2022 1.0 +25.0% 1.9 +5.6% Jan-2023 1.2 +20.0% 2.3 0.0% 12-Month Avg* 1.5 +0.4% 3.1 -3.5% Historical Months Supply of Inventory by Month * Months Supply for all properties from February 2022 through January 2023. This is not the average of the individual figures above. Current as of February 11, 2023. All data from the San Francisco Association of REALTORS® MLS. Report © 2023 ShowingTime. | 14 The inventory of homes for sale at the end of a given month, divided by the average monthly pending sales from the last 12 months. 1.9 5.0 1.0 2.3 1.2 2.3 Single Family Condo/TIC/Coop January 0.0 2.0 4.0 6.0 8.0 10.0 12.0 1-2005 1-2006 1-2007 1-2008 1-2009 1-2010 1-2011 1-2012 1-2013 1-2014 1-2015 1-2016 1-2017 1-2018 1-2019 1-2020 1-2021 1-2022 1-2023 Single Family Condo/TIC/Coop 2021 2022 2023 0.0% - 54.0% + 20.0% - 47.4% 2021 2022 2023 + 26.7% + 100.0%
- 15. All Properties Activity Overview Key metrics by report month and for year-to-date (YTD) starting from the first of the year. Key Metrics Historical Sparkbars 1-2022 1-2023 Percent Change YTD 2022 YTD 2023 Percent Change - 27.4% Pending Sales 400 252 - 37.0% 400 252 - 37.0% New Listings 704 511 - 27.4% 704 511 Sold Listings 322 202 - 37.3% 322 202 - 37.3% Median Sales Price $1,325,000 $1,214,750 - 8.3% $1,325,000 $1,214,750 - 8.3% - 2.9% 69 + 21.1% $1,532,934 -- -- Days on Market 57 69 + 21.1% 57 Avg. Sales Price $1,578,805 $1,532,934 - 2.9% $1,578,805 Active Listings 1,127 830 - 26.4% -- % of Properties Sold Over List Price 53.7% 31.7% - 41.0% 53.7% 39 31.7% - 41.0% - 6.6% 31 - 20.5% 100.6% % of List Price Received 107.7% 100.6% - 6.6% 107.7% Current as of February 11, 2023. All data from the San Francisco Association of REALTORS® MLS. Report © 2023 ShowingTime. | 15 Months Supply 1.8 1.8 0.0% -- -- -- Affordability Ratio 39 31 - 20.5% 1-2020 1-2021 1-2022 1-2023 1-2020 1-2021 1-2022 1-2023 1-2020 1-2021 1-2022 1-2023 1-2020 1-2021 1-2022 1-2023 1-2020 1-2021 1-2022 1-2023 1-2020 1-2021 1-2022 1-2023 1-2020 1-2021 1-2022 1-2023 1-2020 1-2021 1-2022 1-2023 1-2020 1-2021 1-2022 1-2023 1-2020 1-2021 1-2022 1-2023 1-2020 1-2021 1-2022 1-2023
- 16. Activity by District SF District 1: Northwest (Sea Cliff, Lake, Jordan Park / Laurel Heights, Outer Richmond, Central Richmond, Inner Richmond, Lone Mountain) SF District 2: Central West (Outer Sunset, Central Sunset, Inner Sunset, Outer Parkside, Parkside, Inner Parkside, Golden Gate Heights) SF District 3: Southwest (Pine Lake Park, Lake Shore, Merced Manor, Stonestown, Lakeside, Merced Heights, Ingleside, Ingleside Heights, Oceanview) SF District 4: Twin Peaks W (Forest Hill (& Ext), W Portal, St Francis Wd, Balboa Terr, Mt Dav Manor, Ingleside Terr, Monterey Hts, Wstwd Pk & H'lnds, Shrwd Fst, Miraloma Pk, Dmnd Hts, Mdtwn Terr) SF District 5: Central (Haight Ashbury, Cole Vly / Prnssus Hts, Clarndn Hts, Corona Hts, Twin Pks, Glen Pk, Noe Vly, Eureka Vly / Dolores Hts, Mission Dolores, Duboce Trngl, Buena Vista / Ashbury Hts) SF District 6: Central North (Lower Pacific Heights, Anza Vista, Western Addition, North Panhandle, Alamo Square, Hayes Valley) SF District 7: North (Marina, Cow Hollow, Presidio Heights, Pacific Heights) SF District 8: Northeast (North Waterfront, North Beach, Russian Hill, Telegraph Hill, Nob Hill, Financial District / Barbary Coast, Downtown, Van Ness / Civic Center, Tenderloin) SF District 9: Central East (Yerba Buena, South Beach, South of Market, Mission Bay, Inner Mission, Potrero Hill, Central Waterfront / Dogpatch, Bernal Heights) SF District 10: Southeast (Outer Mission, Mission Terr, Excelsior, Portola, Bayview, Silver Terr, Hunters Pt, Candlestick Pt, Bayview Hts, Little Hollywood, Visitation Vly, Crocker Amazon) 1-2022 1-2023 + / – 1-2022 1-2023 + / – 1-2022 1-2023 + / – 1-2022 1-2023 + / – 1-2022 1-2023 + / – Single Family 1 SF District 1 28 20 -28.6% 15 12 -20.0% $2,350,000 $2,160,000 -8.1% 18 49 +172.2% 1.4 1.2 -14.3% 2 SF District 2 28 25 -10.7% 22 19 -13.6% $1,615,000 $1,450,000 -10.2% 40 45 +12.5% 0.6 0.6 0.0% 3 SF District 3 18 17 -5.6% 10 7 -30.0% $1,319,000 $1,105,000 -16.2% 41 45 +9.8% 1.1 1.3 +18.2% 4 SF District 4 19 21 +10.5% 12 16 +33.3% $1,766,500 $1,447,500 -18.1% 32 55 +71.9% 0.5 0.8 +60.0% 5 SF District 5 28 29 +3.6% 10 10 0.0% $2,475,000 $1,855,000 -25.1% 54 64 +18.5% 0.7 1.0 +42.9% 6 SF District 6 6 5 -16.7% 8 1 -87.5% $2,827,500 $4,500,000 +59.2% 54 0 -100.0% 1.2 1.7 +41.7% 7 SF District 7 31 26 -16.1% 3 2 -33.3% $4,200,000 $5,855,000 +39.4% 61 85 +39.3% 2.4 3.3 +37.5% 8 SF District 8 17 7 -58.8% 3 0 -100.0% $3,637,500 $0 -100.0% 172 0 -100.0% 6.5 2.3 -64.6% 9 SF District 9 38 22 -42.1% 14 9 -35.7% $1,955,000 $1,210,000 -38.1% 17 36 +111.8% 1.4 1.1 -21.4% 10 SF District 10 49 54 +10.2% 33 23 -30.3% $1,180,000 $1,040,000 -11.9% 42 48 +14.3% 1.1 1.4 +27.3% Condo/TIC/Coop 1 SF District 1 26 19 -26.9% 7 7 0.0% $1,250,000 $1,100,000 -12.0% 39 46 +17.9% 1.5 1.4 -6.7% 2 SF District 2 10 14 +40.0% 2 2 0.0% $1,348,000 $827,500 -38.6% 75 111 +48.0% 1.9 3.7 +94.7% 3 SF District 3 2 3 +50.0% 4 2 -50.0% $797,500 $630,000 -21.0% 41 31 -24.4% 0.5 1.1 +120.0% 4 SF District 4 13 9 -30.8% 5 0 -100.0% $550,000 $0 -100.0% 76 0 -100.0% 2.5 2.2 -12.0% 5 SF District 5 62 66 +6.5% 19 16 -15.8% $1,400,000 $1,017,500 -27.3% 45 73 +62.2% 1.1 1.5 +36.4% 6 SF District 6 76 45 -40.8% 23 9 -60.9% $1,075,000 $1,150,000 +7.0% 49 56 +14.3% 1.9 1.6 -15.8% 7 SF District 7 48 53 +10.4% 21 10 -52.4% $1,500,000 $1,650,000 +10.0% 96 88 -8.3% 1.2 2.1 +75.0% 8 SF District 8 172 122 -29.1% 35 22 -37.1% $958,500 $945,000 -1.4% 70 120 +71.4% 2.7 2.9 +7.4% 9 SF District 9 385 225 -41.6% 66 33 -50.0% $1,029,172 $950,000 -7.7% 74 90 +21.6% 3.0 2.9 -3.3% 10 SF District 10 40 21 -47.5% 4 0 -100.0% $782,944 $0 -100.0% 81 0 -100.0% 4.8 3.4 -29.2% Key metrics by report month for the districts of San Francisco. Current as of February 11, 2023. All data from the San Francisco Association of REALTORS® MLS. Report © 2023 ShowingTime. | 16 Active Listings Sold Listings Median Sales Price Days on Market Months Supply