SF Monthly Snapshot Shows 1.6% Rise in Single-Family Home Prices
•
0 likes•140 views

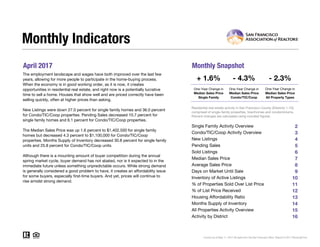
Residential real estate activity in San Francisco saw decreases in new listings and pending sales in April 2017 compared to the previous year. The median sales price for single-family homes increased slightly by 1.6% to $1,402,500, while the median price for condos decreased by 4.3% to $1,100,000. Inventory levels also dropped, with months of supply decreasing by 30.8% for single-family homes and 25.8% for condos. Overall, the real estate market remains strong with high demand, though affordability issues persist for some buyers.

Recommended
Recommended
More Related Content
What's hot
What's hot (18)
Similar to SF Monthly Snapshot Shows 1.6% Rise in Single-Family Home Prices
Similar to SF Monthly Snapshot Shows 1.6% Rise in Single-Family Home Prices (17)
More from Ronny Budiutama
More from Ronny Budiutama (20)
Recently uploaded
Recently uploaded (20)
SF Monthly Snapshot Shows 1.6% Rise in Single-Family Home Prices
- 1. April 2017 Monthly Snapshot One-Year Change in One-Year Change in Median Sales Price Single Family Median Sales Price Condo/TIC/Coop 2 3 4 5 6 7 8 9 10 11 12 13 14 15 16 Current as of May 11, 2017.All data from the San Francisco MLS. Report © 2017 ShowingTime. Condo/TIC/Coop Activity Overview Inventory of Active Listings % of Properties Sold Over List Price % of List Price Received Housing Affordability Ratio All Properties Activity Overview New Listings Pending Sales Sold Listings Median Sales Price Average Sales Price Days on Market Until Sale Activity by District Monthly Indicators + 1.6% - 4.3% - 2.3% One-Year Change in The employment landscape and wages have both improved over the last few years, allowing for more people to participate in the home-buying process. When the economy is in good working order, as it is now, it creates opportunities in residential real estate, and right now is a potentially lucrative time to sell a home. Houses that show well and are priced correctly have been selling quickly, often at higher prices than asking. New Listings were down 27.0 percent for single family homes and 36.0 percent for Condo/TIC/Coop properties. Pending Sales decreased 10.7 percent for single family homes and 6.1 percent for Condo/TIC/Coop properties. The Median Sales Price was up 1.6 percent to $1,402,500 for single family homes but decreased 4.3 percent to $1,100,000 for Condo/TIC/Coop properties. Months Supply of Inventory decreased 30.8 percent for single family units and 25.8 percent for Condo/TIC/Coop units. Although there is a mounting amount of buyer competition during the annual spring market cycle, buyer demand has not abated, nor is it expected to in the immediate future unless something unpredictable occurs. While strong demand is generally considered a good problem to have, it creates an affordability issue for some buyers, especially first-time buyers. And yet, prices will continue to rise amidst strong demand. Median Sales Price All Property Types Residential real estate activity in San Francisco County (Districts 1-10), comprised of single-family properties, townhomes and condominiums. Percent changes are calculated using rounded figures. Single Family Activity Overview Months Supply of Inventory
- 2. Single Family Activity Overview Key metrics by report month and for year-to-date (YTD) starting from the first of the year. Key Metrics Historical Sparkbars 4-2016 4-2017 Percent Change YTD 2016 YTD 2017 Percent Change - 16.1%810 582 + 1.6% $1,344,000 + 1.1% + 5.8% Pending Sales 214 191 - 10.7% 0.0%632 632 New Listings 282 206 - 27.0% 965 Sold Listings 209 194 - 7.2% 573 Median Sales Price $1,380,000 $1,402,500 + 1.6% $1,330,000 32 + 3.2% $1,807,735 -- -- Days on Market 32 26 - 18.8% 31 Avg. Sales Price $1,767,919 $1,898,215 + 7.4% $1,708,387 Active Listings 485 339 - 30.1% -- % of Properties Sold Over List Price 75.6% 77.3% + 2.2% 77.8% 39 74.2% - 4.6% - 0.2% 38 - 2.6% 113.0%% of List Price Received 113.3% 115.8% + 2.2% 113.2% Current as ofMay 11, 2017.All data from the San Francisco MLS. Report © 2017 ShowingTime. | 2 Months Supply 2.6 1.8 - 30.8% -- -- -- Affordability Ratio 38 36 - 5.3% 4-2014 4-2015 4-2016 4-2017 4-2014 4-2015 4-2016 4-2017 4-2014 4-2015 4-2016 4-2017 4-2014 4-2015 4-2016 4-2017 4-2014 4-2015 4-2016 4-2017 4-2014 4-2015 4-2016 4-2017 4-2014 4-2015 4-2016 4-2017 4-2014 4-2015 4-2016 4-2017 4-2014 4-2015 4-2016 4-2017 4-2014 4-2015 4-2016 4-2017 4-2014 4-2015 4-2016 4-2017
- 3. Condo/TIC/Coop Activity Overview Key metrics by report month and for year-to-date (YTD) starting from the first of the year. Key Metrics Historical Sparkbars 4-2016 4-2017 Percent Change YTD 2016 YTD 2017 Percent Change - 12.7% Pending Sales 244 229 - 6.1% 841 881 + 4.8% New Listings 372 238 - 36.0% 1,380 1,205 Sold Listings 222 224 + 0.9% 790 815 + 3.2% Median Sales Price $1,149,500 $1,100,000 - 4.3% $1,100,000 $1,108,000 + 0.7% + 1.4% 38 + 5.6% $1,278,995 -- -- Days on Market 38 33 - 13.2% 36 Avg. Sales Price $1,368,109 $1,302,924 - 4.8% $1,261,092 Active Listings 722 542 - 24.9% -- % of Properties Sold Over List Price 60.4% 62.5% + 3.5% 60.9% 56 57.2% - 6.1% - 1.1% 54 - 3.6% 104.2%% of List Price Received 105.2% 105.2% 0.0% 105.4% Current as ofMay 11, 2017.All data from the San Francisco MLS. Report © 2017 ShowingTime. | 3 Months Supply 3.1 2.3 - 25.8% -- -- -- Affordability Ratio 53 54 + 1.9% 4-2014 4-2015 4-2016 4-2017 4-2014 4-2015 4-2016 4-2017 4-2014 4-2015 4-2016 4-2017 4-2014 4-2015 4-2016 4-2017 4-2014 4-2015 4-2016 4-2017 4-2014 4-2015 4-2016 4-2017 4-2014 4-2015 4-2016 4-2017 4-2014 4-2015 4-2016 4-2017 4-2014 4-2015 4-2016 4-2017 4-2014 4-2015 4-2016 4-2017 4-2014 4-2015 4-2016 4-2017
- 4. New Listings New Listings Single Family Year-Over-Year Change Condo/TIC/ Coop Year-Over-Year Change May-2016 256 -1.5% 373 +11.3% Jun-2016 238 -5.9% 408 +30.8% Jul-2016 232 -9.4% 279 -5.1% Aug-2016 202 -13.7% 285 -0.7% Sep-2016 345 +6.2% 432 -1.4% Oct-2016 222 -15.6% 300 -6.8% Nov-2016 136 -4.9% 159 -18.5% Dec-2016 69 +3.0% 118 -2.5% Jan-2017 174 -4.9% 327 +11.2% Feb-2017 179 -21.1% 316 -6.2% Mar-2017 251 -8.1% 324 -14.1% Apr-2017 206 -27.0% 238 -36.0% 12-Month Avg 209 -9.3% 297 -3.4% Historical New Listings by Month Current as ofMay 11, 2017.All data from the San Francisco MLS. Report © 2017 ShowingTime. | 4 A count of the properties that have been newly listed on the market in a given month. 251 354 282 372 206 238 Single Family Condo/TIC/Coop April 0 100 200 300 400 500 600 700 1-2005 1-2006 1-2007 1-2008 1-2009 1-2010 1-2011 1-2012 1-2013 1-2014 1-2015 1-2016 1-2017 Single Family Condo/TIC/Coop 939 1,249 965 1,380 810 1,205 Single Family Condo/TIC/Coop Year to Date 2015 2016 2017 - 36.0%+ 5.1%- 27.0%+ 12.4% + 10.5%- 16.1%+ 2.8% - 12.7% 2015 2016 2017 2015 2016 2017 2015 2016 2017 + 4.1% + 7.4% - 4.4%- 3.5%
- 5. Pending Sales Pending Sales Single Family Year-Over-Year Change Condo/TIC/ Coop Year-Over-Year Change May-2016 249 +19.1% 285 -2.1% Jun-2016 229 +4.1% 262 -10.9% Jul-2016 169 -19.1% 258 +2.8% Aug-2016 198 -3.4% 236 +2.2% Sep-2016 186 -6.5% 216 0.0% Oct-2016 222 -16.5% 250 -11.7% Nov-2016 209 +19.4% 266 +11.3% Dec-2016 123 -6.1% 178 +1.7% Jan-2017 93 -6.1% 144 +0.7% Feb-2017 135 +8.9% 206 -9.6% Mar-2017 213 +9.2% 302 +33.6% Apr-2017 191 -10.7% 229 -6.1% 12-Month Avg 185 -1.3% 236 +0.4% Historical Pending Sales by Month Current as ofMay 11, 2017.All data from the San Francisco MLS. Report © 2017 ShowingTime. | 5 A count of the properties on which offers have been accepted in a given month. 226 280 214 244 191 229 Single Family Condo/TIC/Coop April 0 100 200 300 400 1-2005 1-2006 1-2007 1-2008 1-2009 1-2010 1-2011 1-2012 1-2013 1-2014 1-2015 1-2016 1-2017 Single Family Condo/TIC/Coop 705 933 632 841 632 881 Single Family Condo/TIC/Coop Year to Date 2015 2016 2017 - 6.1%- 12.9%- 10.7%- 5.3% - 9.9%0.0%- 10.4% + 4.8% 2015 2016 2017 2015 2016 2017 2015 2016 2017 + 9.2% - 2.2% - 8.7%- 4.4%
- 6. Sold Listings Sold Listings Single Family Year-Over-Year Change Condo/TIC/ Coop Year-Over-Year Change May-2016 200 -2.4% 258 -9.8% Jun-2016 245 +11.9% 268 -7.9% Jul-2016 202 -14.4% 249 -8.5% Aug-2016 191 -3.5% 259 +13.1% Sep-2016 178 +8.5% 234 +29.3% Oct-2016 227 -7.0% 236 -11.3% Nov-2016 205 +9.0% 263 +27.1% Dec-2016 200 -3.8% 237 -16.3% Jan-2017 105 +1.0% 150 +0.7% Feb-2017 110 +7.8% 156 -7.1% Mar-2017 173 +9.5% 285 +13.5% Apr-2017 194 -7.2% 224 +0.9% 12-Month Avg 186 -0.2% 235 +0.5% Historical Sold Listings by Month Current as ofMay 11, 2017.All data from the San Francisco MLS. Report © 2017 ShowingTime. | 6 A count of the actual sales that closed in a given month. 219 288 209 222 194 224 Single Family Condo/TIC/Coop April 0 100 200 300 400 1-2005 1-2006 1-2007 1-2008 1-2009 1-2010 1-2011 1-2012 1-2013 1-2014 1-2015 1-2016 1-2017 Single Family Condo/TIC/Coop 647 871 573 790 582 815 Single Family Condo/TIC/Coop Year to Date 2015 2016 2017 + 0.9%- 22.9%- 7.2%- 4.6% - 9.3%+ 1.6%- 11.4% + 3.2% 2015 2016 2017 2015 2016 2017 2015 2016 2017 + 6.3% - 3.9% - 12.4%- 11.7%
- 7. Median Sales Price Median Sales Price Single Family Year-Over-Year Change Condo/TIC/ Coop Year-Over-Year Change May-2016 $1,350,000 -3.6% $1,082,500 -2.7% Jun-2016 $1,325,000 +1.9% $1,175,000 +6.3% Jul-2016 $1,305,000 +2.0% $1,045,000 +1.1% Aug-2016 $1,250,000 +2.0% $1,060,000 +1.4% Sep-2016 $1,216,875 +5.4% $1,022,500 -1.7% Oct-2016 $1,400,000 +10.5% $1,137,500 +3.4% Nov-2016 $1,356,000 +7.4% $1,058,000 -6.0% Dec-2016 $1,301,511 +8.3% $1,015,000 -7.6% Jan-2017 $1,250,000 +7.1% $1,000,000 -5.7% Feb-2017 $1,287,500 -7.4% $1,192,500 +8.7% Mar-2017 $1,350,000 -0.2% $1,137,500 +3.9% Apr-2017 $1,402,500 +1.6% $1,100,000 -4.3% 12-Month Avg* $1,325,000 +3.5% $1,089,266 -1.0% Historical Median Sales Price by Month * Median Sales Price for all properties from May 2016 through April 2017. This is not the average of the individual figures above. Current as ofMay 11, 2017.All data from the San Francisco MLS. Report © 2017 ShowingTime. | 7 Point at which half of the sales sold for more and half sold for less, not accounting for seller concessions, in a given month. $1,300,000 $1,077,500 $1,380,000 $1,149,500 $1,402,500 $1,100,000 Single Family Condo/TIC/Coop April $400,000 $600,000 $800,000 $1,000,000 $1,200,000 $1,400,000 $1,600,000 1-2005 1-2006 1-2007 1-2008 1-2009 1-2010 1-2011 1-2012 1-2013 1-2014 1-2015 1-2016 1-2017 Single Family Condo/TIC/Coop $1,208,000 $1,060,000 $1,330,000 $1,100,000 $1,344,000 $1,108,000 Single Family Condo/TIC/Coop Year to Date 2015 2016 2017 - 4.3%+ 6.7%+ 1.6%+ 6.2% + 3.8%+ 1.1%+ 10.1% + 0.7% 2015 2016 2017 2015 2016 2017 2015 2016 2017 + 18.2% + 20.7% + 13.4%+ 19.1%
- 8. Average Sales Price Avg. Sales Price Single Family Year-Over-Year Change Condo/TIC/ Coop Year-Over-Year Change May-2016 $1,632,775 -11.3% $1,269,432 -4.5% Jun-2016 $1,752,261 -1.4% $1,218,386 -6.3% Jul-2016 $1,721,337 +3.8% $1,206,077 -0.7% Aug-2016 $1,537,059 +2.1% $1,228,996 +6.0% Sep-2016 $1,487,123 +6.9% $1,208,673 +3.6% Oct-2016 $2,000,319 +23.1% $1,263,882 +6.7% Nov-2016 $1,772,478 +4.2% $1,140,559 -9.4% Dec-2016 $1,658,512 +10.8% $1,252,727 +0.2% Jan-2017 $1,630,847 +3.9% $1,161,831 -0.6% Feb-2017 $1,685,855 +4.6% $1,367,391 +13.1% Mar-2017 $1,891,127 +6.0% $1,273,467 +1.4% Apr-2017 $1,898,215 +7.4% $1,302,924 -4.8% 12-Month Avg* $1,732,327 +4.9% $1,239,097 -0.4% Historical Average Sales Price by Month * Avg. Sales Price for all properties from May 2016 through April 2017. This is not the average of the individual figures above. Current as ofMay 11, 2017.All data from the San Francisco MLS. Report © 2017 ShowingTime. | 8 Average sales price for all closed sales, not accounting for seller concessions, in a given month. $1,760,933 $1,317,148 $1,767,919 $1,368,109 $1,898,215 $1,302,924 Single Family Condo/TIC/Coop April $500,000 $750,000 $1,000,000 $1,250,000 $1,500,000 $1,750,000 $2,000,000 $2,250,000 1-2005 1-2006 1-2007 1-2008 1-2009 1-2010 1-2011 1-2012 1-2013 1-2014 1-2015 1-2016 1-2017 Single Family Condo/TIC/Coop $1,633,456 $1,250,723 $1,708,387 $1,261,092 $1,807,735 $1,278,995 Single Family Condo/TIC/Coop Year to Date 2015 2016 2017 - 4.8%+ 3.9%+ 7.4%+ 0.4% + 0.8%+ 5.8%+ 4.6% + 1.4% 2015 2016 2017 2015 2016 2017 2015 2016 2017 + 16.4% + 15.4% + 16.8%+ 18.4%
- 9. Days on Market Until Sale Days on Market Single Family Year-Over-Year Change Condo/TIC/ Coop Year-Over-Year Change May-2016 26 +13.0% 33 +17.9% Jun-2016 29 +3.6% 35 +34.6% Jul-2016 32 +28.0% 39 +34.5% Aug-2016 33 +17.9% 46 +58.6% Sep-2016 41 +51.9% 40 +17.6% Oct-2016 27 0.0% 34 +30.8% Nov-2016 37 +32.1% 40 +17.6% Dec-2016 41 +24.2% 48 +11.6% Jan-2017 42 +5.0% 59 +34.1% Feb-2017 34 +9.7% 36 +2.9% Mar-2017 31 +24.0% 32 +6.7% Apr-2017 26 -18.8% 33 -13.2% 12-Month Avg* 33 +15.3% 39 +20.2% Historical Days on Market Until Sale by Month * Days on Market for all properties from May 2016 through April 2017. This is not the average of the individual figures above. Current as ofMay 11, 2017.All data from the San Francisco MLS. Report © 2017 ShowingTime. | 9 Average number of days between when a property is listed and when an offer is accepted in a given month. 23 3132 38 26 33 Single Family Condo/TIC/Coop April 20 40 60 80 100 120 1-2005 1-2006 1-2007 1-2008 1-2009 1-2010 1-2011 1-2012 1-2013 1-2014 1-2015 1-2016 1-2017 Single Family Condo/TIC/Coop 27 33 31 36 32 38 Single Family Condo/TIC/Coop Year to Date 2015 2016 2017 - 13.2%+ 22.6%- 18.8%+ 39.1% + 9.1%+ 3.2%+ 14.8% + 5.6% 2015 2016 2017 2015 2016 2017 2015 2016 2017 - 34.3% - 25.0% - 8.3%0.0%
- 10. Inventory of Active Listings Active Listings Single Family Year-Over-Year Change Condo/TIC/ Coop Year-Over-Year Change May-2016 466 +19.8% 743 +48.0% Jun-2016 441 +11.9% 800 +67.4% Jul-2016 462 +14.1% 719 +48.6% Aug-2016 415 +6.7% 681 +39.3% Sep-2016 527 +10.0% 820 +21.7% Oct-2016 486 +10.2% 794 +21.2% Nov-2016 378 +4.1% 583 +8.0% Dec-2016 254 +10.4% 395 +5.9% Jan-2017 313 +4.3% 543 +9.9% Feb-2017 340 -12.1% 607 +9.8% Mar-2017 348 -22.3% 585 -10.4% Apr-2017 339 -30.1% 542 -24.9% 12-Month Avg* 397 +1.3% 651 +18.1% Historical Inventory of Active Listings by Month * Active Listings for all properties from May 2016 through April 2017. This is not the average of the individual figures above. Current as ofMay 11, 2017.All data from the San Francisco MLS. Report © 2017 ShowingTime. | 10 The number of properties available for sale in active status at the end of a given month. 360 495485 722 339 542 Single Family Condo/TIC/Coop April 200 400 600 800 1,000 1,200 1,400 1,600 1-2005 1-2006 1-2007 1-2008 1-2009 1-2010 1-2011 1-2012 1-2013 1-2014 1-2015 1-2016 1-2017 Single Family Condo/TIC/Coop 2015 2016 2017 - 24.9%+ 45.9%- 30.1%+ 34.7% 2015 2016 2017 + 6.8% - 4.1%
- 11. % of Properties Sold Over List Price % of Properties Sold Over List Price Single Family Year-Over-Year Change Condo/TIC/ Coop Year-Over-Year Change May-2016 79.5% -4.7% 67.4% -12.0% Jun-2016 71.8% -16.8% 62.3% -16.5% Jul-2016 76.2% -9.6% 58.6% -20.7% Aug-2016 75.9% -15.1% 48.6% -32.6% Sep-2016 77.5% -12.3% 58.1% -19.1% Oct-2016 78.9% -5.2% 53.8% -29.5% Nov-2016 73.2% -5.8% 63.1% -9.3% Dec-2016 69.0% -13.0% 42.2% -29.0% Jan-2017 62.9% -17.2% 38.7% -27.0% Feb-2017 79.1% +2.1% 58.3% 0.0% Mar-2017 74.6% -9.4% 62.1% -8.3% Apr-2017 77.3% +2.2% 62.5% +3.5% 12-Month Avg 74.9% -9.0% 57.0% -17.0% Historical % of Properties Sold Over List Price by Month * % of Properties Sold Over List Price for all properties from May 2016 through April 2017. This is not the average of the individual figures above. Current as ofMay 11, 2017.All data from the San Francisco MLS. Report © 2017 ShowingTime. | 11 Percentage found when dividing the number of properties sold by properties sold over its original list price, not accounting for seller concessions. 83.6% 71.2% 75.6% 60.4% 77.3% 62.5% Single Family Condo/TIC/Coop April 0.0% 20.0% 40.0% 60.0% 80.0% 100.0% 1-2005 1-2006 1-2007 1-2008 1-2009 1-2010 1-2011 1-2012 1-2013 1-2014 1-2015 1-2016 1-2017 Single Family Condo/TIC/Coop 78.1% 67.0% 77.8% 60.9% 74.2% 57.2% Single Family Condo/TIC/Coop Year to Date 2015 2016 2017 + 3.5%- 15.2%+ 2.2%- 9.6% - 9.1%- 4.6%- 0.4% - 6.1% 2015 2016 2017 2015 2016 2017 2015 2016 2017 - 2.7% + 0.9% + 2.1%+ 1.9%
- 12. % of List Price Received % of List Price Received Single Family Year-Over-Year Change Condo/TIC/ Coop Year-Over-Year Change May-2016 115.2% -2.7% 106.1% -5.0% Jun-2016 110.3% -5.8% 105.3% -4.4% Jul-2016 111.8% -5.1% 104.8% -4.0% Aug-2016 111.5% -4.9% 102.9% -5.3% Sep-2016 110.8% -5.9% 104.2% -4.1% Oct-2016 111.2% -2.9% 104.2% -4.7% Nov-2016 109.2% -2.8% 104.6% -2.7% Dec-2016 108.4% -3.5% 101.5% -2.7% Jan-2017 107.7% -3.0% 101.4% -2.3% Feb-2017 114.1% +1.3% 104.1% -1.7% Mar-2017 112.4% -2.0% 105.0% -1.2% Apr-2017 115.8% +2.2% 105.2% 0.0% 12-Month Avg* 111.5% -3.2% 104.2% -3.3% Historical % of List Price Received by Month * % of List Price Received for all properties from May 2016 through April 2017. This is not the average of the individual figures above. Current as ofMay 11, 2017.All data from the San Francisco MLS. Report © 2017 ShowingTime. | 12 Percentage found when dividing a property’s sales price by its most recent list price, then taking the average for all properties sold in a given month, not accounting for seller concessions. 116.8% 109.3% 113.3% 105.2% 115.8% 105.2% Single Family Condo/TIC/Coop April 113.9% 108.4% 113.2% 105.4% 113.0% 104.2% Single Family Condo/TIC/Coop Year to Date 95.0% 100.0% 105.0% 110.0% 115.0% 120.0% 1-2005 1-2006 1-2007 1-2008 1-2009 1-2010 1-2011 1-2012 1-2013 1-2014 1-2015 1-2016 1-2017 Single Family Condo/TIC/Coop 2015 2016 2017 0.0%- 3.8%+ 2.2%- 3.0% 2015 2016 2017 + 1.5% + 1.0% 2015 2016 2017 - 1.1%- 2.8%- 0.2%- 0.6% 2015 2016 2017 + 2.1% + 1.5%
- 13. Housing Affordability Ratio Affordability Ratio Single Family Year-Over-Year Change Condo/TIC/ Coop Year-Over-Year Change May-2016 39 +11.4% 56 +7.7% Jun-2016 40 +8.1% 53 +3.9% Jul-2016 41 +10.8% 59 +9.3% Aug-2016 43 +10.3% 59 +11.3% Sep-2016 44 +4.8% 61 +13.0% Oct-2016 39 +2.6% 56 +9.8% Nov-2016 38 0.0% 56 +12.0% Dec-2016 38 -5.0% 56 +9.8% Jan-2017 39 -11.4% 56 0.0% Feb-2017 39 +2.6% 49 -12.5% Mar-2017 37 -5.1% 51 -8.9% Apr-2017 36 -5.3% 54 +1.9% 12-Month Avg* 39 -7.5% 39 +1.6% Historical Housing Affordability Ratio by Month * Affordability Ratio for all properties from May 2016 through April 2017. This is not the average of the individual figures above. Current as ofMay 11, 2017.All data from the San Francisco MLS. Report © 2017 ShowingTime. | 13 This index measures housing affordability for the region. For example, an index of 120 means the median household income is 120% of what is necessary to qualify for the median-priced home under prevailing interest rates. A higher number means greater affordability. 38 53 38 53 36 54 Single Family Condo/TIC/Coop April 30 40 50 60 70 80 90 100 1-2005 1-2006 1-2007 1-2008 1-2009 1-2010 1-2011 1-2012 1-2013 1-2014 1-2015 1-2016 1-2017 Single Family Condo/TIC/Coop 2015 2016 2017 + 1.9%0.0%- 5.3%0.0% 2015 2016 2017 - 5.0% - 5.4% 41 54 39 56 38 54 Single Family Condo/TIC/Coop Year to Date 2015 2016 2017 - 3.6%+ 3.7%- 2.6%- 4.9% 2015 2016 2017 - 6.8% 0.0%
- 14. Months Supply of Inventory Months Supply Single Family Year-Over-Year Change Condo/TIC/ Coop Year-Over-Year Change May-2016 2.4 +20.0% 3.2 +60.0% Jun-2016 2.3 +15.0% 3.4 +78.9% Jul-2016 2.5 +25.0% 3.1 +63.2% Aug-2016 2.2 +10.0% 2.9 +45.0% Sep-2016 2.8 +16.7% 3.5 +29.6% Oct-2016 2.7 +22.7% 3.4 +25.9% Nov-2016 2.0 +5.3% 2.5 +13.6% Dec-2016 1.4 +16.7% 1.7 +13.3% Jan-2017 1.7 +6.3% 2.3 +15.0% Feb-2017 1.8 -10.0% 2.6 +13.0% Mar-2017 1.9 -20.8% 2.5 -7.4% Apr-2017 1.8 -30.8% 2.3 -25.8% 12-Month Avg* 2.1 +5.4% 2.8 +24.1% Historical Months Supply of Inventory by Month * Months Supply for all properties from May 2016 through April 2017. This is not the average of the individual figures above. Current as ofMay 11, 2017.All data from the San Francisco MLS. Report © 2017 ShowingTime. | 14 The inventory of homes for sale at the end of a given month, divided by the average monthly pending sales from the last 12 months. 1.8 1.9 2.6 3.1 1.8 2.3 Single Family Condo/TIC/Coop April 0.0 2.0 4.0 6.0 8.0 10.0 1-2005 1-2006 1-2007 1-2008 1-2009 1-2010 1-2011 1-2012 1-2013 1-2014 1-2015 1-2016 1-2017 Single Family Condo/TIC/Coop 2015 2016 2017 - 25.8%+ 63.2%- 30.8%+ 44.4% 2015 2016 2017 + 12.5% + 5.6%
- 15. All Properties Activity Overview Key metrics by report month and for year-to-date (YTD) starting from the first of the year. Key Metrics Historical Sparkbars 4-2016 4-2017 Percent Change YTD 2016 YTD 2017 Percent Change - 14.1% Pending Sales 458 420 - 8.3% 1,473 1,513 + 2.7% New Listings 654 444 - 32.1% 2,345 2,015 Sold Listings 431 418 - 3.0% 1,363 1,397 + 2.5% Median Sales Price $1,280,000 $1,250,000 - 2.3% $1,192,999 $1,204,000 + 0.9% + 3.5% 35 + 2.9% $1,499,272 -- -- Days on Market 35 30 - 14.3% 34 Avg. Sales Price $1,561,985 $1,579,208 + 1.1% $1,449,133 Active Listings 1,207 881 - 27.0% -- % of Properties Sold Over List Price 67.7% 69.4% + 2.5% 68.0% 43 64.3% - 5.4% - 0.7% 40 - 7.0% 107.9%% of List Price Received 109.1% 110.1% + 0.9% 108.7% Current as ofMay 11, 2017.All data from the San Francisco MLS. Report © 2017 ShowingTime. | 15 Months Supply 2.9 2.1 - 27.6% -- -- -- Affordability Ratio 40 38 - 5.0% 4-2014 4-2015 4-2016 4-2017 4-2014 4-2015 4-2016 4-2017 4-2014 4-2015 4-2016 4-2017 4-2014 4-2015 4-2016 4-2017 4-2014 4-2015 4-2016 4-2017 4-2014 4-2015 4-2016 4-2017 4-2014 4-2015 4-2016 4-2017 4-2014 4-2015 4-2016 4-2017 4-2014 4-2015 4-2016 4-2017 4-2014 4-2015 4-2016 4-2017 4-2014 4-2015 4-2016 4-2017
- 16. Activity by District SF District 1: Northwest (Sea Cliff, Lake, Jordan Park / Laurel Heights, Outer Richmond, Central Richmond, Inner Richmond, Lone Mountain) SF District 2: Central West (Outer Sunset, Central Sunset, Inner Sunset, Outer Parkside, Parkside, Inner Parkside, Golden Gate Heights) SF District 3: Southwest (Pine Lake Park, Lake Shore, Merced Manor, Stonestown, Lakeside, Merced Heights, Ingleside, Ingleside Heights, Oceanview) SF District 4: Twin Peaks W (Forest Hill (& Ext), W Portal, St Francis Wd, Balboa Terr, Mt Dav Manor, Ingleside Terr, Monterey Hts, Wstwd Pk & H'lnds, Shrwd Fst, Miraloma Pk, Dmnd Hts, Mdtwn Terr) SF District 5: Central (Haight Ashbury, Cole Vly / Prnssus Hts, Clarndn Hts, Corona Hts, Twin Pks, Glen Pk, Noe Vly, Eureka Vly / Dolores Hts, Mission Dolores, Duboce Trngl, Buena Vista / Ashbury Hts) SF District 6: Central North (Lower Pacific Heights, Anza Vista, Western Addition, North Panhandle, Alamo Square, Hayes Valley) SF District 7: North (Marina, Cow Hollow, Presidio Heights, Pacific Heights) SF District 8: Northeast (North Waterfront, North Beach, Russian Hill, Telegraph Hill, Nob Hill, Financial District / Barbary Coast, Downtown, Van Ness / Civic Center, Tenderloin) SF District 9: Central East (Yerba Buena, South Beach, South of Market, Mission Bay, Inner Mission, Potrero Hill, Central Waterfront / Dogpatch, Bernal Heights) SF District 10: Southeast (Outer Mission, Mission Terr, Excelsior, Portola, Bayview, Silver Terr, Hunters Pt, Candlestick Pt, Bayview Hts, Little Hollywood, Visitation Vly, Crocker Amazon) 4-2016 4-2017 + / – 4-2016 4-2017 + / – 4-2016 4-2017 + / – 4-2016 4-2017 + / – 4-2016 4-2017 + / – Single Family 1 SF District 1 31 21 -32.3% 23 14 -39.1% $1,870,000 $1,787,500 -4.4% 19 26 +36.8% 2.1 1.5 -28.6% 2 SF District 2 63 34 -46.0% 44 35 -20.5% $1,200,000 $1,350,000 +12.5% 28 20 -28.6% 1.8 1.1 -38.9% 3 SF District 3 41 19 -53.7% 20 6 -70.0% $973,750 $1,330,000 +36.6% 32 19 -40.6% 2.7 1.3 -51.9% 4 SF District 4 63 26 -58.7% 29 26 -10.3% $1,450,000 $1,631,500 +12.5% 28 18 -35.7% 2.3 1.0 -56.5% 5 SF District 5 62 61 -1.6% 26 29 +11.5% $2,382,500 $2,450,000 +2.8% 31 29 -6.5% 2.6 2.3 -11.5% 6 SF District 6 7 5 -28.6% 4 2 -50.0% $1,300,000 $1,555,000 +19.6% 52 26 -50.0% 2.2 1.5 -31.8% 7 SF District 7 46 37 -19.6% 13 11 -15.4% $4,500,000 $6,100,000 +35.6% 67 61 -9.0% 5.9 4.7 -20.3% 8 SF District 8 12 14 +16.7% 0 2 -- $0 $3,300,000 -- 0 58 -- 5.7 5.9 +3.5% 9 SF District 9 62 55 -11.3% 17 26 +52.9% $1,675,000 $1,452,500 -13.3% 34 24 -29.4% 3.1 2.5 -19.4% 10 SF District 10 98 67 -31.6% 33 43 +30.3% $850,000 $890,000 +4.7% 32 26 -18.8% 2.5 1.8 -28.0% Condo/TIC/Coop 1 SF District 1 35 12 -65.7% 8 6 -25.0% $889,000 $1,517,500 +70.7% 37 18 -51.4% 2.6 1.1 -57.7% 2 SF District 2 12 6 -50.0% 4 0 -100.0% $959,500 $0 -100.0% 48 0 -100.0% 2.8 1.5 -46.4% 3 SF District 3 5 7 +40.0% 2 5 +150.0% $664,000 $695,000 +4.7% 21 31 +47.6% 1.1 1.9 +72.7% 4 SF District 4 6 8 +33.3% 3 5 +66.7% $658,000 $725,000 +10.2% 35 34 -2.9% 1.6 3.1 +93.8% 5 SF District 5 84 57 -32.1% 24 35 +45.8% $1,380,000 $1,310,000 -5.1% 26 24 -7.7% 2.5 1.6 -36.0% 6 SF District 6 93 51 -45.2% 17 26 +52.9% $1,190,000 $1,222,500 +2.7% 31 27 -12.9% 3.8 1.8 -52.6% 7 SF District 7 81 60 -25.9% 21 28 +33.3% $1,417,500 $1,440,000 +1.6% 24 24 0.0% 4.1 2.2 -46.3% 8 SF District 8 115 109 -5.2% 52 33 -36.5% $1,095,000 $900,000 -17.8% 31 32 +3.2% 2.9 2.9 0.0% 9 SF District 9 269 210 -21.9% 88 84 -4.5% $1,190,000 $1,030,000 -13.4% 51 42 -17.6% 3.1 2.7 -12.9% 10 SF District 10 22 22 0.0% 3 2 -33.3% $985,000 $831,250 -15.6% 55 39 -29.1% 3.9 3.2 -17.9% Key metrics by report month for the districts of San Fransisco. Current as ofMay 11, 2017.All data from the San Francisco MLS. Report © 2017 ShowingTime. | 16 Active Listings Sold Listings Median Sales Price Days on Market Months Supply