May 2023 Monthly Snapshot Shows Declines in SF Housing Market
•
0 likes•6 views

San Francisco May 2023 Market Report

Recommended
Recommended
More Related Content
Similar to May 2023 Monthly Snapshot Shows Declines in SF Housing Market
Similar to May 2023 Monthly Snapshot Shows Declines in SF Housing Market (20)
Recently uploaded
Recently uploaded (20)
May 2023 Monthly Snapshot Shows Declines in SF Housing Market
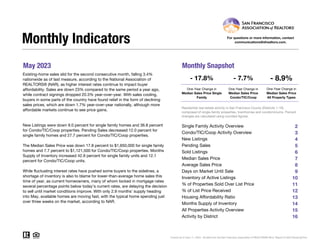
- 1. May 2023 Monthly Snapshot One-Year Change in One-Year Change in Median Sales Price Single Family Median Sales Price Condo/TIC/Coop 2 3 4 5 6 7 8 9 10 11 12 13 14 15 16 Monthly Indicators - 17.8% - 7.7% - 8.9% One-Year Change in Existing-home sales slid for the second consecutive month, falling 3.4% nationwide as of last measure, according to the National Association of REALTORS® (NAR), as higher interest rates continue to impact buyer affordability. Sales are down 23% compared to the same period a year ago, while contract signings dropped 20.3% year-over-year. With sales cooling, buyers in some parts of the country have found relief in the form of declining sales prices, which are down 1.7% year-over-year nationally, although more affordable markets continue to see price gains. New Listings were down 9.0 percent for single family homes and 36.8 percent for Condo/TIC/Coop properties. Pending Sales decreased 12.0 percent for single family homes and 27.7 percent for Condo/TIC/Coop properties. The Median Sales Price was down 17.8 percent to $1,650,000 for single family homes and 7.7 percent to $1,121,500 for Condo/TIC/Coop properties. Months Supply of Inventory increased 42.9 percent for single family units and 12.1 percent for Condo/TIC/Coop units. While fluctuating interest rates have pushed some buyers to the sidelines, a shortage of inventory is also to blame for lower-than-average home sales this time of year, as current homeowners, many of whom locked in mortgage rates several percentage points below today’s current rates, are delaying the decision to sell until market conditions improve. With only 2.9 months’ supply heading into May, available homes are moving fast, with the typical home spending just over three weeks on the market, according to NAR. Median Sales Price All Property Types Residential real estate activity in San Francisco County (Districts 1-10) composed of single-family properties, townhomes and condominiums. Percent changes are calculated using rounded figures. Single Family Activity Overview Months Supply of Inventory For questions or more information, contact communications@sfrealtors.com. Current as of June 11, 2023. All data from the San Francisco Association of REALTORS® MLS. Report © 2023 ShowingTime. Condo/TIC/Coop Activity Overview Inventory of Active Listings % of Properties Sold Over List Price % of List Price Received Housing Affordability Ratio All Properties Activity Overview New Listings Pending Sales Sold Listings Median Sales Price Average Sales Price Days on Market Until Sale Activity by District
- 2. Single Family Activity Overview Key metrics by report month and for year-to-date (YTD) starting from the first of the year. Key Metrics Historical Sparkbars 5-2022 5-2023 Percent Change YTD 2022 YTD 2023 Percent Change Current as of June 11, 2023. All data from the San Francisco Association of REALTORS® MLS. Report © 2023 ShowingTime. | 2 Months Supply 1.4 2.0 + 42.9% -- -- -- Affordability Ratio 22 25 + 13.6% % of List Price Received 119.6% 108.3% - 9.4% 120.9% 23 58.3% - 32.1% - 11.9% 26 + 13.0% 106.5% % of Properties Sold Over List Price 86.9% 63.1% - 27.4% 85.8% Active Listings 331 330 - 0.3% -- Avg. Sales Price $2,411,895 $2,150,735 - 10.8% $2,411,900 Days on Market 21 28 + 33.3% 21 33 + 57.1% $2,102,273 -- -- Median Sales Price $2,007,500 $1,650,000 - 17.8% $1,955,000 Sold Listings 282 187 - 33.7% 1,085 New Listings 301 274 - 9.0% 1,488 Pending Sales 249 219 - 12.0% - 32.0% 1,165 792 - 26.4% 1,095 713 - 34.3% $1,570,000 - 19.7% - 12.8% 5-2020 5-2021 5-2022 5-2023 5-2020 5-2021 5-2022 5-2023 5-2020 5-2021 5-2022 5-2023 5-2020 5-2021 5-2022 5-2023 5-2020 5-2021 5-2022 5-2023 5-2020 5-2021 5-2022 5-2023 5-2020 5-2021 5-2022 5-2023 5-2020 5-2021 5-2022 5-2023 5-2020 5-2021 5-2022 5-2023 5-2020 5-2021 5-2022 5-2023 5-2020 5-2021 5-2022 5-2023
- 3. Condo/TIC/Coop Activity Overview Key metrics by report month and for year-to-date (YTD) starting from the first of the year. Key Metrics Historical Sparkbars 5-2022 5-2023 Percent Change YTD 2022 YTD 2023 Percent Change Current as of June 11, 2023. All data from the San Francisco Association of REALTORS® MLS. Report © 2023 ShowingTime. | 3 Months Supply 3.3 3.7 + 12.1% -- -- -- Affordability Ratio 42 41 - 2.4% % of List Price Received 105.9% 100.1% - 5.5% 105.8% 41 33.6% - 40.4% - 5.8% 42 + 2.4% 99.7% % of Properties Sold Over List Price 55.3% 41.2% - 25.5% 56.4% Active Listings 1,121 753 - 32.8% -- Avg. Sales Price $1,403,091 $1,180,402 - 15.9% $1,410,683 Days on Market 37 52 + 40.5% 38 $1,100,000 - 12.0% - 10.7% 58 + 52.6% $1,259,911 -- -- Sold Listings 368 226 - 38.6% 1,579 934 - 40.8% Median Sales Price $1,215,000 $1,121,500 - 7.7% $1,250,000 - 37.6% Pending Sales 332 240 - 27.7% 1,650 1,020 - 38.2% New Listings 516 326 - 36.8% 2,680 1,671 5-2020 5-2021 5-2022 5-2023 5-2020 5-2021 5-2022 5-2023 5-2020 5-2021 5-2022 5-2023 5-2020 5-2021 5-2022 5-2023 5-2020 5-2021 5-2022 5-2023 5-2020 5-2021 5-2022 5-2023 5-2020 5-2021 5-2022 5-2023 5-2020 5-2021 5-2022 5-2023 5-2020 5-2021 5-2022 5-2023 5-2020 5-2021 5-2022 5-2023 5-2020 5-2021 5-2022 5-2023
- 4. New Listings New Listings Single Family Year-Over-Year Change Condo/TIC/ Coop Year-Over-Year Change Jun-2022 319 -5.1% 451 -9.8% Jul-2022 241 -21.2% 382 -16.6% Aug-2022 239 -13.7% 309 -20.4% Sep-2022 367 -13.2% 574 -20.5% Oct-2022 243 -27.0% 378 -28.5% Nov-2022 153 -10.5% 154 -41.9% Dec-2022 72 -13.3% 78 -46.9% Jan-2023 168 -26.3% 344 -27.1% Feb-2023 175 -39.2% 315 -41.1% Mar-2023 242 -29.2% 362 -41.2% Apr-2023 236 -28.3% 324 -40.1% May-2023 274 -9.0% 326 -36.8% 12-Month Avg 227 -20.1% 333 -29.7% Historical New Listings by Month Current as of June 11, 2023. All data from the San Francisco Association of REALTORS® MLS. Report © 2023 ShowingTime. | 4 A count of the properties that have been newly listed on the market in a given month. 356 510 301 516 274 326 Single Family Condo/TIC/Coop May 0 200 400 600 800 1-2005 1-2006 1-2007 1-2008 1-2009 1-2010 1-2011 1-2012 1-2013 1-2014 1-2015 1-2016 1-2017 1-2018 1-2019 1-2020 1-2021 1-2022 1-2023 Single Family Condo/TIC/Coop 1,530 2,632 1,488 2,680 1,095 1,671 Single Family Condo/TIC/Coop Year to Date 2021 2022 2023 - 36.8% + 1.2% - 9.0% - 15.4% + 1.8% - 26.4% - 2.7% - 37.6% 2021 2022 2023 2021 2022 2023 2021 2022 2023 + 27.6% + 41.8% + 60.9% + 14.1%
- 5. Pending Sales Pending Sales Single Family Year-Over-Year Change Condo/TIC/ Coop Year-Over-Year Change Jun-2022 197 -28.1% 260 -33.0% Jul-2022 181 -30.1% 222 -39.0% Aug-2022 180 -20.4% 232 -26.6% Sep-2022 189 -42.6% 213 -36.8% Oct-2022 195 -28.6% 222 -45.2% Nov-2022 166 -35.9% 160 -55.6% Dec-2022 116 -10.1% 122 -46.0% Jan-2023 87 -40.0% 123 -51.0% Feb-2023 127 -40.9% 177 -38.3% Mar-2023 170 -40.8% 246 -43.7% Apr-2023 189 -29.7% 234 -31.8% May-2023 219 -12.0% 240 -27.7% 12-Month Avg 168 -30.8% 204 -39.4% Historical Pending Sales by Month A count of the properties on which offers have been accepted in a given month. Current as of June 11, 2023. All data from the San Francisco Association of REALTORS® MLS. Report © 2023 ShowingTime. | 5 307 463 249 332 219 240 Single Family Condo/TIC/Coop May 0 100 200 300 400 500 600 1-2005 1-2006 1-2007 1-2008 1-2009 1-2010 1-2011 1-2012 1-2013 1-2014 1-2015 1-2016 1-2017 1-2018 1-2019 1-2020 1-2021 1-2022 1-2023 Single Family Condo/TIC/Coop 1,277 2,090 1,165 1,650 792 1,020 Single Family Condo/TIC/Coop Year to Date 2021 2022 2023 - 27.7% - 28.3% - 12.0% - 18.9% - 21.1% - 32.0% - 8.8% - 38.2% 2021 2022 2023 2021 2022 2023 2021 2022 2023 + 89.5% + 88.1% + 159.3% + 226.1%
- 6. Sold Listings Sold Listings Single Family Year-Over-Year Change Condo/TIC/ Coop Year-Over-Year Change Jun-2022 249 -23.6% 309 -34.7% Jul-2022 182 -28.6% 235 -36.3% Aug-2022 189 -26.2% 237 -31.9% Sep-2022 180 -26.5% 210 -28.1% Oct-2022 192 -38.1% 224 -38.5% Nov-2022 186 -36.5% 206 -51.5% Dec-2022 154 -28.7% 147 -54.8% Jan-2023 100 -23.1% 104 -44.1% Feb-2023 101 -36.5% 142 -43.2% Mar-2023 150 -41.6% 247 -37.3% Apr-2023 175 -31.9% 215 -43.6% May-2023 187 -33.7% 226 -38.6% 12-Month Avg 170 -31.5% 209 -40.1% Historical Sold Listings by Month A count of the actual sales that closed in a given month. Current as of June 11, 2023. All data from the San Francisco Association of REALTORS® MLS. Report © 2023 ShowingTime. | 6 266 444 282 368 187 226 Single Family Condo/TIC/Coop May 0 100 200 300 400 500 1-2005 1-2006 1-2007 1-2008 1-2009 1-2010 1-2011 1-2012 1-2013 1-2014 1-2015 1-2016 1-2017 1-2018 1-2019 1-2020 1-2021 1-2022 1-2023 Single Family Condo/TIC/Coop 1,150 1,911 1,085 1,579 713 934 Single Family Condo/TIC/Coop Year to Date 2021 2022 2023 - 38.6% - 17.1% - 33.7% + 6.0% - 17.4% - 34.3% - 5.7% - 40.8% 2021 2022 2023 2021 2022 2023 2021 2022 2023 + 133.3% + 76.1% + 140.1% + 289.5%
- 7. Median Sales Price Median Sales Price Single Family Year-Over-Year Change Condo/TIC/ Coop Year-Over-Year Change Jun-2022 $1,880,000 -3.1% $1,240,000 -0.8% Jul-2022 $1,667,500 -9.9% $1,197,000 -1.1% Aug-2022 $1,610,000 -12.9% $1,000,000 -13.0% Sep-2022 $1,650,000 -5.7% $1,160,000 -3.3% Oct-2022 $1,670,000 -7.5% $1,200,000 -3.8% Nov-2022 $1,500,000 -20.2% $1,136,500 -9.8% Dec-2022 $1,537,500 -9.0% $950,000 -26.9% Jan-2023 $1,367,500 -16.1% $992,900 -7.2% Feb-2023 $1,440,000 -25.4% $1,162,500 -5.3% Mar-2023 $1,697,500 -15.1% $1,060,000 -12.2% Apr-2023 $1,570,000 -23.4% $1,180,000 -13.6% May-2023 $1,650,000 -17.8% $1,121,500 -7.7% 12-Month Avg* $1,625,000 -13.3% $1,125,000 -9.3% Historical Median Sales Price by Month Point at which half of the sales sold for more and half sold for less, not accounting for seller concessions, in a given month. * Median Sales Price for all properties from June 2022 through May 2023. This is not the average of the individual figures above. Current as of June 11, 2023. All data from the San Francisco Association of REALTORS® MLS. Report © 2023 ShowingTime. | 7 $1,886,500 $1,228,500 $2,007,500 $1,215,000 $1,650,000 $1,121,500 Single Family Condo/TIC/Coop May $500,000 $750,000 $1,000,000 $1,250,000 $1,500,000 $1,750,000 $2,000,000 $2,250,000 1-2005 1-2006 1-2007 1-2008 1-2009 1-2010 1-2011 1-2012 1-2013 1-2014 1-2015 1-2016 1-2017 1-2018 1-2019 1-2020 1-2021 1-2022 1-2023 Single Family Condo/TIC/Coop $1,755,000 $1,198,000 $1,955,000 $1,250,000 $1,570,000 $1,100,000 Single Family Condo/TIC/Coop Year to Date 2021 2022 2023 - 7.7% - 1.1% - 17.8% + 6.4% + 4.3% - 19.7% + 11.4% - 12.0% 2021 2022 2023 2021 2022 2023 2021 2022 2023 + 18.8% + 11.4% - 0.2% + 13.0%
- 8. Average Sales Price Average Sales Price Single Family Year-Over-Year Change Condo/TIC/ Coop Year-Over-Year Change Jun-2022 $2,355,940 -5.8% $1,366,119 -1.5% Jul-2022 $2,060,515 -10.1% $1,466,757 +8.1% Aug-2022 $1,950,088 -8.4% $1,174,880 -17.6% Sep-2022 $1,881,502 -13.1% $1,343,336 +0.8% Oct-2022 $2,211,462 -6.3% $1,418,171 -3.0% Nov-2022 $1,895,086 -19.4% $1,399,284 -9.1% Dec-2022 $1,870,417 -20.9% $1,098,424 -26.2% Jan-2023 $1,811,636 -8.1% $1,261,866 -3.8% Feb-2023 $1,823,104 -24.6% $1,296,409 -7.3% Mar-2023 $2,280,520 -10.0% $1,209,182 -14.4% Apr-2023 $2,224,904 -11.3% $1,376,716 -6.6% May-2023 $2,150,735 -10.8% $1,180,402 -15.9% 12-Month Avg* $2,069,893 -12.0% $1,307,559 -8.1% Historical Average Sales Price by Month Average sales price for all closed sales, not accounting for seller concessions, in a given month. * Avg. Sales Price for all properties from June 2022 through May 2023. This is not the average of the individual figures above. Current as of June 11, 2023. All data from the San Francisco Association of REALTORS® MLS. Report © 2023 ShowingTime. | 8 $2,479,992 $1,379,103 $2,411,895 $1,403,091 $2,150,735 $1,180,402 Single Family Condo/TIC/Coop May $500,000 $1,000,000 $1,500,000 $2,000,000 $2,500,000 $3,000,000 1-2005 1-2006 1-2007 1-2008 1-2009 1-2010 1-2011 1-2012 1-2013 1-2014 1-2015 1-2016 1-2017 1-2018 1-2019 1-2020 1-2021 1-2022 1-2023 Single Family Condo/TIC/Coop $2,297,900 $1,340,358 $2,411,900 $1,410,683 $2,102,273 $1,259,911 Single Family Condo/TIC/Coop Year to Date 2021 2022 2023 - 15.9% + 1.7% - 10.8% - 2.7% + 5.2% - 12.8% + 5.0% - 10.7% 2021 2022 2023 2021 2022 2023 2021 2022 2023 + 32.1% + 13.6% + 1.1% + 10.2%
- 9. Days on Market Until Sale Days on Market Until Sale Single Family Year-Over-Year Change Condo/TIC/ Coop Year-Over-Year Change Jun-2022 17 -10.5% 39 +5.4% Jul-2022 21 +10.5% 49 +16.7% Aug-2022 26 +4.0% 50 +16.3% Sep-2022 28 +21.7% 58 +45.0% Oct-2022 28 +40.0% 43 +19.4% Nov-2022 35 +66.7% 51 +24.4% Dec-2022 38 +22.6% 74 +57.4% Jan-2023 50 +22.0% 87 +27.9% Feb-2023 33 +50.0% 59 +63.9% Mar-2023 31 +93.8% 55 +61.8% Apr-2023 31 +93.8% 56 +75.0% May-2023 28 +33.3% 52 +40.5% 12-Month Avg* 29 +32.6% 53 +33.4% Historical Days on Market Until Sale by Month Average number of days between when a property is listed and when an offer is accepted in a given month. * Days on Market for all properties from June 2022 through May 2023. This is not the average of the individual figures above. Current as of June 11, 2023. All data from the San Francisco Association of REALTORS® MLS. Report © 2023 ShowingTime. | 9 20 39 21 37 28 52 Single Family Condo/TIC/Coop May 0 20 40 60 80 100 120 1-2005 1-2006 1-2007 1-2008 1-2009 1-2010 1-2011 1-2012 1-2013 1-2014 1-2015 1-2016 1-2017 1-2018 1-2019 1-2020 1-2021 1-2022 1-2023 Single Family Condo/TIC/Coop 26 52 21 38 33 58 Single Family Condo/TIC/Coop Year to Date 2021 2022 2023 + 40.5% - 5.1% + 33.3% + 5.0% - 26.9% + 57.1% - 19.2% + 52.6% 2021 2022 2023 2021 2022 2023 2021 2022 2023 - 28.6% - 3.7% + 26.8% - 11.4%
- 10. Inventory of Active Listings Inventory of Active Listings Single Family Year-Over-Year Change Condo/TIC/ Coop Year-Over-Year Change Jun-2022 376 -9.6% 1,103 +4.1% Jul-2022 366 -13.9% 1,021 -3.8% Aug-2022 350 -18.6% 895 -12.7% Sep-2022 482 +1.9% 1,104 -15.2% Oct-2022 472 -3.3% 1,094 -16.1% Nov-2022 374 +3.0% 865 -20.9% Dec-2022 215 +4.9% 516 -23.7% Jan-2023 258 -1.1% 645 -22.4% Feb-2023 283 -5.7% 717 -27.7% Mar-2023 317 0.0% 761 -27.5% Apr-2023 334 -0.9% 771 -30.6% May-2023 330 -0.3% 753 -32.8% 12-Month Avg* 346 -4.3% 854 -18.9% Historical Inventory of Active Listings by Month The number of properties available for sale in active status at the end of a given month. * Active Listings for all properties from June 2022 through May 2023. This is not the average of the individual figures above. Current as of June 11, 2023. All data from the San Francisco Association of REALTORS® MLS. Report © 2023 ShowingTime. | 10 406 1,070 331 1,121 330 753 Single Family Condo/TIC/Coop May 0 500 1,000 1,500 2,000 2,500 1-2005 1-2006 1-2007 1-2008 1-2009 1-2010 1-2011 1-2012 1-2013 1-2014 1-2015 1-2016 1-2017 1-2018 1-2019 1-2020 1-2021 1-2022 1-2023 Single Family Condo/TIC/Coop 2021 2022 2023 - 32.8% + 4.8% - 0.3% - 18.5% 2021 2022 2023 - 15.1% + 9.3%
- 11. % of Properties Sold Over List Price % of Properties Sold Over List Price Single Family Year-Over-Year Change Condo/TIC/ Coop Year-Over-Year Change Jun-2022 86.3% +5.0% 57.3% +5.5% Jul-2022 78.6% -5.9% 39.6% -28.8% Aug-2022 75.7% -10.3% 37.1% -32.1% Sep-2022 67.2% -20.5% 31.0% -43.1% Oct-2022 64.1% -24.1% 37.5% -38.2% Nov-2022 57.5% -27.7% 30.6% -45.2% Dec-2022 48.7% -38.1% 15.6% -66.5% Jan-2023 44.0% -41.6% 19.2% -50.4% Feb-2023 51.5% -40.7% 28.2% -51.7% Mar-2023 62.7% -27.4% 36.4% -37.3% Apr-2023 61.7% -30.4% 33.0% -47.6% May-2023 63.1% -27.4% 41.2% -25.5% 12-Month Avg 65.7% -21.6% 36.3% -34.5% Historical % of Properties Sold Over List Price by Month Percentage found when dividing the number of properties sold by properties sold over its original list price, not accounting for seller concessions. * % of Properties Sold Over List Price for all properties from June 2022 through May 2023. This is not the average of the individual figures above. Current as of June 11, 2023. All data from the San Francisco Association of REALTORS® MLS. Report © 2023 ShowingTime. | 11 79.7% 53.4% 86.9% 55.3% 63.1% 41.2% Single Family Condo/TIC/Coop May 0.0% 20.0% 40.0% 60.0% 80.0% 100.0% 1-2005 1-2006 1-2007 1-2008 1-2009 1-2010 1-2011 1-2012 1-2013 1-2014 1-2015 1-2016 1-2017 1-2018 1-2019 1-2020 1-2021 1-2022 1-2023 Single Family Condo/TIC/Coop 72.7% 41.8% 85.8% 56.4% 58.3% 33.6% Single Family Condo/TIC/Coop Year to Date 2021 2022 2023 - 25.5% + 3.6% - 27.4% + 9.0% + 34.9% - 32.1% + 18.0% - 40.4% 2021 2022 2023 2021 2022 2023 2021 2022 2023 + 26.1% + 3.1% - 21.1% + 26.8%
- 12. % of List Price Received % of List Price Received Single Family Year-Over-Year Change Condo/TIC/ Coop Year-Over-Year Change Jun-2022 116.8% +0.5% 105.3% 0.0% Jul-2022 111.0% -6.3% 101.5% -3.1% Aug-2022 108.4% -6.6% 100.7% -3.5% Sep-2022 108.5% -6.7% 100.6% -4.2% Oct-2022 107.1% -8.5% 100.4% -4.8% Nov-2022 104.9% -8.6% 99.2% -5.2% Dec-2022 102.9% -10.0% 98.1% -5.2% Jan-2023 103.2% -12.1% 98.0% -3.1% Feb-2023 103.7% -14.4% 99.0% -6.7% Mar-2023 108.0% -11.4% 100.4% -5.6% Apr-2023 107.0% -13.1% 99.9% -6.8% May-2023 108.3% -9.4% 100.1% -5.5% 12-Month Avg* 108.2% -8.3% 100.7% -4.3% Historical % of List Price Received by Month Percentage found when dividing a property’s sales price by its most recent list price, then taking the average for all properties sold in a given month, not accounting for seller concessions. * % of List Price Received for all properties from June 2022 through May 2023. This is not the average of the individual figures above. Current as of June 11, 2023. All data from the San Francisco Association of REALTORS® MLS. Report © 2023 ShowingTime. | 12 116.8% 105.2% 119.6% 105.9% 108.3% 100.1% Single Family Condo/TIC/Coop May 112.3% 102.6% 120.9% 105.8% 106.5% 99.7% Single Family Condo/TIC/Coop Year to Date 90.0% 100.0% 110.0% 120.0% 130.0% 1-2005 1-2006 1-2007 1-2008 1-2009 1-2010 1-2011 1-2012 1-2013 1-2014 1-2015 1-2016 1-2017 1-2018 1-2019 1-2020 1-2021 1-2022 1-2023 Single Family Condo/TIC/Coop 2021 2022 2023 - 5.5% + 0.7% - 9.4% + 2.4% 2021 2022 2023 + 10.4% + 4.8% 2021 2022 2023 - 5.8% + 3.1% - 11.9% + 7.7% 2021 2022 2023 + 2.1% - 0.7%
- 13. Housing Affordability Ratio Housing Affordability Ratio Single Family Year-Over-Year Change Condo/TIC/ Coop Year-Over-Year Change Jun-2022 23 -17.9% 40 -23.1% Jul-2022 27 -10.0% 43 -20.4% Aug-2022 28 -6.7% 51 -10.5% Sep-2022 24 -25.0% 39 -29.1% Oct-2022 23 -25.8% 37 -30.2% Nov-2022 27 -10.0% 39 -27.8% Dec-2022 27 -15.6% 49 0.0% Jan-2023 31 -3.1% 48 -15.8% Feb-2023 28 +3.7% 40 -18.4% Mar-2023 24 0.0% 44 -2.2% Apr-2023 26 +23.8% 39 +5.4% May-2023 25 +13.6% 41 -2.4% 12-Month Avg* 26 -11.7% 42 -18.5% Historical Housing Affordability Ratio by Month This index measures housing affordability for the region. For example, an index of 120 means the median household income is 120% of what is necessary to qualify for the median-priced home under prevailing interest rates. A higher number means greater affordability. * Affordability Ratio for all properties from June 2022 through May 2023. This is not the average of the individual figures above. Current as of June 11, 2023. All data from the San Francisco Association of REALTORS® MLS. Report © 2023 ShowingTime. | 13 30 54 22 42 25 41 Single Family Condo/TIC/Coop May 20 40 60 80 100 1-2005 1-2006 1-2007 1-2008 1-2009 1-2010 1-2011 1-2012 1-2013 1-2014 1-2015 1-2016 1-2017 1-2018 1-2019 1-2020 1-2021 1-2022 1-2023 Single Family Condo/TIC/Coop 2021 2022 2023 - 2.4% - 22.2% + 13.6% - 26.7% 2021 2022 2023 - 14.3% - 8.5% 32 55 23 41 26 42 Single Family Condo/TIC/Coop Year to Date 2021 2022 2023 + 2.4% - 25.5% + 13.0% - 28.1% 2021 2022 2023 - 8.6% + 1.9%
- 14. Months Supply of Inventory Months Supply of Inventory Single Family Year-Over-Year Change Condo/TIC/ Coop Year-Over-Year Change Jun-2022 1.6 0.0% 3.4 +13.3% Jul-2022 1.6 0.0% 3.2 +10.3% Aug-2022 1.5 -6.3% 2.9 +3.6% Sep-2022 2.2 +22.2% 3.7 +5.7% Oct-2022 2.3 +21.1% 3.9 +11.4% Nov-2022 1.9 +35.7% 3.3 +13.8% Dec-2022 1.1 +37.5% 2.0 +11.1% Jan-2023 1.3 +30.0% 2.6 +18.2% Feb-2023 1.5 +25.0% 3.0 +11.1% Mar-2023 1.8 +38.5% 3.4 +17.2% Apr-2023 2.0 +42.9% 3.6 +12.5% May-2023 2.0 +42.9% 3.7 +12.1% 12-Month Avg* 1.7 +22.3% 3.2 +11.7% Historical Months Supply of Inventory by Month The inventory of homes for sale at the end of a given month, divided by the average monthly pending sales from the last 12 months. * Months Supply for all properties from June 2022 through May 2023. This is not the average of the individual figures above. Current as of June 11, 2023. All data from the San Francisco Association of REALTORS® MLS. Report © 2023 ShowingTime. | 14 1.6 3.1 1.4 3.3 2.0 3.7 Single Family Condo/TIC/Coop May 0.0 2.0 4.0 6.0 8.0 10.0 12.0 1-2005 1-2006 1-2007 1-2008 1-2009 1-2010 1-2011 1-2012 1-2013 1-2014 1-2015 1-2016 1-2017 1-2018 1-2019 1-2020 1-2021 1-2022 1-2023 Single Family Condo/TIC/Coop 2021 2022 2023 + 12.1% + 6.5% + 42.9% - 12.5% 2021 2022 2023 - 40.7% - 36.7%
- 15. All Properties Activity Overview Key metrics by report month and for year-to-date (YTD) starting from the first of the year. Key Metrics Historical Sparkbars 5-2022 5-2023 Percent Change YTD 2022 YTD 2023 Percent Change Current as of June 11, 2023. All data from the San Francisco Association of REALTORS® MLS. Report © 2023 ShowingTime. | 15 Months Supply 2.5 2.9 + 16.0% -- -- -- Affordability Ratio 28 29 + 3.6% % of List Price Received 111.8% 103.7% - 7.2% 111.9% 28 44.2% - 35.3% - 8.3% 28 0.0% 102.6% % of Properties Sold Over List Price 68.9% 50.7% - 26.4% 68.3% Active Listings 1,484 1,105 - 25.5% -- Avg. Sales Price $1,835,885 $1,617,900 - 11.9% $1,814,274 Days on Market 30 41 + 36.7% 31 $1,310,000 - 12.7% - 10.6% 48 + 54.8% $1,621,744 -- -- Sold Listings 656 418 - 36.3% 2,691 1,668 - 38.0% Median Sales Price $1,500,000 $1,366,000 - 8.9% $1,500,000 - 33.4% Pending Sales 585 465 - 20.5% 2,841 1,837 - 35.3% New Listings 827 610 - 26.2% 4,213 2,805 5-2020 5-2021 5-2022 5-2023 5-2020 5-2021 5-2022 5-2023 5-2020 5-2021 5-2022 5-2023 5-2020 5-2021 5-2022 5-2023 5-2020 5-2021 5-2022 5-2023 5-2020 5-2021 5-2022 5-2023 5-2020 5-2021 5-2022 5-2023 5-2020 5-2021 5-2022 5-2023 5-2020 5-2021 5-2022 5-2023 5-2020 5-2021 5-2022 5-2023 5-2020 5-2021 5-2022 5-2023
- 16. Activity by District SF District 1: Northwest (Sea Cliff, Lake, Jordan Park / Laurel Heights, Outer Richmond, Central Richmond, Inner Richmond, Lone Mountain) SF District 2: Central West (Outer Sunset, Central Sunset, Inner Sunset, Outer Parkside, Parkside, Inner Parkside, Golden Gate Heights) SF District 3: Southwest (Pine Lake Park, Lake Shore, Merced Manor, Stonestown, Lakeside, Merced Heights, Ingleside, Ingleside Heights, Oceanview) SF District 4: Twin Peaks W (Forest Hill (& Ext), W Portal, St Francis Wd, Balboa Terr, Mt Dav Manor, Ingleside Terr, Monterey Hts, Wstwd Pk & H'lnds, Shrwd Fst, Miraloma Pk, Dmnd Hts, Mdtwn Terr) SF District 5: Central (Haight Ashbury, Cole Vly / Prnssus Hts, Clarndn Hts, Corona Hts, Twin Pks, Glen Pk, Noe Vly, Eureka Vly / Dolores Hts, Mission Dolores, Duboce Trngl, Buena Vista / Ashbury Hts) SF District 6: Central North (Lower Pacific Heights, Anza Vista, Western Addition, North Panhandle, Alamo Square, Hayes Valley) SF District 7: North (Marina, Cow Hollow, Presidio Heights, Pacific Heights) SF District 8: Northeast (North Waterfront, North Beach, Russian Hill, Telegraph Hill, Nob Hill, Financial District / Barbary Coast, Downtown, Van Ness / Civic Center, Tenderloin) SF District 9: Central East (Yerba Buena, South Beach, South of Market, Mission Bay, Inner Mission, Potrero Hill, Central Waterfront / Dogpatch, Bernal Heights) SF District 10: Southeast (Outer Mission, Mission Terr, Excelsior, Portola, Bayview, Silver Terr, Hunters Pt, Candlestick Pt, Bayview Hts, Little Hollywood, Visitation Vly, Crocker Amazon) 5-2022 5-2023 + / – 5-2022 5-2023 + / – 5-2022 5-2023 + / – 5-2022 5-2023 + / – 5-2022 5-2023 + / – Single Family 1 SF District 1 16 22 +37.5% 24 9 -62.5% $2,962,763 $1,955,000 -34.0% 14 22 +57.1% 0.7 1.6 +128.6% 2 SF District 2 44 46 +4.5% 61 37 -39.3% $1,905,000 $1,600,000 -16.0% 15 15 0.0% 0.9 1.4 +55.6% 3 SF District 3 22 17 -22.7% 17 15 -11.8% $1,350,000 $1,350,000 0.0% 21 43 +104.8% 1.4 1.4 0.0% 4 SF District 4 36 37 +2.8% 32 23 -28.1% $2,152,500 $1,825,000 -15.2% 16 21 +31.3% 1.1 1.5 +36.4% 5 SF District 5 45 51 +13.3% 38 30 -21.1% $2,725,000 $2,385,000 -12.5% 20 29 +45.0% 1.3 2.2 +69.2% 6 SF District 6 6 4 -33.3% 8 2 -75.0% $3,725,000 $2,775,000 -25.5% 40 12 -70.0% 1.2 1.8 +50.0% 7 SF District 7 29 53 +82.8% 9 13 +44.4% $5,600,000 $5,650,000 +0.9% 80 49 -38.8% 2.6 7.7 +196.2% 8 SF District 8 20 13 -35.0% 3 0 -100.0% $4,100,000 $0 -100.0% 34 0 -100.0% 5.7 5.6 -1.8% 9 SF District 9 36 29 -19.4% 32 15 -53.1% $2,287,500 $1,465,000 -36.0% 22 29 +31.8% 1.4 1.7 +21.4% 10 SF District 10 77 58 -24.7% 58 43 -25.9% $1,326,000 $1,185,000 -10.6% 17 34 +100.0% 1.7 1.6 -5.9% Condo/TIC/Coop 1 SF District 1 31 25 -19.4% 15 15 0.0% $1,455,000 $1,340,000 -7.9% 13 25 +92.3% 1.9 2.1 +10.5% 2 SF District 2 10 11 +10.0% 4 2 -50.0% $1,450,000 $1,415,000 -2.4% 62 18 -71.0% 2.2 2.8 +27.3% 3 SF District 3 8 1 -87.5% 2 3 +50.0% $776,500 $802,000 +3.3% 37 50 +35.1% 2.2 0.4 -81.8% 4 SF District 4 16 10 -37.5% 7 6 -14.3% $850,000 $617,500 -27.4% 24 90 +275.0% 2.9 3.6 +24.1% 5 SF District 5 107 79 -26.2% 66 47 -28.8% $1,528,000 $1,400,000 -8.4% 21 43 +104.8% 2.0 2.2 +10.0% 6 SF District 6 80 55 -31.3% 37 22 -40.5% $1,225,000 $1,195,000 -2.4% 37 46 +24.3% 2.1 2.4 +14.3% 7 SF District 7 78 65 -16.7% 47 28 -40.4% $1,995,000 $1,475,000 -26.1% 29 45 +55.2% 2.1 3.1 +47.6% 8 SF District 8 243 180 -25.9% 66 38 -42.4% $1,160,000 $741,500 -36.1% 45 50 +11.1% 4.1 5.1 +24.4% 9 SF District 9 508 305 -40.0% 116 60 -48.3% $1,034,000 $842,500 -18.5% 47 70 +48.9% 4.5 4.9 +8.9% 10 SF District 10 40 22 -45.0% 8 5 -37.5% $827,500 $789,000 -4.7% 49 50 +2.0% 5.6 4.5 -19.6% Key metrics by report month for the districts of San Francisco. Current as of June 11, 2023. All data from the San Francisco Association of REALTORS® MLS. Report © 2023 ShowingTime. | 16 Active Listings Sold Listings Median Sales Price Days on Market Months Supply