SlideShare a Scribd company logo
1 of 16
Download to read offline
July 2023 Monthly Snapshot
One-Year Change in One-Year Change in
Median Sales Price Single
Family
Median Sales Price
Condo/TIC/Coop
2
3
4
5
6
7
8
9
10
11
12
13
14
15
16
Monthly Indicators
- 13.0% - 3.1% - 7.9%
One-Year Change in
Affordability constraints have continued to limit homebuying activity this
summer, with existing-home sales falling 3.3% month-over-month nationwide
as of last measure, according to the National Association of REALTORS®
(NAR). Mortgage rates have approached 7% in recent months, leading many
prospective buyers to put their home purchase plans temporarily on hold. But
higher rates have also kept many existing homeowners from listing their homes
for fear of giving up the low-rate mortgages they locked in a few years ago,
when rates were significantly lower.
New Listings were down 23.2 percent for single family homes and 37.7 percent
for Condo/TIC/Coop properties. Pending Sales decreased 19.9 percent for
single family homes and 18.5 percent for Condo/TIC/Coop properties.
The Median Sales Price was down 13.0 percent to $1,450,000 for single family
homes and 3.1 percent to $1,159,500 for Condo/TIC/Coop properties. Months
Supply of Inventory increased 6.3 percent for single family units and 15.6
percent for Condo/TIC/Coop units.
Despite a drop in existing-home sales, home prices have remained near record
highs, with a national median sales price of $410,200 as of last measure, 0.9%
below the all-time high of $413,800 recorded in June 2022, according to NAR.
With only 3.1 months’ supply heading into July, the lack of inventory has
boosted competition among buyers and put upward pressure on sales prices,
especially in more affordable markets, where competition for homes remains
particularly strong.
Median Sales Price
All Property Types
Residential real estate activity in San Francisco County (Districts 1-10)
composed of single-family properties, townhomes and condominiums. Percent
changes are calculated using rounded figures.
Single Family Activity Overview
Months Supply of Inventory
For questions or more information, contact
communications@sfrealtors.com.
Current as of August 8, 2023. All data from the San Francisco Association of REALTORS® MLS. Report © 2023 ShowingTime.
Condo/TIC/Coop Activity Overview
Inventory of Active Listings
% of Properties Sold Over List Price
% of List Price Received
Housing Affordability Ratio
All Properties Activity Overview
New Listings
Pending Sales
Sold Listings
Median Sales Price
Average Sales Price
Days on Market Until Sale
Activity by District
Single Family Activity Overview
Key metrics by report month and for year-to-date (YTD) starting from the first of the year.
Key Metrics Historical Sparkbars 7-2022 7-2023 Percent Change YTD 2022 YTD 2023 Percent Change
Current as of August 8, 2023. All data from the San Francisco Association of REALTORS® MLS. Report © 2023 ShowingTime. | 2
Months Supply 1.6 1.7 + 6.3% -- -- --
Affordability Ratio 27 27 0.0%
% of List Price Received 111.0% 108.2% - 2.5% 119.1%
24
61.9% - 27.2%
- 10.0%
26 + 8.3%
107.2%
% of Properties Sold Over List Price 78.6% 66.9% - 14.9% 85.0%
Active Listings 367 277 - 24.5% --
Avg. Sales Price $2,060,515 $1,842,327 - 10.6% $2,360,524
Days on Market 21 26 + 23.8% 20 31 + 55.0%
$2,045,100
-- --
Median Sales Price $1,667,500 $1,450,000 - 13.0% $1,900,000
Sold Listings 182 157 - 13.7% 1,516
New Listings 241 185 - 23.2% 2,048
Pending Sales 181 145 - 19.9% - 27.7%
1,543 1,116
- 26.9%
1,498
1,076 - 29.0%
$1,550,000 - 18.4%
- 13.4%
7-2020 7-2021 7-2022 7-2023
7-2020 7-2021 7-2022 7-2023
7-2020 7-2021 7-2022 7-2023
7-2020 7-2021 7-2022 7-2023
7-2020 7-2021 7-2022 7-2023
7-2020 7-2021 7-2022 7-2023
7-2020 7-2021 7-2022 7-2023
7-2020 7-2021 7-2022 7-2023
7-2020 7-2021 7-2022 7-2023
7-2020 7-2021 7-2022 7-2023
7-2020 7-2021 7-2022 7-2023
Condo/TIC/Coop Activity Overview
Key metrics by report month and for year-to-date (YTD) starting from the first of the year.
Key Metrics Historical Sparkbars 7-2022 7-2023 Percent Change YTD 2022 YTD 2023 Percent Change
Current as of August 8, 2023. All data from the San Francisco Association of REALTORS® MLS. Report © 2023 ShowingTime. | 3
Months Supply 3.2 3.7 + 15.6% -- -- --
Affordability Ratio 43 39 - 9.3%
% of List Price Received 101.5% 99.8% - 1.7% 105.3%
42
33.9% - 37.9%
- 5.1%
41 - 2.4%
99.9%
% of Properties Sold Over List Price 39.6% 31.6% - 20.2% 54.6%
Active Listings 1,020 706 - 30.8% --
Avg. Sales Price $1,466,757 $1,237,833 - 15.6% $1,410,635
Days on Market 49 52 + 6.1% 40
$1,100,088 - 11.3%
- 10.6%
57 + 42.5%
$1,261,552
-- --
Sold Listings 235 158 - 32.8% 2,124 1,305 - 38.6%
Median Sales Price $1,197,000 $1,159,500 - 3.1% $1,240,000
- 36.7%
Pending Sales 222 181 - 18.5% 2,133 1,371 - 35.7%
New Listings 382 238 - 37.7% 3,514 2,225
7-2020 7-2021 7-2022 7-2023
7-2020 7-2021 7-2022 7-2023
7-2020 7-2021 7-2022 7-2023
7-2020 7-2021 7-2022 7-2023
7-2020 7-2021 7-2022 7-2023
7-2020 7-2021 7-2022 7-2023
7-2020 7-2021 7-2022 7-2023
7-2020 7-2021 7-2022 7-2023
7-2020 7-2021 7-2022 7-2023
7-2020 7-2021 7-2022 7-2023
7-2020 7-2021 7-2022 7-2023
New Listings
New Listings
Single
Family
Year-Over-Year
Change
Condo/TIC/
Coop
Year-Over-Year
Change
Aug-2022 239 -13.7% 309 -20.4%
Sep-2022 367 -13.2% 574 -20.5%
Oct-2022 243 -27.0% 378 -28.5%
Nov-2022 153 -10.5% 153 -42.3%
Dec-2022 72 -13.3% 78 -46.9%
Jan-2023 168 -26.3% 342 -27.5%
Feb-2023 175 -39.2% 314 -41.3%
Mar-2023 242 -29.2% 362 -41.2%
Apr-2023 237 -28.0% 326 -39.9%
May-2023 277 -8.0% 325 -37.0%
Jun-2023 214 -32.9% 318 -29.5%
Jul-2023 185 -23.2% 238 -37.7%
12-Month Avg 214 -22.9% 310 -33.2%
Historical New Listings by Month
Current as of August 8, 2023. All data from the San Francisco Association of REALTORS® MLS. Report © 2023 ShowingTime. | 4
A count of the properties that have been newly listed on the market in a given month.
306
458
241
382
185
238
Single Family Condo/TIC/Coop
July
0
200
400
600
800
1-2005 1-2006 1-2007 1-2008 1-2009 1-2010 1-2011 1-2012 1-2013 1-2014 1-2015 1-2016 1-2017 1-2018 1-2019 1-2020 1-2021 1-2022 1-2023
Single Family Condo/TIC/Coop
2,172
3,590
2,048
3,514
1,498
2,225
Single Family Condo/TIC/Coop
Year to Date
2021 2022 2023
- 37.7%
- 16.6%
- 23.2%
- 21.2% - 2.1%
- 26.9%
- 5.7% - 36.7%
2021 2022 2023 2021 2022 2023 2021 2022 2023
- 18.8% + 21.5% + 26.0%
- 30.7%
Pending Sales
Pending Sales
Single
Family
Year-Over-Year
Change
Condo/TIC/
Coop
Year-Over-Year
Change
Aug-2022 181 -19.9% 232 -26.6%
Sep-2022 189 -42.6% 213 -36.8%
Oct-2022 195 -28.6% 221 -45.4%
Nov-2022 166 -35.9% 160 -55.6%
Dec-2022 116 -10.1% 122 -46.0%
Jan-2023 87 -40.0% 122 -51.4%
Feb-2023 126 -41.4% 176 -38.7%
Mar-2023 169 -41.1% 244 -44.2%
Apr-2023 187 -30.5% 231 -32.8%
May-2023 209 -16.1% 216 -34.9%
Jun-2023 193 -2.0% 201 -22.7%
Jul-2023 145 -19.9% 181 -18.5%
12-Month Avg 164 -28.9% 193 -38.6%
Historical Pending Sales by Month
A count of the properties on which offers have been accepted in a given month.
Current as of August 8, 2023. All data from the San Francisco Association of REALTORS® MLS. Report © 2023 ShowingTime. | 5
259
364
181
222
145
181
Single Family Condo/TIC/Coop
July
0
100
200
300
400
500
600
1-2005 1-2006 1-2007 1-2008 1-2009 1-2010 1-2011 1-2012 1-2013 1-2014 1-2015 1-2016 1-2017 1-2018 1-2019 1-2020 1-2021 1-2022 1-2023
Single Family Condo/TIC/Coop
1,810
2,842
1,543
2,133
1,116
1,371
Single Family Condo/TIC/Coop
Year to Date
2021 2022 2023
- 18.5%
- 39.0%
- 19.9%
- 30.1% - 24.9%
- 27.7%
- 14.8% - 35.7%
2021 2022 2023 2021 2022 2023 2021 2022 2023
- 6.2% + 53.1% + 121.7%
+ 50.4%
Sold Listings
Sold Listings
Single
Family
Year-Over-Year
Change
Condo/TIC/
Coop
Year-Over-Year
Change
Aug-2022 190 -25.8% 237 -31.9%
Sep-2022 180 -26.5% 210 -28.1%
Oct-2022 192 -38.1% 224 -38.5%
Nov-2022 186 -36.5% 207 -51.3%
Dec-2022 154 -28.7% 147 -54.8%
Jan-2023 100 -23.1% 104 -44.1%
Feb-2023 101 -36.5% 142 -43.2%
Mar-2023 151 -41.2% 248 -37.1%
Apr-2023 175 -31.9% 217 -43.2%
May-2023 188 -33.3% 230 -37.5%
Jun-2023 204 -18.1% 206 -33.3%
Jul-2023 157 -13.7% 158 -32.8%
12-Month Avg 165 -30.3% 194 -39.9%
Historical Sold Listings by Month
A count of the actual sales that closed in a given month.
Current as of August 8, 2023. All data from the San Francisco Association of REALTORS® MLS. Report © 2023 ShowingTime. | 6
255
369
182
235
157 158
Single Family Condo/TIC/Coop
July
0
100
200
300
400
500
1-2005 1-2006 1-2007 1-2008 1-2009 1-2010 1-2011 1-2012 1-2013 1-2014 1-2015 1-2016 1-2017 1-2018 1-2019 1-2020 1-2021 1-2022 1-2023
Single Family Condo/TIC/Coop
1,731
2,753
1,516
2,124
1,076
1,305
Single Family Condo/TIC/Coop
Year to Date
2021 2022 2023
- 32.8%
- 36.3%
- 13.7%
- 28.6% - 22.8%
- 29.0%
- 12.4% - 38.6%
2021 2022 2023 2021 2022 2023 2021 2022 2023
+ 7.1% + 61.5% + 122.2%
+ 38.7%
Median Sales Price
Median Sales Price
Single
Family
Year-Over-Year
Change
Condo/TIC/
Coop
Year-Over-Year
Change
Aug-2022 $1,605,000 -13.1% $1,000,000 -13.0%
Sep-2022 $1,650,000 -5.7% $1,160,000 -3.3%
Oct-2022 $1,670,000 -7.5% $1,200,000 -3.8%
Nov-2022 $1,500,000 -20.2% $1,125,000 -10.7%
Dec-2022 $1,537,500 -9.0% $950,000 -26.9%
Jan-2023 $1,367,500 -16.1% $992,900 -7.2%
Feb-2023 $1,440,000 -25.4% $1,162,500 -5.3%
Mar-2023 $1,697,500 -15.1% $1,060,000 -12.2%
Apr-2023 $1,570,000 -23.4% $1,175,000 -14.2%
May-2023 $1,650,000 -17.8% $1,082,544 -10.9%
Jun-2023 $1,590,000 -15.4% $1,127,500 -9.1%
Jul-2023 $1,450,000 -13.0% $1,159,500 -3.1%
12-Month Avg* $1,570,000 -15.1% $1,100,000 -10.9%
Historical Median Sales Price by Month
Point at which half of the sales sold for more and half sold for less, not accounting for seller concessions, in a given month.
* Median Sales Price for all properties from August 2022 through July 2023. This is not the
average of the individual figures above.
Current as of August 8, 2023. All data from the San Francisco Association of REALTORS® MLS. Report © 2023 ShowingTime. | 7
$1,850,000
$1,210,000
$1,667,500
$1,197,000
$1,450,000
$1,159,500
Single Family Condo/TIC/Coop
July
$500,000
$750,000
$1,000,000
$1,250,000
$1,500,000
$1,750,000
$2,000,000
$2,250,000
1-2005 1-2006 1-2007 1-2008 1-2009 1-2010 1-2011 1-2012 1-2013 1-2014 1-2015 1-2016 1-2017 1-2018 1-2019 1-2020 1-2021 1-2022 1-2023
Single Family Condo/TIC/Coop
$1,800,000
$1,200,000
$1,900,000
$1,240,000
$1,550,000
$1,100,088
Single Family Condo/TIC/Coop
Year to Date
2021 2022 2023
- 3.1%
- 1.1%
- 13.0%
- 9.9% + 3.3%
- 18.4%
+ 5.6% - 11.3%
2021 2022 2023 2021 2022 2023 2021 2022 2023
+ 15.3% + 11.9% - 1.6%
- 4.0%
Average Sales Price
Average Sales
Price
Single
Family
Year-Over-Year
Change
Condo/TIC/
Coop
Year-Over-Year
Change
Aug-2022 $1,946,588 -8.5% $1,174,880 -17.6%
Sep-2022 $1,881,502 -13.1% $1,343,336 +0.8%
Oct-2022 $2,211,462 -6.3% $1,418,171 -3.0%
Nov-2022 $1,895,086 -19.4% $1,394,166 -9.4%
Dec-2022 $1,870,417 -20.9% $1,098,424 -26.2%
Jan-2023 $1,811,636 -8.1% $1,261,866 -3.8%
Feb-2023 $1,823,104 -24.6% $1,296,409 -7.3%
Mar-2023 $2,280,520 -10.0% $1,207,124 -14.5%
Apr-2023 $2,224,904 -11.3% $1,370,225 -7.1%
May-2023 $2,145,625 -11.0% $1,175,652 -16.2%
Jun-2023 $2,005,523 -14.9% $1,302,515 -4.7%
Jul-2023 $1,842,327 -10.6% $1,237,833 -15.6%
12-Month Avg* $2,009,173 -13.5% $1,276,654 -10.8%
Historical Average Sales Price by Month
Average sales price for all closed sales, not accounting for seller concessions, in a given month.
* Avg. Sales Price for all properties from August 2022 through July 2023. This is not the average
of the individual figures above.
Current as of August 8, 2023. All data from the San Francisco Association of REALTORS® MLS. Report © 2023 ShowingTime. | 8
$2,292,230
$1,357,053
$2,060,515
$1,466,757
$1,842,327
$1,237,833
Single Family Condo/TIC/Coop
July
$500,000
$1,000,000
$1,500,000
$2,000,000
$2,500,000
$3,000,000
1-2005 1-2006 1-2007 1-2008 1-2009 1-2010 1-2011 1-2012 1-2013 1-2014 1-2015 1-2016 1-2017 1-2018 1-2019 1-2020 1-2021 1-2022 1-2023
Single Family Condo/TIC/Coop
$2,335,262
$1,350,662
$2,360,524
$1,410,635
$2,045,100
$1,261,552
Single Family Condo/TIC/Coop
Year to Date
2021 2022 2023
- 15.6%
+ 8.1%
- 10.6%
- 10.1% + 4.4%
- 13.4%
+ 1.1% - 10.6%
2021 2022 2023 2021 2022 2023 2021 2022 2023
+ 13.8% + 13.9% - 0.2%
- 2.9%
Days on Market Until Sale
Days on Market
Until Sale
Single
Family
Year-Over-Year
Change
Condo/TIC/
Coop
Year-Over-Year
Change
Aug-2022 26 +4.0% 50 +16.3%
Sep-2022 28 +21.7% 58 +45.0%
Oct-2022 28 +40.0% 43 +19.4%
Nov-2022 35 +66.7% 51 +24.4%
Dec-2022 38 +22.6% 74 +57.4%
Jan-2023 50 +22.0% 87 +27.9%
Feb-2023 33 +50.0% 59 +63.9%
Mar-2023 32 +100.0% 58 +70.6%
Apr-2023 31 +93.8% 56 +75.0%
May-2023 28 +33.3% 52 +40.5%
Jun-2023 26 +52.9% 50 +28.2%
Jul-2023 26 +23.8% 52 +6.1%
12-Month Avg* 31 +41.1% 56 +37.4%
Historical Days on Market Until Sale by Month
Average number of days between when a property is listed and when an offer is accepted in a given month.
* Days on Market for all properties from August 2022 through July 2023. This is not the average
of the individual figures above.
Current as of August 8, 2023. All data from the San Francisco Association of REALTORS® MLS. Report © 2023 ShowingTime. | 9
19
42
21
49
26
52
Single Family Condo/TIC/Coop
July
0
20
40
60
80
100
120
1-2005 1-2006 1-2007 1-2008 1-2009 1-2010 1-2011 1-2012 1-2013 1-2014 1-2015 1-2016 1-2017 1-2018 1-2019 1-2020 1-2021 1-2022 1-2023
Single Family Condo/TIC/Coop
24
48
20
40
31
57
Single Family Condo/TIC/Coop
Year to Date
2021 2022 2023
+ 6.1%
+ 16.7%
+ 23.8%
+ 10.5% - 16.7%
+ 55.0%
- 16.7% + 42.5%
2021 2022 2023 2021 2022 2023 2021 2022 2023
- 29.6% - 14.3% + 20.0%
+ 2.4%
Inventory of Active Listings
Inventory of Active
Listings
Single
Family
Year-Over-Year
Change
Condo/TIC/
Coop
Year-Over-Year
Change
Aug-2022 351 -18.4% 894 -12.4%
Sep-2022 483 +1.9% 1,103 -15.0%
Oct-2022 473 -3.3% 1,095 -15.8%
Nov-2022 375 +3.0% 869 -20.2%
Dec-2022 216 +5.4% 520 -23.1%
Jan-2023 260 -0.4% 648 -21.8%
Feb-2023 286 -4.3% 720 -27.3%
Mar-2023 321 +1.9% 768 -26.7%
Apr-2023 342 +1.8% 784 -29.4%
May-2023 353 +6.6% 797 -28.8%
Jun-2023 310 -17.6% 776 -29.6%
Jul-2023 277 -24.5% 706 -30.8%
12-Month Avg* 337 -4.7% 807 -23.2%
Historical Inventory of Active Listings by Month
The number of properties available for sale in active status at the end of a given month.
* Active Listings for all properties from August 2022 through July 2023. This is not the average of
the individual figures above.
Current as of August 8, 2023. All data from the San Francisco Association of REALTORS® MLS. Report © 2023 ShowingTime. | 10
425
1,059
367
1,020
277
706
Single Family Condo/TIC/Coop
July
0
500
1,000
1,500
2,000
2,500
1-2005 1-2006 1-2007 1-2008 1-2009 1-2010 1-2011 1-2012 1-2013 1-2014 1-2015 1-2016 1-2017 1-2018 1-2019 1-2020 1-2021 1-2022 1-2023
Single Family Condo/TIC/Coop
2021 2022 2023
- 30.8%
- 3.7%
- 24.5%
- 13.6%
2021 2022 2023
- 28.1% - 29.6%
% of Properties Sold Over List Price
% of Properties
Sold Over List Price
Single
Family
Year-Over-Year
Change
Condo/TIC/
Coop
Year-Over-Year
Change
Aug-2022 75.3% -10.8% 37.1% -32.1%
Sep-2022 67.2% -20.5% 31.0% -43.1%
Oct-2022 64.1% -24.1% 37.5% -38.2%
Nov-2022 57.5% -27.7% 30.4% -45.5%
Dec-2022 48.7% -38.1% 15.6% -66.5%
Jan-2023 44.0% -41.6% 19.2% -50.4%
Feb-2023 51.5% -40.7% 28.2% -51.7%
Mar-2023 62.7% -27.4% 36.3% -37.5%
Apr-2023 61.7% -30.4% 32.7% -47.9%
May-2023 63.3% -27.2% 40.9% -26.0%
Jun-2023 70.1% -18.8% 37.9% -33.9%
Jul-2023 66.9% -14.9% 31.6% -20.2%
12-Month Avg 62.4% -25.5% 32.9% -39.8%
Historical % of Properties Sold Over List Price by Month
Percentage found when dividing the number of properties sold by properties sold over its original list price, not accounting for seller
concessions.
* % of Properties Sold Over List Price for all properties from August 2022 through July 2023. This
is not the average of the individual figures above.
Current as of August 8, 2023. All data from the San Francisco Association of REALTORS® MLS. Report © 2023 ShowingTime. | 11
83.5%
55.6%
78.6%
39.6%
66.9%
31.6%
Single Family Condo/TIC/Coop
July
0.0%
20.0%
40.0%
60.0%
80.0%
100.0%
1-2005 1-2006 1-2007 1-2008 1-2009 1-2010 1-2011 1-2012 1-2013 1-2014 1-2015 1-2016 1-2017 1-2018 1-2019 1-2020 1-2021 1-2022 1-2023
Single Family Condo/TIC/Coop
76.1%
45.8%
85.0%
54.6%
61.9%
33.9%
Single Family Condo/TIC/Coop
Year to Date
2021 2022 2023
- 20.2%
- 28.8%
- 14.9%
- 5.9% + 19.2%
- 27.2%
+ 11.7% - 37.9%
2021 2022 2023 2021 2022 2023 2021 2022 2023
+ 29.1% + 14.3% - 4.6%
+ 25.2%
% of List Price Received
% of List Price
Received
Single
Family
Year-Over-Year
Change
Condo/TIC/
Coop
Year-Over-Year
Change
Aug-2022 108.3% -6.7% 100.7% -3.5%
Sep-2022 108.5% -6.7% 100.6% -4.2%
Oct-2022 107.1% -8.5% 100.4% -4.8%
Nov-2022 104.9% -8.6% 99.2% -5.2%
Dec-2022 102.9% -10.0% 98.1% -5.2%
Jan-2023 103.2% -12.1% 98.0% -3.1%
Feb-2023 103.7% -14.4% 99.0% -6.7%
Mar-2023 108.0% -11.4% 100.4% -5.6%
Apr-2023 107.0% -13.1% 99.9% -6.8%
May-2023 108.2% -9.5% 100.1% -5.5%
Jun-2023 108.7% -6.9% 100.6% -4.5%
Jul-2023 108.2% -2.5% 99.8% -1.7%
12-Month Avg* 106.9% -9.1% 99.9% -4.8%
Historical % of List Price Received by Month
Percentage found when dividing a property’s sales price by its most recent list price, then taking the average for all properties sold in a given
month, not accounting for seller concessions.
* % of List Price Received for all properties from August 2022 through July 2023. This is not the
average of the individual figures above.
Current as of August 8, 2023. All data from the San Francisco Association of REALTORS® MLS. Report © 2023 ShowingTime. | 12
118.5%
104.8%
111.0%
101.5%
108.2%
99.8%
Single Family Condo/TIC/Coop
July
114.0%
103.4%
119.1%
105.3%
107.2%
99.9%
Single Family Condo/TIC/Coop
Year to Date
90.0%
100.0%
110.0%
120.0%
130.0%
1-2005 1-2006 1-2007 1-2008 1-2009 1-2010 1-2011 1-2012 1-2013 1-2014 1-2015 1-2016 1-2017 1-2018 1-2019 1-2020 1-2021 1-2022 1-2023
Single Family Condo/TIC/Coop
2021 2022 2023
- 1.7%
- 3.1%
- 2.5%
- 6.3%
2021 2022 2023
+ 11.8% + 3.8%
2021 2022 2023
- 5.1%
+ 1.8%
- 10.0%
+ 4.5%
2021 2022 2023
+ 5.2% + 1.1%
Housing Affordability Ratio
Housing
Affordability Ratio
Single
Family
Year-Over-Year
Change
Condo/TIC/
Coop
Year-Over-Year
Change
Aug-2022 28 -6.7% 51 -10.5%
Sep-2022 24 -25.0% 39 -29.1%
Oct-2022 23 -25.8% 37 -30.2%
Nov-2022 27 -10.0% 40 -25.9%
Dec-2022 27 -15.6% 49 0.0%
Jan-2023 31 -3.1% 48 -15.8%
Feb-2023 28 +3.7% 40 -18.4%
Mar-2023 24 0.0% 44 -2.2%
Apr-2023 26 +23.8% 40 +8.1%
May-2023 25 +13.6% 42 0.0%
Jun-2023 25 +8.7% 40 0.0%
Jul-2023 27 0.0% 39 -9.3%
12-Month Avg* 26 -2.2% 42 -19.3%
Historical Housing Affordability Ratio by Month
This index measures housing affordability for the region. For example, an index of 120 means the median household income is 120% of what is
necessary to qualify for the median-priced home under prevailing interest rates. A higher number means greater affordability.
* Affordability Ratio for all properties from August 2022 through July 2023. This is not the average
of the individual figures above.
Current as of August 8, 2023. All data from the San Francisco Association of REALTORS® MLS. Report © 2023 ShowingTime. | 13
30
54
27
43
27
39
Single Family Condo/TIC/Coop
July
20
40
60
80
100
1-2005 1-2006 1-2007 1-2008 1-2009 1-2010 1-2011 1-2012 1-2013 1-2014 1-2015 1-2016 1-2017 1-2018 1-2019 1-2020 1-2021 1-2022 1-2023
Single Family Condo/TIC/Coop
2021 2022 2023
- 9.3%
- 20.4%
0.0%
- 10.0%
2021 2022 2023
- 14.3% + 1.9%
31
55
24
42
26
41
Single Family Condo/TIC/Coop
Year to Date
2021 2022 2023
- 2.4%
- 23.6%
+ 8.3%
- 22.6%
2021 2022 2023
- 11.4% 0.0%
Months Supply of Inventory
Months Supply of
Inventory
Single
Family
Year-Over-Year
Change
Condo/TIC/
Coop
Year-Over-Year
Change
Aug-2022 1.6 0.0% 2.9 +3.6%
Sep-2022 2.3 +27.8% 3.7 +5.7%
Oct-2022 2.3 +21.1% 3.9 +11.4%
Nov-2022 1.9 +35.7% 3.3 +13.8%
Dec-2022 1.1 +37.5% 2.0 +11.1%
Jan-2023 1.3 +30.0% 2.6 +18.2%
Feb-2023 1.5 +25.0% 3.0 +11.1%
Mar-2023 1.8 +38.5% 3.5 +20.7%
Apr-2023 2.0 +42.9% 3.7 +15.6%
May-2023 2.1 +50.0% 4.0 +21.2%
Jun-2023 1.9 +18.8% 3.9 +14.7%
Jul-2023 1.7 +6.3% 3.7 +15.6%
12-Month Avg* 1.8 +26.3% 3.4 +13.5%
Historical Months Supply of Inventory by Month
The inventory of homes for sale at the end of a given month, divided by the average monthly pending sales from the last 12 months.
* Months Supply for all properties from August 2022 through July 2023. This is not the average of
the individual figures above.
Current as of August 8, 2023. All data from the San Francisco Association of REALTORS® MLS. Report © 2023 ShowingTime. | 14
1.6
2.9
1.6
3.2
1.7
3.7
Single Family Condo/TIC/Coop
July
0.0
2.0
4.0
6.0
8.0
10.0
12.0
1-2005 1-2006 1-2007 1-2008 1-2009 1-2010 1-2011 1-2012 1-2013 1-2014 1-2015 1-2016 1-2017 1-2018 1-2019 1-2020 1-2021 1-2022 1-2023
Single Family Condo/TIC/Coop
2021 2022 2023
+ 15.6%
+ 10.3%
+ 6.3%
0.0%
2021 2022 2023
- 50.0% - 60.8%
All Properties Activity Overview
Key metrics by report month and for year-to-date (YTD) starting from the first of the year.
Key Metrics Historical Sparkbars 7-2022 7-2023 Percent Change YTD 2022 YTD 2023 Percent Change
Current as of August 8, 2023. All data from the San Francisco Association of REALTORS® MLS. Report © 2023 ShowingTime. | 15
Months Supply 2.6 2.8 + 7.7% -- -- --
Affordability Ratio 30 29 - 3.3%
% of List Price Received 105.6% 103.9% - 1.6% 110.9%
29
46.3% - 31.1%
- 7.0%
28 - 3.4%
103.1%
% of Properties Sold Over List Price 56.7% 48.9% - 13.8% 67.2%
Active Listings 1,424 1,002 - 29.6% --
Avg. Sales Price $1,722,932 $1,532,532 - 11.1% $1,801,955
Days on Market 37 40 + 8.1% 32
$1,315,000 - 12.3%
- 10.6%
46 + 43.8%
$1,611,107
-- --
Sold Listings 420 319 - 24.0% 3,676 2,411 - 34.4%
Median Sales Price $1,422,500 $1,310,000 - 7.9% $1,500,000
- 33.0%
Pending Sales 409 333 - 18.6% 3,713 2,522 - 32.1%
New Listings 632 430 - 32.0% 5,628 3,773
7-2020 7-2021 7-2022 7-2023
7-2020 7-2021 7-2022 7-2023
7-2020 7-2021 7-2022 7-2023
7-2020 7-2021 7-2022 7-2023
7-2020 7-2021 7-2022 7-2023
7-2020 7-2021 7-2022 7-2023
7-2020 7-2021 7-2022 7-2023
7-2020 7-2021 7-2022 7-2023
7-2020 7-2021 7-2022 7-2023
7-2020 7-2021 7-2022 7-2023
7-2020 7-2021 7-2022 7-2023
Activity by District
SF District 1: Northwest (Sea Cliff, Lake, Jordan Park / Laurel Heights, Outer Richmond, Central Richmond, Inner Richmond, Lone Mountain)
SF District 2: Central West (Outer Sunset, Central Sunset, Inner Sunset, Outer Parkside, Parkside, Inner Parkside, Golden Gate Heights)
SF District 3: Southwest (Pine Lake Park, Lake Shore, Merced Manor, Stonestown, Lakeside, Merced Heights, Ingleside, Ingleside Heights, Oceanview)
SF District 4: Twin Peaks W (Forest Hill (& Ext), W Portal, St Francis Wd, Balboa Terr, Mt Dav Manor, Ingleside Terr, Monterey Hts, Wstwd Pk & H'lnds, Shrwd Fst, Miraloma Pk, Dmnd Hts, Mdtwn Terr)
SF District 5: Central (Haight Ashbury, Cole Vly / Prnssus Hts, Clarndn Hts, Corona Hts, Twin Pks, Glen Pk, Noe Vly, Eureka Vly / Dolores Hts, Mission Dolores, Duboce Trngl, Buena Vista / Ashbury Hts)
SF District 6: Central North (Lower Pacific Heights, Anza Vista, Western Addition, North Panhandle, Alamo Square, Hayes Valley)
SF District 7: North (Marina, Cow Hollow, Presidio Heights, Pacific Heights)
SF District 8: Northeast (North Waterfront, North Beach, Russian Hill, Telegraph Hill, Nob Hill, Financial District / Barbary Coast, Downtown, Van Ness / Civic Center, Tenderloin)
SF District 9: Central East (Yerba Buena, South Beach, South of Market, Mission Bay, Inner Mission, Potrero Hill, Central Waterfront / Dogpatch, Bernal Heights)
SF District 10: Southeast (Outer Mission, Mission Terr, Excelsior, Portola, Bayview, Silver Terr, Hunters Pt, Candlestick Pt, Bayview Hts, Little Hollywood, Visitation Vly, Crocker Amazon)
7-2022 7-2023 + / – 7-2022 7-2023 + / – 7-2022 7-2023 + / – 7-2022 7-2023 + / – 7-2022 7-2023 + / –
Single Family
1 SF District 1 26 25 -3.8% 13 12 -7.7% $2,410,000 $1,997,500 -17.1% 17 22 +29.4% 1.2 1.8 +50.0%
2 SF District 2 46 39 -15.2% 41 35 -14.6% $1,550,000 $1,480,000 -4.5% 18 24 +33.3% 1.0 1.2 +20.0%
3 SF District 3 26 20 -23.1% 15 12 -20.0% $1,460,000 $1,265,000 -13.4% 17 25 +47.1% 1.6 1.8 +12.5%
4 SF District 4 51 20 -60.8% 26 22 -15.4% $1,940,000 $1,925,000 -0.8% 18 30 +66.7% 1.6 0.9 -43.8%
5 SF District 5 41 38 -7.3% 27 19 -29.6% $2,645,000 $2,750,000 +4.0% 19 28 +47.4% 1.2 1.8 +50.0%
6 SF District 6 4 5 +25.0% 1 0 -100.0% $2,250,000 $0 -100.0% 13 0 -100.0% 0.9 2.5 +177.8%
7 SF District 7 18 30 +66.7% 5 4 -20.0% $7,030,000 $5,250,000 -25.3% 20 87 +335.0% 1.8 4.1 +127.8%
8 SF District 8 12 10 -16.7% 3 2 -33.3% $2,000,000 $3,439,500 +72.0% 26 63 +142.3% 3.6 5.0 +38.9%
9 SF District 9 45 28 -37.8% 14 14 0.0% $1,617,500 $1,475,000 -8.8% 27 14 -48.1% 1.9 1.7 -10.5%
10 SF District 10 98 62 -36.7% 37 37 0.0% $1,200,000 $1,155,000 -3.8% 28 22 -21.4% 2.3 1.8 -21.7%
Condo/TIC/Coop
1 SF District 1 31 29 -6.5% 13 10 -23.1% $1,510,000 $1,447,500 -4.1% 22 56 +154.5% 2.0 2.5 +25.0%
2 SF District 2 8 11 +37.5% 2 0 -100.0% $1,400,000 $0 -100.0% 29 0 -100.0% 2.1 2.9 +38.1%
3 SF District 3 8 2 -75.0% 2 2 0.0% $751,500 $610,750 -18.7% 23 27 +17.4% 2.1 0.9 -57.1%
4 SF District 4 13 13 0.0% 3 2 -33.3% $610,000 $702,000 +15.1% 49 57 +16.3% 2.4 4.9 +104.2%
5 SF District 5 92 65 -29.3% 40 28 -30.0% $1,322,500 $1,247,500 -5.7% 42 33 -21.4% 1.8 1.9 +5.6%
6 SF District 6 80 46 -42.5% 22 15 -31.8% $1,337,500 $950,000 -29.0% 46 49 +6.5% 2.3 2.2 -4.3%
7 SF District 7 74 43 -41.9% 26 18 -30.8% $1,500,000 $1,580,000 +5.3% 37 59 +59.5% 2.2 2.2 0.0%
8 SF District 8 199 156 -21.6% 43 36 -16.3% $1,050,000 $1,201,595 +14.4% 52 66 +26.9% 3.7 4.5 +21.6%
9 SF District 9 475 311 -34.5% 76 45 -40.8% $1,177,500 $910,000 -22.7% 63 52 -17.5% 4.5 5.3 +17.8%
10 SF District 10 40 30 -25.0% 8 2 -75.0% $734,250 $759,500 +3.4% 44 32 -27.3% 5.5 7.2 +30.9%
Key metrics by report month for the districts of San Francisco.
Current as of August 8, 2023. All data from the San Francisco Association of REALTORS® MLS. Report © 2023 ShowingTime. | 16
Active Listings Sold Listings Median Sales Price Days on Market Months Supply

More Related Content

Similar to SF Housing Snapshot Shows Declines in July 2023 Metrics

San Francisco December 2023 Market Report
San Francisco December 2023 Market ReportSan Francisco December 2023 Market Report
San Francisco December 2023 Market ReportRonny Budiutama
 
San Francisco Market Report August 2022.pdf
San Francisco Market Report August 2022.pdfSan Francisco Market Report August 2022.pdf
San Francisco Market Report August 2022.pdfRonny Budiutama
 
San Francisco Market Report July 2022.pdf
San Francisco Market Report July 2022.pdfSan Francisco Market Report July 2022.pdf
San Francisco Market Report July 2022.pdfRonny Budiutama
 
San Francisco Market Report March 2022
San Francisco Market Report March 2022San Francisco Market Report March 2022
San Francisco Market Report March 2022Ronny Budiutama
 
San Francisco Market Report February 2022
San Francisco Market Report February 2022San Francisco Market Report February 2022
San Francisco Market Report February 2022Ronny Budiutama
 
San Francisco Market Report October 2022.pdf
San Francisco Market Report October 2022.pdfSan Francisco Market Report October 2022.pdf
San Francisco Market Report October 2022.pdfRonny Budiutama
 
San Francisco Market Report August 2021
San Francisco Market Report August 2021San Francisco Market Report August 2021
San Francisco Market Report August 2021Ronny Budiutama
 
San Francisco Market Report September 2022.pdf
San Francisco Market Report September 2022.pdfSan Francisco Market Report September 2022.pdf
San Francisco Market Report September 2022.pdfRonny Budiutama
 
Greater Baton Rouge December 2023 Housing Market Update
Greater Baton Rouge December 2023 Housing Market UpdateGreater Baton Rouge December 2023 Housing Market Update
Greater Baton Rouge December 2023 Housing Market UpdateBill Cobb, Appraiser
 
San Francisco January 2024 Market Report
San Francisco January 2024 Market ReportSan Francisco January 2024 Market Report
San Francisco January 2024 Market ReportRonny Budiutama
 
San Francisco Market Report May 2022.
San Francisco Market Report May 2022.San Francisco Market Report May 2022.
San Francisco Market Report May 2022.Ronny Budiutama
 
San Francisco market report July 2020
San Francisco market report July 2020San Francisco market report July 2020
San Francisco market report July 2020Ronny Budiutama
 
San Francisco Market Report June 2022.pdf
San Francisco Market Report June 2022.pdfSan Francisco Market Report June 2022.pdf
San Francisco Market Report June 2022.pdfRonny Budiutama
 
San Francisco Market Report November 2022.pdf
San Francisco Market Report November 2022.pdfSan Francisco Market Report November 2022.pdf
San Francisco Market Report November 2022.pdfRonny Budiutama
 
San Francisco Market Focus Report December 2018
San Francisco Market Focus Report December 2018San Francisco Market Focus Report December 2018
San Francisco Market Focus Report December 2018Ronny Budiutama
 
San Francisco Market Report April 2022.pdf
San Francisco Market Report April 2022.pdfSan Francisco Market Report April 2022.pdf
San Francisco Market Report April 2022.pdfRonny Budiutama
 
San Francisco market focus report December 2019
San Francisco market focus report December 2019San Francisco market focus report December 2019
San Francisco market focus report December 2019Ronny Budiutama
 
San Francisco market report April 2020
San Francisco market report April 2020San Francisco market report April 2020
San Francisco market report April 2020Ronny Budiutama
 
San Francisco Market Focus Report August 2019
San Francisco Market Focus Report August 2019San Francisco Market Focus Report August 2019
San Francisco Market Focus Report August 2019Ronny Budiutama
 
San Francisco Market Report May 2021
San Francisco Market Report May 2021San Francisco Market Report May 2021
San Francisco Market Report May 2021Ronny Budiutama
 

Similar to SF Housing Snapshot Shows Declines in July 2023 Metrics (20)

San Francisco December 2023 Market Report
San Francisco December 2023 Market ReportSan Francisco December 2023 Market Report
San Francisco December 2023 Market Report
 
San Francisco Market Report August 2022.pdf
San Francisco Market Report August 2022.pdfSan Francisco Market Report August 2022.pdf
San Francisco Market Report August 2022.pdf
 
San Francisco Market Report July 2022.pdf
San Francisco Market Report July 2022.pdfSan Francisco Market Report July 2022.pdf
San Francisco Market Report July 2022.pdf
 
San Francisco Market Report March 2022
San Francisco Market Report March 2022San Francisco Market Report March 2022
San Francisco Market Report March 2022
 
San Francisco Market Report February 2022
San Francisco Market Report February 2022San Francisco Market Report February 2022
San Francisco Market Report February 2022
 
San Francisco Market Report October 2022.pdf
San Francisco Market Report October 2022.pdfSan Francisco Market Report October 2022.pdf
San Francisco Market Report October 2022.pdf
 
San Francisco Market Report August 2021
San Francisco Market Report August 2021San Francisco Market Report August 2021
San Francisco Market Report August 2021
 
San Francisco Market Report September 2022.pdf
San Francisco Market Report September 2022.pdfSan Francisco Market Report September 2022.pdf
San Francisco Market Report September 2022.pdf
 
Greater Baton Rouge December 2023 Housing Market Update
Greater Baton Rouge December 2023 Housing Market UpdateGreater Baton Rouge December 2023 Housing Market Update
Greater Baton Rouge December 2023 Housing Market Update
 
San Francisco January 2024 Market Report
San Francisco January 2024 Market ReportSan Francisco January 2024 Market Report
San Francisco January 2024 Market Report
 
San Francisco Market Report May 2022.
San Francisco Market Report May 2022.San Francisco Market Report May 2022.
San Francisco Market Report May 2022.
 
San Francisco market report July 2020
San Francisco market report July 2020San Francisco market report July 2020
San Francisco market report July 2020
 
San Francisco Market Report June 2022.pdf
San Francisco Market Report June 2022.pdfSan Francisco Market Report June 2022.pdf
San Francisco Market Report June 2022.pdf
 
San Francisco Market Report November 2022.pdf
San Francisco Market Report November 2022.pdfSan Francisco Market Report November 2022.pdf
San Francisco Market Report November 2022.pdf
 
San Francisco Market Focus Report December 2018
San Francisco Market Focus Report December 2018San Francisco Market Focus Report December 2018
San Francisco Market Focus Report December 2018
 
San Francisco Market Report April 2022.pdf
San Francisco Market Report April 2022.pdfSan Francisco Market Report April 2022.pdf
San Francisco Market Report April 2022.pdf
 
San Francisco market focus report December 2019
San Francisco market focus report December 2019San Francisco market focus report December 2019
San Francisco market focus report December 2019
 
San Francisco market report April 2020
San Francisco market report April 2020San Francisco market report April 2020
San Francisco market report April 2020
 
San Francisco Market Focus Report August 2019
San Francisco Market Focus Report August 2019San Francisco Market Focus Report August 2019
San Francisco Market Focus Report August 2019
 
San Francisco Market Report May 2021
San Francisco Market Report May 2021San Francisco Market Report May 2021
San Francisco Market Report May 2021
 

More from Ronny Budiutama

2023 Annual San Francisco Housing Market
2023 Annual San Francisco Housing Market2023 Annual San Francisco Housing Market
2023 Annual San Francisco Housing MarketRonny Budiutama
 
CA Weekly MLS Market Data Report - August 2023
CA Weekly MLS Market Data Report - August 2023CA Weekly MLS Market Data Report - August 2023
CA Weekly MLS Market Data Report - August 2023Ronny Budiutama
 
Annual Report on the San Francisco County Housing Market.pdf
Annual Report on the San Francisco County Housing Market.pdfAnnual Report on the San Francisco County Housing Market.pdf
Annual Report on the San Francisco County Housing Market.pdfRonny Budiutama
 
San Francisco Market Report January 2022
San Francisco Market Report January 2022San Francisco Market Report January 2022
San Francisco Market Report January 2022Ronny Budiutama
 
San Francisco Market Report December 2021
San Francisco Market Report December 2021San Francisco Market Report December 2021
San Francisco Market Report December 2021Ronny Budiutama
 
San Francisco Market Report November 2021
San Francisco Market Report November 2021San Francisco Market Report November 2021
San Francisco Market Report November 2021Ronny Budiutama
 
San Francisco Market Report October 2021
San Francisco Market Report October 2021San Francisco Market Report October 2021
San Francisco Market Report October 2021Ronny Budiutama
 
San Francisco Market Report September 2021
San Francisco Market Report September 2021San Francisco Market Report September 2021
San Francisco Market Report September 2021Ronny Budiutama
 
San Francisco Market Report For July 2021
San Francisco Market Report For July 2021San Francisco Market Report For July 2021
San Francisco Market Report For July 2021Ronny Budiutama
 

More from Ronny Budiutama (9)

2023 Annual San Francisco Housing Market
2023 Annual San Francisco Housing Market2023 Annual San Francisco Housing Market
2023 Annual San Francisco Housing Market
 
CA Weekly MLS Market Data Report - August 2023
CA Weekly MLS Market Data Report - August 2023CA Weekly MLS Market Data Report - August 2023
CA Weekly MLS Market Data Report - August 2023
 
Annual Report on the San Francisco County Housing Market.pdf
Annual Report on the San Francisco County Housing Market.pdfAnnual Report on the San Francisco County Housing Market.pdf
Annual Report on the San Francisco County Housing Market.pdf
 
San Francisco Market Report January 2022
San Francisco Market Report January 2022San Francisco Market Report January 2022
San Francisco Market Report January 2022
 
San Francisco Market Report December 2021
San Francisco Market Report December 2021San Francisco Market Report December 2021
San Francisco Market Report December 2021
 
San Francisco Market Report November 2021
San Francisco Market Report November 2021San Francisco Market Report November 2021
San Francisco Market Report November 2021
 
San Francisco Market Report October 2021
San Francisco Market Report October 2021San Francisco Market Report October 2021
San Francisco Market Report October 2021
 
San Francisco Market Report September 2021
San Francisco Market Report September 2021San Francisco Market Report September 2021
San Francisco Market Report September 2021
 
San Francisco Market Report For July 2021
San Francisco Market Report For July 2021San Francisco Market Report For July 2021
San Francisco Market Report For July 2021
 

Recently uploaded

Call Girls in Inderpuri Delhi 💯Call Us 🔝8264348440🔝
Call Girls in Inderpuri Delhi 💯Call Us 🔝8264348440🔝Call Girls in Inderpuri Delhi 💯Call Us 🔝8264348440🔝
Call Girls in Inderpuri Delhi 💯Call Us 🔝8264348440🔝soniya singh
 
Call Girls In Sahibabad Ghaziabad ❤️8860477959 Low Rate Escorts Service In 24...
Call Girls In Sahibabad Ghaziabad ❤️8860477959 Low Rate Escorts Service In 24...Call Girls In Sahibabad Ghaziabad ❤️8860477959 Low Rate Escorts Service In 24...
Call Girls In Sahibabad Ghaziabad ❤️8860477959 Low Rate Escorts Service In 24...lizamodels9
 
Listing Turkey Sylvana Istanbul - Bahcesehir
Listing Turkey Sylvana Istanbul - BahcesehirListing Turkey Sylvana Istanbul - Bahcesehir
Listing Turkey Sylvana Istanbul - BahcesehirListing Turkey
 
Low Rate Call Girls in Akshardham Delhi Call 9990771857
Low Rate Call Girls in Akshardham   Delhi Call 9990771857Low Rate Call Girls in Akshardham   Delhi Call 9990771857
Low Rate Call Girls in Akshardham Delhi Call 9990771857delhimodel235
 
9711199012 Call {Girls Delhi} Very Low rate Vaishali DownLoad PDF
9711199012 Call {Girls Delhi} Very Low rate Vaishali DownLoad PDF9711199012 Call {Girls Delhi} Very Low rate Vaishali DownLoad PDF
9711199012 Call {Girls Delhi} Very Low rate Vaishali DownLoad PDFMs Riya
 
Call Girls In Mundka Industrial Metro@꧂8447779280 ↬Enjoy ꧂Escort Service in ...
Call Girls In Mundka Industrial Metro@꧂8447779280 ↬Enjoy ꧂Escort Service in  ...Call Girls In Mundka Industrial Metro@꧂8447779280 ↬Enjoy ꧂Escort Service in  ...
Call Girls In Mundka Industrial Metro@꧂8447779280 ↬Enjoy ꧂Escort Service in ...asmaqueen5
 
Call Girls in Nehru Place Delhi 💯Call Us 🔝8264348440🔝
Call Girls in Nehru Place Delhi 💯Call Us 🔝8264348440🔝Call Girls in Nehru Place Delhi 💯Call Us 🔝8264348440🔝
Call Girls in Nehru Place Delhi 💯Call Us 🔝8264348440🔝soniya singh
 
9990771857 Call Girls in Noida Sector 34 Noida (Call Girls) Delhi
9990771857 Call Girls in Noida Sector 34 Noida (Call Girls) Delhi9990771857 Call Girls in Noida Sector 34 Noida (Call Girls) Delhi
9990771857 Call Girls in Noida Sector 34 Noida (Call Girls) Delhidelhimodel235
 
The Omaxe State Dwarka Delhi-broucher.pdf.pdf
The Omaxe State Dwarka Delhi-broucher.pdf.pdfThe Omaxe State Dwarka Delhi-broucher.pdf.pdf
The Omaxe State Dwarka Delhi-broucher.pdf.pdfkratirudram
 
Call Girls in Sarai Kale Khan Delhi 💯Call Us 🔝8264348440🔝
Call Girls in Sarai Kale Khan Delhi 💯Call Us 🔝8264348440🔝Call Girls in Sarai Kale Khan Delhi 💯Call Us 🔝8264348440🔝
Call Girls in Sarai Kale Khan Delhi 💯Call Us 🔝8264348440🔝soniya singh
 
Call Girls in Model Town Delhi 💯Call Us 🔝8264348440🔝
Call Girls in Model Town Delhi 💯Call Us 🔝8264348440🔝Call Girls in Model Town Delhi 💯Call Us 🔝8264348440🔝
Call Girls in Model Town Delhi 💯Call Us 🔝8264348440🔝soniya singh
 
SSPL The Strand Abodes Kharadi Pune Brochure.pdf
SSPL The Strand Abodes Kharadi Pune Brochure.pdfSSPL The Strand Abodes Kharadi Pune Brochure.pdf
SSPL The Strand Abodes Kharadi Pune Brochure.pdfabbu831446
 
Puravankara Mundhwa Pune E-Brochure.pdf
Puravankara Mundhwa Pune  E-Brochure.pdfPuravankara Mundhwa Pune  E-Brochure.pdf
Puravankara Mundhwa Pune E-Brochure.pdfManishSaxena95
 
Choose Noida's Leading Architect
Choose    Noida's    Leading   ArchitectChoose    Noida's    Leading   Architect
Choose Noida's Leading ArchitectMM Design Studio
 
8 Key Elements for Comfortable Farmland Living
8 Key Elements for Comfortable Farmland Living 8 Key Elements for Comfortable Farmland Living
8 Key Elements for Comfortable Farmland Living Farmland Bazaar
 
9990771857 Call Girls in Noida Sector 1 Noida (Call Girls) Delhi
9990771857 Call Girls in Noida Sector 1 Noida (Call Girls) Delhi9990771857 Call Girls in Noida Sector 1 Noida (Call Girls) Delhi
9990771857 Call Girls in Noida Sector 1 Noida (Call Girls) Delhidelhimodel235
 
Call Girls In The Lalit New Delhi ❤️8860477959 Good Looking Escorts In 24/7 D...
Call Girls In The Lalit New Delhi ❤️8860477959 Good Looking Escorts In 24/7 D...Call Girls In The Lalit New Delhi ❤️8860477959 Good Looking Escorts In 24/7 D...
Call Girls In The Lalit New Delhi ❤️8860477959 Good Looking Escorts In 24/7 D...lizamodels9
 

Recently uploaded (20)

Call Girls in Inderpuri Delhi 💯Call Us 🔝8264348440🔝
Call Girls in Inderpuri Delhi 💯Call Us 🔝8264348440🔝Call Girls in Inderpuri Delhi 💯Call Us 🔝8264348440🔝
Call Girls in Inderpuri Delhi 💯Call Us 🔝8264348440🔝
 
Call Girls In Sahibabad Ghaziabad ❤️8860477959 Low Rate Escorts Service In 24...
Call Girls In Sahibabad Ghaziabad ❤️8860477959 Low Rate Escorts Service In 24...Call Girls In Sahibabad Ghaziabad ❤️8860477959 Low Rate Escorts Service In 24...
Call Girls In Sahibabad Ghaziabad ❤️8860477959 Low Rate Escorts Service In 24...
 
Listing Turkey Sylvana Istanbul - Bahcesehir
Listing Turkey Sylvana Istanbul - BahcesehirListing Turkey Sylvana Istanbul - Bahcesehir
Listing Turkey Sylvana Istanbul - Bahcesehir
 
Low Rate Call Girls in Triveni Complex Delhi Call 9873940964
Low Rate Call Girls in Triveni Complex Delhi Call 9873940964Low Rate Call Girls in Triveni Complex Delhi Call 9873940964
Low Rate Call Girls in Triveni Complex Delhi Call 9873940964
 
Low Rate Call Girls in Akshardham Delhi Call 9990771857
Low Rate Call Girls in Akshardham   Delhi Call 9990771857Low Rate Call Girls in Akshardham   Delhi Call 9990771857
Low Rate Call Girls in Akshardham Delhi Call 9990771857
 
9711199012 Call {Girls Delhi} Very Low rate Vaishali DownLoad PDF
9711199012 Call {Girls Delhi} Very Low rate Vaishali DownLoad PDF9711199012 Call {Girls Delhi} Very Low rate Vaishali DownLoad PDF
9711199012 Call {Girls Delhi} Very Low rate Vaishali DownLoad PDF
 
Call Girls In Mundka Industrial Metro@꧂8447779280 ↬Enjoy ꧂Escort Service in ...
Call Girls In Mundka Industrial Metro@꧂8447779280 ↬Enjoy ꧂Escort Service in  ...Call Girls In Mundka Industrial Metro@꧂8447779280 ↬Enjoy ꧂Escort Service in  ...
Call Girls In Mundka Industrial Metro@꧂8447779280 ↬Enjoy ꧂Escort Service in ...
 
Call Girls in Nehru Place Delhi 💯Call Us 🔝8264348440🔝
Call Girls in Nehru Place Delhi 💯Call Us 🔝8264348440🔝Call Girls in Nehru Place Delhi 💯Call Us 🔝8264348440🔝
Call Girls in Nehru Place Delhi 💯Call Us 🔝8264348440🔝
 
9990771857 Call Girls in Noida Sector 34 Noida (Call Girls) Delhi
9990771857 Call Girls in Noida Sector 34 Noida (Call Girls) Delhi9990771857 Call Girls in Noida Sector 34 Noida (Call Girls) Delhi
9990771857 Call Girls in Noida Sector 34 Noida (Call Girls) Delhi
 
Call Girls in Mahavir Nagar whatsaap call US +919953056974
Call Girls in Mahavir Nagar  whatsaap call US  +919953056974Call Girls in Mahavir Nagar  whatsaap call US  +919953056974
Call Girls in Mahavir Nagar whatsaap call US +919953056974
 
The Omaxe State Dwarka Delhi-broucher.pdf.pdf
The Omaxe State Dwarka Delhi-broucher.pdf.pdfThe Omaxe State Dwarka Delhi-broucher.pdf.pdf
The Omaxe State Dwarka Delhi-broucher.pdf.pdf
 
Call Girls in Sarai Kale Khan Delhi 💯Call Us 🔝8264348440🔝
Call Girls in Sarai Kale Khan Delhi 💯Call Us 🔝8264348440🔝Call Girls in Sarai Kale Khan Delhi 💯Call Us 🔝8264348440🔝
Call Girls in Sarai Kale Khan Delhi 💯Call Us 🔝8264348440🔝
 
young call girls in Lajpat Nagar,🔝 9953056974 🔝 escort Service
young call girls in Lajpat Nagar,🔝 9953056974 🔝 escort Serviceyoung call girls in Lajpat Nagar,🔝 9953056974 🔝 escort Service
young call girls in Lajpat Nagar,🔝 9953056974 🔝 escort Service
 
Call Girls in Model Town Delhi 💯Call Us 🔝8264348440🔝
Call Girls in Model Town Delhi 💯Call Us 🔝8264348440🔝Call Girls in Model Town Delhi 💯Call Us 🔝8264348440🔝
Call Girls in Model Town Delhi 💯Call Us 🔝8264348440🔝
 
SSPL The Strand Abodes Kharadi Pune Brochure.pdf
SSPL The Strand Abodes Kharadi Pune Brochure.pdfSSPL The Strand Abodes Kharadi Pune Brochure.pdf
SSPL The Strand Abodes Kharadi Pune Brochure.pdf
 
Puravankara Mundhwa Pune E-Brochure.pdf
Puravankara Mundhwa Pune  E-Brochure.pdfPuravankara Mundhwa Pune  E-Brochure.pdf
Puravankara Mundhwa Pune E-Brochure.pdf
 
Choose Noida's Leading Architect
Choose    Noida's    Leading   ArchitectChoose    Noida's    Leading   Architect
Choose Noida's Leading Architect
 
8 Key Elements for Comfortable Farmland Living
8 Key Elements for Comfortable Farmland Living 8 Key Elements for Comfortable Farmland Living
8 Key Elements for Comfortable Farmland Living
 
9990771857 Call Girls in Noida Sector 1 Noida (Call Girls) Delhi
9990771857 Call Girls in Noida Sector 1 Noida (Call Girls) Delhi9990771857 Call Girls in Noida Sector 1 Noida (Call Girls) Delhi
9990771857 Call Girls in Noida Sector 1 Noida (Call Girls) Delhi
 
Call Girls In The Lalit New Delhi ❤️8860477959 Good Looking Escorts In 24/7 D...
Call Girls In The Lalit New Delhi ❤️8860477959 Good Looking Escorts In 24/7 D...Call Girls In The Lalit New Delhi ❤️8860477959 Good Looking Escorts In 24/7 D...
Call Girls In The Lalit New Delhi ❤️8860477959 Good Looking Escorts In 24/7 D...
 

SF Housing Snapshot Shows Declines in July 2023 Metrics

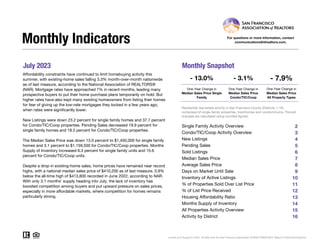
  • 1. July 2023 Monthly Snapshot One-Year Change in One-Year Change in Median Sales Price Single Family Median Sales Price Condo/TIC/Coop 2 3 4 5 6 7 8 9 10 11 12 13 14 15 16 Monthly Indicators - 13.0% - 3.1% - 7.9% One-Year Change in Affordability constraints have continued to limit homebuying activity this summer, with existing-home sales falling 3.3% month-over-month nationwide as of last measure, according to the National Association of REALTORS® (NAR). Mortgage rates have approached 7% in recent months, leading many prospective buyers to put their home purchase plans temporarily on hold. But higher rates have also kept many existing homeowners from listing their homes for fear of giving up the low-rate mortgages they locked in a few years ago, when rates were significantly lower. New Listings were down 23.2 percent for single family homes and 37.7 percent for Condo/TIC/Coop properties. Pending Sales decreased 19.9 percent for single family homes and 18.5 percent for Condo/TIC/Coop properties. The Median Sales Price was down 13.0 percent to $1,450,000 for single family homes and 3.1 percent to $1,159,500 for Condo/TIC/Coop properties. Months Supply of Inventory increased 6.3 percent for single family units and 15.6 percent for Condo/TIC/Coop units. Despite a drop in existing-home sales, home prices have remained near record highs, with a national median sales price of $410,200 as of last measure, 0.9% below the all-time high of $413,800 recorded in June 2022, according to NAR. With only 3.1 months’ supply heading into July, the lack of inventory has boosted competition among buyers and put upward pressure on sales prices, especially in more affordable markets, where competition for homes remains particularly strong. Median Sales Price All Property Types Residential real estate activity in San Francisco County (Districts 1-10) composed of single-family properties, townhomes and condominiums. Percent changes are calculated using rounded figures. Single Family Activity Overview Months Supply of Inventory For questions or more information, contact communications@sfrealtors.com. Current as of August 8, 2023. All data from the San Francisco Association of REALTORS® MLS. Report © 2023 ShowingTime. Condo/TIC/Coop Activity Overview Inventory of Active Listings % of Properties Sold Over List Price % of List Price Received Housing Affordability Ratio All Properties Activity Overview New Listings Pending Sales Sold Listings Median Sales Price Average Sales Price Days on Market Until Sale Activity by District
  • 2. Single Family Activity Overview Key metrics by report month and for year-to-date (YTD) starting from the first of the year. Key Metrics Historical Sparkbars 7-2022 7-2023 Percent Change YTD 2022 YTD 2023 Percent Change Current as of August 8, 2023. All data from the San Francisco Association of REALTORS® MLS. Report © 2023 ShowingTime. | 2 Months Supply 1.6 1.7 + 6.3% -- -- -- Affordability Ratio 27 27 0.0% % of List Price Received 111.0% 108.2% - 2.5% 119.1% 24 61.9% - 27.2% - 10.0% 26 + 8.3% 107.2% % of Properties Sold Over List Price 78.6% 66.9% - 14.9% 85.0% Active Listings 367 277 - 24.5% -- Avg. Sales Price $2,060,515 $1,842,327 - 10.6% $2,360,524 Days on Market 21 26 + 23.8% 20 31 + 55.0% $2,045,100 -- -- Median Sales Price $1,667,500 $1,450,000 - 13.0% $1,900,000 Sold Listings 182 157 - 13.7% 1,516 New Listings 241 185 - 23.2% 2,048 Pending Sales 181 145 - 19.9% - 27.7% 1,543 1,116 - 26.9% 1,498 1,076 - 29.0% $1,550,000 - 18.4% - 13.4% 7-2020 7-2021 7-2022 7-2023 7-2020 7-2021 7-2022 7-2023 7-2020 7-2021 7-2022 7-2023 7-2020 7-2021 7-2022 7-2023 7-2020 7-2021 7-2022 7-2023 7-2020 7-2021 7-2022 7-2023 7-2020 7-2021 7-2022 7-2023 7-2020 7-2021 7-2022 7-2023 7-2020 7-2021 7-2022 7-2023 7-2020 7-2021 7-2022 7-2023 7-2020 7-2021 7-2022 7-2023
  • 3. Condo/TIC/Coop Activity Overview Key metrics by report month and for year-to-date (YTD) starting from the first of the year. Key Metrics Historical Sparkbars 7-2022 7-2023 Percent Change YTD 2022 YTD 2023 Percent Change Current as of August 8, 2023. All data from the San Francisco Association of REALTORS® MLS. Report © 2023 ShowingTime. | 3 Months Supply 3.2 3.7 + 15.6% -- -- -- Affordability Ratio 43 39 - 9.3% % of List Price Received 101.5% 99.8% - 1.7% 105.3% 42 33.9% - 37.9% - 5.1% 41 - 2.4% 99.9% % of Properties Sold Over List Price 39.6% 31.6% - 20.2% 54.6% Active Listings 1,020 706 - 30.8% -- Avg. Sales Price $1,466,757 $1,237,833 - 15.6% $1,410,635 Days on Market 49 52 + 6.1% 40 $1,100,088 - 11.3% - 10.6% 57 + 42.5% $1,261,552 -- -- Sold Listings 235 158 - 32.8% 2,124 1,305 - 38.6% Median Sales Price $1,197,000 $1,159,500 - 3.1% $1,240,000 - 36.7% Pending Sales 222 181 - 18.5% 2,133 1,371 - 35.7% New Listings 382 238 - 37.7% 3,514 2,225 7-2020 7-2021 7-2022 7-2023 7-2020 7-2021 7-2022 7-2023 7-2020 7-2021 7-2022 7-2023 7-2020 7-2021 7-2022 7-2023 7-2020 7-2021 7-2022 7-2023 7-2020 7-2021 7-2022 7-2023 7-2020 7-2021 7-2022 7-2023 7-2020 7-2021 7-2022 7-2023 7-2020 7-2021 7-2022 7-2023 7-2020 7-2021 7-2022 7-2023 7-2020 7-2021 7-2022 7-2023
  • 4. New Listings New Listings Single Family Year-Over-Year Change Condo/TIC/ Coop Year-Over-Year Change Aug-2022 239 -13.7% 309 -20.4% Sep-2022 367 -13.2% 574 -20.5% Oct-2022 243 -27.0% 378 -28.5% Nov-2022 153 -10.5% 153 -42.3% Dec-2022 72 -13.3% 78 -46.9% Jan-2023 168 -26.3% 342 -27.5% Feb-2023 175 -39.2% 314 -41.3% Mar-2023 242 -29.2% 362 -41.2% Apr-2023 237 -28.0% 326 -39.9% May-2023 277 -8.0% 325 -37.0% Jun-2023 214 -32.9% 318 -29.5% Jul-2023 185 -23.2% 238 -37.7% 12-Month Avg 214 -22.9% 310 -33.2% Historical New Listings by Month Current as of August 8, 2023. All data from the San Francisco Association of REALTORS® MLS. Report © 2023 ShowingTime. | 4 A count of the properties that have been newly listed on the market in a given month. 306 458 241 382 185 238 Single Family Condo/TIC/Coop July 0 200 400 600 800 1-2005 1-2006 1-2007 1-2008 1-2009 1-2010 1-2011 1-2012 1-2013 1-2014 1-2015 1-2016 1-2017 1-2018 1-2019 1-2020 1-2021 1-2022 1-2023 Single Family Condo/TIC/Coop 2,172 3,590 2,048 3,514 1,498 2,225 Single Family Condo/TIC/Coop Year to Date 2021 2022 2023 - 37.7% - 16.6% - 23.2% - 21.2% - 2.1% - 26.9% - 5.7% - 36.7% 2021 2022 2023 2021 2022 2023 2021 2022 2023 - 18.8% + 21.5% + 26.0% - 30.7%
  • 5. Pending Sales Pending Sales Single Family Year-Over-Year Change Condo/TIC/ Coop Year-Over-Year Change Aug-2022 181 -19.9% 232 -26.6% Sep-2022 189 -42.6% 213 -36.8% Oct-2022 195 -28.6% 221 -45.4% Nov-2022 166 -35.9% 160 -55.6% Dec-2022 116 -10.1% 122 -46.0% Jan-2023 87 -40.0% 122 -51.4% Feb-2023 126 -41.4% 176 -38.7% Mar-2023 169 -41.1% 244 -44.2% Apr-2023 187 -30.5% 231 -32.8% May-2023 209 -16.1% 216 -34.9% Jun-2023 193 -2.0% 201 -22.7% Jul-2023 145 -19.9% 181 -18.5% 12-Month Avg 164 -28.9% 193 -38.6% Historical Pending Sales by Month A count of the properties on which offers have been accepted in a given month. Current as of August 8, 2023. All data from the San Francisco Association of REALTORS® MLS. Report © 2023 ShowingTime. | 5 259 364 181 222 145 181 Single Family Condo/TIC/Coop July 0 100 200 300 400 500 600 1-2005 1-2006 1-2007 1-2008 1-2009 1-2010 1-2011 1-2012 1-2013 1-2014 1-2015 1-2016 1-2017 1-2018 1-2019 1-2020 1-2021 1-2022 1-2023 Single Family Condo/TIC/Coop 1,810 2,842 1,543 2,133 1,116 1,371 Single Family Condo/TIC/Coop Year to Date 2021 2022 2023 - 18.5% - 39.0% - 19.9% - 30.1% - 24.9% - 27.7% - 14.8% - 35.7% 2021 2022 2023 2021 2022 2023 2021 2022 2023 - 6.2% + 53.1% + 121.7% + 50.4%
  • 6. Sold Listings Sold Listings Single Family Year-Over-Year Change Condo/TIC/ Coop Year-Over-Year Change Aug-2022 190 -25.8% 237 -31.9% Sep-2022 180 -26.5% 210 -28.1% Oct-2022 192 -38.1% 224 -38.5% Nov-2022 186 -36.5% 207 -51.3% Dec-2022 154 -28.7% 147 -54.8% Jan-2023 100 -23.1% 104 -44.1% Feb-2023 101 -36.5% 142 -43.2% Mar-2023 151 -41.2% 248 -37.1% Apr-2023 175 -31.9% 217 -43.2% May-2023 188 -33.3% 230 -37.5% Jun-2023 204 -18.1% 206 -33.3% Jul-2023 157 -13.7% 158 -32.8% 12-Month Avg 165 -30.3% 194 -39.9% Historical Sold Listings by Month A count of the actual sales that closed in a given month. Current as of August 8, 2023. All data from the San Francisco Association of REALTORS® MLS. Report © 2023 ShowingTime. | 6 255 369 182 235 157 158 Single Family Condo/TIC/Coop July 0 100 200 300 400 500 1-2005 1-2006 1-2007 1-2008 1-2009 1-2010 1-2011 1-2012 1-2013 1-2014 1-2015 1-2016 1-2017 1-2018 1-2019 1-2020 1-2021 1-2022 1-2023 Single Family Condo/TIC/Coop 1,731 2,753 1,516 2,124 1,076 1,305 Single Family Condo/TIC/Coop Year to Date 2021 2022 2023 - 32.8% - 36.3% - 13.7% - 28.6% - 22.8% - 29.0% - 12.4% - 38.6% 2021 2022 2023 2021 2022 2023 2021 2022 2023 + 7.1% + 61.5% + 122.2% + 38.7%
  • 7. Median Sales Price Median Sales Price Single Family Year-Over-Year Change Condo/TIC/ Coop Year-Over-Year Change Aug-2022 $1,605,000 -13.1% $1,000,000 -13.0% Sep-2022 $1,650,000 -5.7% $1,160,000 -3.3% Oct-2022 $1,670,000 -7.5% $1,200,000 -3.8% Nov-2022 $1,500,000 -20.2% $1,125,000 -10.7% Dec-2022 $1,537,500 -9.0% $950,000 -26.9% Jan-2023 $1,367,500 -16.1% $992,900 -7.2% Feb-2023 $1,440,000 -25.4% $1,162,500 -5.3% Mar-2023 $1,697,500 -15.1% $1,060,000 -12.2% Apr-2023 $1,570,000 -23.4% $1,175,000 -14.2% May-2023 $1,650,000 -17.8% $1,082,544 -10.9% Jun-2023 $1,590,000 -15.4% $1,127,500 -9.1% Jul-2023 $1,450,000 -13.0% $1,159,500 -3.1% 12-Month Avg* $1,570,000 -15.1% $1,100,000 -10.9% Historical Median Sales Price by Month Point at which half of the sales sold for more and half sold for less, not accounting for seller concessions, in a given month. * Median Sales Price for all properties from August 2022 through July 2023. This is not the average of the individual figures above. Current as of August 8, 2023. All data from the San Francisco Association of REALTORS® MLS. Report © 2023 ShowingTime. | 7 $1,850,000 $1,210,000 $1,667,500 $1,197,000 $1,450,000 $1,159,500 Single Family Condo/TIC/Coop July $500,000 $750,000 $1,000,000 $1,250,000 $1,500,000 $1,750,000 $2,000,000 $2,250,000 1-2005 1-2006 1-2007 1-2008 1-2009 1-2010 1-2011 1-2012 1-2013 1-2014 1-2015 1-2016 1-2017 1-2018 1-2019 1-2020 1-2021 1-2022 1-2023 Single Family Condo/TIC/Coop $1,800,000 $1,200,000 $1,900,000 $1,240,000 $1,550,000 $1,100,088 Single Family Condo/TIC/Coop Year to Date 2021 2022 2023 - 3.1% - 1.1% - 13.0% - 9.9% + 3.3% - 18.4% + 5.6% - 11.3% 2021 2022 2023 2021 2022 2023 2021 2022 2023 + 15.3% + 11.9% - 1.6% - 4.0%
  • 8. Average Sales Price Average Sales Price Single Family Year-Over-Year Change Condo/TIC/ Coop Year-Over-Year Change Aug-2022 $1,946,588 -8.5% $1,174,880 -17.6% Sep-2022 $1,881,502 -13.1% $1,343,336 +0.8% Oct-2022 $2,211,462 -6.3% $1,418,171 -3.0% Nov-2022 $1,895,086 -19.4% $1,394,166 -9.4% Dec-2022 $1,870,417 -20.9% $1,098,424 -26.2% Jan-2023 $1,811,636 -8.1% $1,261,866 -3.8% Feb-2023 $1,823,104 -24.6% $1,296,409 -7.3% Mar-2023 $2,280,520 -10.0% $1,207,124 -14.5% Apr-2023 $2,224,904 -11.3% $1,370,225 -7.1% May-2023 $2,145,625 -11.0% $1,175,652 -16.2% Jun-2023 $2,005,523 -14.9% $1,302,515 -4.7% Jul-2023 $1,842,327 -10.6% $1,237,833 -15.6% 12-Month Avg* $2,009,173 -13.5% $1,276,654 -10.8% Historical Average Sales Price by Month Average sales price for all closed sales, not accounting for seller concessions, in a given month. * Avg. Sales Price for all properties from August 2022 through July 2023. This is not the average of the individual figures above. Current as of August 8, 2023. All data from the San Francisco Association of REALTORS® MLS. Report © 2023 ShowingTime. | 8 $2,292,230 $1,357,053 $2,060,515 $1,466,757 $1,842,327 $1,237,833 Single Family Condo/TIC/Coop July $500,000 $1,000,000 $1,500,000 $2,000,000 $2,500,000 $3,000,000 1-2005 1-2006 1-2007 1-2008 1-2009 1-2010 1-2011 1-2012 1-2013 1-2014 1-2015 1-2016 1-2017 1-2018 1-2019 1-2020 1-2021 1-2022 1-2023 Single Family Condo/TIC/Coop $2,335,262 $1,350,662 $2,360,524 $1,410,635 $2,045,100 $1,261,552 Single Family Condo/TIC/Coop Year to Date 2021 2022 2023 - 15.6% + 8.1% - 10.6% - 10.1% + 4.4% - 13.4% + 1.1% - 10.6% 2021 2022 2023 2021 2022 2023 2021 2022 2023 + 13.8% + 13.9% - 0.2% - 2.9%
  • 9. Days on Market Until Sale Days on Market Until Sale Single Family Year-Over-Year Change Condo/TIC/ Coop Year-Over-Year Change Aug-2022 26 +4.0% 50 +16.3% Sep-2022 28 +21.7% 58 +45.0% Oct-2022 28 +40.0% 43 +19.4% Nov-2022 35 +66.7% 51 +24.4% Dec-2022 38 +22.6% 74 +57.4% Jan-2023 50 +22.0% 87 +27.9% Feb-2023 33 +50.0% 59 +63.9% Mar-2023 32 +100.0% 58 +70.6% Apr-2023 31 +93.8% 56 +75.0% May-2023 28 +33.3% 52 +40.5% Jun-2023 26 +52.9% 50 +28.2% Jul-2023 26 +23.8% 52 +6.1% 12-Month Avg* 31 +41.1% 56 +37.4% Historical Days on Market Until Sale by Month Average number of days between when a property is listed and when an offer is accepted in a given month. * Days on Market for all properties from August 2022 through July 2023. This is not the average of the individual figures above. Current as of August 8, 2023. All data from the San Francisco Association of REALTORS® MLS. Report © 2023 ShowingTime. | 9 19 42 21 49 26 52 Single Family Condo/TIC/Coop July 0 20 40 60 80 100 120 1-2005 1-2006 1-2007 1-2008 1-2009 1-2010 1-2011 1-2012 1-2013 1-2014 1-2015 1-2016 1-2017 1-2018 1-2019 1-2020 1-2021 1-2022 1-2023 Single Family Condo/TIC/Coop 24 48 20 40 31 57 Single Family Condo/TIC/Coop Year to Date 2021 2022 2023 + 6.1% + 16.7% + 23.8% + 10.5% - 16.7% + 55.0% - 16.7% + 42.5% 2021 2022 2023 2021 2022 2023 2021 2022 2023 - 29.6% - 14.3% + 20.0% + 2.4%
  • 10. Inventory of Active Listings Inventory of Active Listings Single Family Year-Over-Year Change Condo/TIC/ Coop Year-Over-Year Change Aug-2022 351 -18.4% 894 -12.4% Sep-2022 483 +1.9% 1,103 -15.0% Oct-2022 473 -3.3% 1,095 -15.8% Nov-2022 375 +3.0% 869 -20.2% Dec-2022 216 +5.4% 520 -23.1% Jan-2023 260 -0.4% 648 -21.8% Feb-2023 286 -4.3% 720 -27.3% Mar-2023 321 +1.9% 768 -26.7% Apr-2023 342 +1.8% 784 -29.4% May-2023 353 +6.6% 797 -28.8% Jun-2023 310 -17.6% 776 -29.6% Jul-2023 277 -24.5% 706 -30.8% 12-Month Avg* 337 -4.7% 807 -23.2% Historical Inventory of Active Listings by Month The number of properties available for sale in active status at the end of a given month. * Active Listings for all properties from August 2022 through July 2023. This is not the average of the individual figures above. Current as of August 8, 2023. All data from the San Francisco Association of REALTORS® MLS. Report © 2023 ShowingTime. | 10 425 1,059 367 1,020 277 706 Single Family Condo/TIC/Coop July 0 500 1,000 1,500 2,000 2,500 1-2005 1-2006 1-2007 1-2008 1-2009 1-2010 1-2011 1-2012 1-2013 1-2014 1-2015 1-2016 1-2017 1-2018 1-2019 1-2020 1-2021 1-2022 1-2023 Single Family Condo/TIC/Coop 2021 2022 2023 - 30.8% - 3.7% - 24.5% - 13.6% 2021 2022 2023 - 28.1% - 29.6%
  • 11. % of Properties Sold Over List Price % of Properties Sold Over List Price Single Family Year-Over-Year Change Condo/TIC/ Coop Year-Over-Year Change Aug-2022 75.3% -10.8% 37.1% -32.1% Sep-2022 67.2% -20.5% 31.0% -43.1% Oct-2022 64.1% -24.1% 37.5% -38.2% Nov-2022 57.5% -27.7% 30.4% -45.5% Dec-2022 48.7% -38.1% 15.6% -66.5% Jan-2023 44.0% -41.6% 19.2% -50.4% Feb-2023 51.5% -40.7% 28.2% -51.7% Mar-2023 62.7% -27.4% 36.3% -37.5% Apr-2023 61.7% -30.4% 32.7% -47.9% May-2023 63.3% -27.2% 40.9% -26.0% Jun-2023 70.1% -18.8% 37.9% -33.9% Jul-2023 66.9% -14.9% 31.6% -20.2% 12-Month Avg 62.4% -25.5% 32.9% -39.8% Historical % of Properties Sold Over List Price by Month Percentage found when dividing the number of properties sold by properties sold over its original list price, not accounting for seller concessions. * % of Properties Sold Over List Price for all properties from August 2022 through July 2023. This is not the average of the individual figures above. Current as of August 8, 2023. All data from the San Francisco Association of REALTORS® MLS. Report © 2023 ShowingTime. | 11 83.5% 55.6% 78.6% 39.6% 66.9% 31.6% Single Family Condo/TIC/Coop July 0.0% 20.0% 40.0% 60.0% 80.0% 100.0% 1-2005 1-2006 1-2007 1-2008 1-2009 1-2010 1-2011 1-2012 1-2013 1-2014 1-2015 1-2016 1-2017 1-2018 1-2019 1-2020 1-2021 1-2022 1-2023 Single Family Condo/TIC/Coop 76.1% 45.8% 85.0% 54.6% 61.9% 33.9% Single Family Condo/TIC/Coop Year to Date 2021 2022 2023 - 20.2% - 28.8% - 14.9% - 5.9% + 19.2% - 27.2% + 11.7% - 37.9% 2021 2022 2023 2021 2022 2023 2021 2022 2023 + 29.1% + 14.3% - 4.6% + 25.2%
  • 12. % of List Price Received % of List Price Received Single Family Year-Over-Year Change Condo/TIC/ Coop Year-Over-Year Change Aug-2022 108.3% -6.7% 100.7% -3.5% Sep-2022 108.5% -6.7% 100.6% -4.2% Oct-2022 107.1% -8.5% 100.4% -4.8% Nov-2022 104.9% -8.6% 99.2% -5.2% Dec-2022 102.9% -10.0% 98.1% -5.2% Jan-2023 103.2% -12.1% 98.0% -3.1% Feb-2023 103.7% -14.4% 99.0% -6.7% Mar-2023 108.0% -11.4% 100.4% -5.6% Apr-2023 107.0% -13.1% 99.9% -6.8% May-2023 108.2% -9.5% 100.1% -5.5% Jun-2023 108.7% -6.9% 100.6% -4.5% Jul-2023 108.2% -2.5% 99.8% -1.7% 12-Month Avg* 106.9% -9.1% 99.9% -4.8% Historical % of List Price Received by Month Percentage found when dividing a property’s sales price by its most recent list price, then taking the average for all properties sold in a given month, not accounting for seller concessions. * % of List Price Received for all properties from August 2022 through July 2023. This is not the average of the individual figures above. Current as of August 8, 2023. All data from the San Francisco Association of REALTORS® MLS. Report © 2023 ShowingTime. | 12 118.5% 104.8% 111.0% 101.5% 108.2% 99.8% Single Family Condo/TIC/Coop July 114.0% 103.4% 119.1% 105.3% 107.2% 99.9% Single Family Condo/TIC/Coop Year to Date 90.0% 100.0% 110.0% 120.0% 130.0% 1-2005 1-2006 1-2007 1-2008 1-2009 1-2010 1-2011 1-2012 1-2013 1-2014 1-2015 1-2016 1-2017 1-2018 1-2019 1-2020 1-2021 1-2022 1-2023 Single Family Condo/TIC/Coop 2021 2022 2023 - 1.7% - 3.1% - 2.5% - 6.3% 2021 2022 2023 + 11.8% + 3.8% 2021 2022 2023 - 5.1% + 1.8% - 10.0% + 4.5% 2021 2022 2023 + 5.2% + 1.1%
  • 13. Housing Affordability Ratio Housing Affordability Ratio Single Family Year-Over-Year Change Condo/TIC/ Coop Year-Over-Year Change Aug-2022 28 -6.7% 51 -10.5% Sep-2022 24 -25.0% 39 -29.1% Oct-2022 23 -25.8% 37 -30.2% Nov-2022 27 -10.0% 40 -25.9% Dec-2022 27 -15.6% 49 0.0% Jan-2023 31 -3.1% 48 -15.8% Feb-2023 28 +3.7% 40 -18.4% Mar-2023 24 0.0% 44 -2.2% Apr-2023 26 +23.8% 40 +8.1% May-2023 25 +13.6% 42 0.0% Jun-2023 25 +8.7% 40 0.0% Jul-2023 27 0.0% 39 -9.3% 12-Month Avg* 26 -2.2% 42 -19.3% Historical Housing Affordability Ratio by Month This index measures housing affordability for the region. For example, an index of 120 means the median household income is 120% of what is necessary to qualify for the median-priced home under prevailing interest rates. A higher number means greater affordability. * Affordability Ratio for all properties from August 2022 through July 2023. This is not the average of the individual figures above. Current as of August 8, 2023. All data from the San Francisco Association of REALTORS® MLS. Report © 2023 ShowingTime. | 13 30 54 27 43 27 39 Single Family Condo/TIC/Coop July 20 40 60 80 100 1-2005 1-2006 1-2007 1-2008 1-2009 1-2010 1-2011 1-2012 1-2013 1-2014 1-2015 1-2016 1-2017 1-2018 1-2019 1-2020 1-2021 1-2022 1-2023 Single Family Condo/TIC/Coop 2021 2022 2023 - 9.3% - 20.4% 0.0% - 10.0% 2021 2022 2023 - 14.3% + 1.9% 31 55 24 42 26 41 Single Family Condo/TIC/Coop Year to Date 2021 2022 2023 - 2.4% - 23.6% + 8.3% - 22.6% 2021 2022 2023 - 11.4% 0.0%
  • 14. Months Supply of Inventory Months Supply of Inventory Single Family Year-Over-Year Change Condo/TIC/ Coop Year-Over-Year Change Aug-2022 1.6 0.0% 2.9 +3.6% Sep-2022 2.3 +27.8% 3.7 +5.7% Oct-2022 2.3 +21.1% 3.9 +11.4% Nov-2022 1.9 +35.7% 3.3 +13.8% Dec-2022 1.1 +37.5% 2.0 +11.1% Jan-2023 1.3 +30.0% 2.6 +18.2% Feb-2023 1.5 +25.0% 3.0 +11.1% Mar-2023 1.8 +38.5% 3.5 +20.7% Apr-2023 2.0 +42.9% 3.7 +15.6% May-2023 2.1 +50.0% 4.0 +21.2% Jun-2023 1.9 +18.8% 3.9 +14.7% Jul-2023 1.7 +6.3% 3.7 +15.6% 12-Month Avg* 1.8 +26.3% 3.4 +13.5% Historical Months Supply of Inventory by Month The inventory of homes for sale at the end of a given month, divided by the average monthly pending sales from the last 12 months. * Months Supply for all properties from August 2022 through July 2023. This is not the average of the individual figures above. Current as of August 8, 2023. All data from the San Francisco Association of REALTORS® MLS. Report © 2023 ShowingTime. | 14 1.6 2.9 1.6 3.2 1.7 3.7 Single Family Condo/TIC/Coop July 0.0 2.0 4.0 6.0 8.0 10.0 12.0 1-2005 1-2006 1-2007 1-2008 1-2009 1-2010 1-2011 1-2012 1-2013 1-2014 1-2015 1-2016 1-2017 1-2018 1-2019 1-2020 1-2021 1-2022 1-2023 Single Family Condo/TIC/Coop 2021 2022 2023 + 15.6% + 10.3% + 6.3% 0.0% 2021 2022 2023 - 50.0% - 60.8%
  • 15. All Properties Activity Overview Key metrics by report month and for year-to-date (YTD) starting from the first of the year. Key Metrics Historical Sparkbars 7-2022 7-2023 Percent Change YTD 2022 YTD 2023 Percent Change Current as of August 8, 2023. All data from the San Francisco Association of REALTORS® MLS. Report © 2023 ShowingTime. | 15 Months Supply 2.6 2.8 + 7.7% -- -- -- Affordability Ratio 30 29 - 3.3% % of List Price Received 105.6% 103.9% - 1.6% 110.9% 29 46.3% - 31.1% - 7.0% 28 - 3.4% 103.1% % of Properties Sold Over List Price 56.7% 48.9% - 13.8% 67.2% Active Listings 1,424 1,002 - 29.6% -- Avg. Sales Price $1,722,932 $1,532,532 - 11.1% $1,801,955 Days on Market 37 40 + 8.1% 32 $1,315,000 - 12.3% - 10.6% 46 + 43.8% $1,611,107 -- -- Sold Listings 420 319 - 24.0% 3,676 2,411 - 34.4% Median Sales Price $1,422,500 $1,310,000 - 7.9% $1,500,000 - 33.0% Pending Sales 409 333 - 18.6% 3,713 2,522 - 32.1% New Listings 632 430 - 32.0% 5,628 3,773 7-2020 7-2021 7-2022 7-2023 7-2020 7-2021 7-2022 7-2023 7-2020 7-2021 7-2022 7-2023 7-2020 7-2021 7-2022 7-2023 7-2020 7-2021 7-2022 7-2023 7-2020 7-2021 7-2022 7-2023 7-2020 7-2021 7-2022 7-2023 7-2020 7-2021 7-2022 7-2023 7-2020 7-2021 7-2022 7-2023 7-2020 7-2021 7-2022 7-2023 7-2020 7-2021 7-2022 7-2023
  • 16. Activity by District SF District 1: Northwest (Sea Cliff, Lake, Jordan Park / Laurel Heights, Outer Richmond, Central Richmond, Inner Richmond, Lone Mountain) SF District 2: Central West (Outer Sunset, Central Sunset, Inner Sunset, Outer Parkside, Parkside, Inner Parkside, Golden Gate Heights) SF District 3: Southwest (Pine Lake Park, Lake Shore, Merced Manor, Stonestown, Lakeside, Merced Heights, Ingleside, Ingleside Heights, Oceanview) SF District 4: Twin Peaks W (Forest Hill (& Ext), W Portal, St Francis Wd, Balboa Terr, Mt Dav Manor, Ingleside Terr, Monterey Hts, Wstwd Pk & H'lnds, Shrwd Fst, Miraloma Pk, Dmnd Hts, Mdtwn Terr) SF District 5: Central (Haight Ashbury, Cole Vly / Prnssus Hts, Clarndn Hts, Corona Hts, Twin Pks, Glen Pk, Noe Vly, Eureka Vly / Dolores Hts, Mission Dolores, Duboce Trngl, Buena Vista / Ashbury Hts) SF District 6: Central North (Lower Pacific Heights, Anza Vista, Western Addition, North Panhandle, Alamo Square, Hayes Valley) SF District 7: North (Marina, Cow Hollow, Presidio Heights, Pacific Heights) SF District 8: Northeast (North Waterfront, North Beach, Russian Hill, Telegraph Hill, Nob Hill, Financial District / Barbary Coast, Downtown, Van Ness / Civic Center, Tenderloin) SF District 9: Central East (Yerba Buena, South Beach, South of Market, Mission Bay, Inner Mission, Potrero Hill, Central Waterfront / Dogpatch, Bernal Heights) SF District 10: Southeast (Outer Mission, Mission Terr, Excelsior, Portola, Bayview, Silver Terr, Hunters Pt, Candlestick Pt, Bayview Hts, Little Hollywood, Visitation Vly, Crocker Amazon) 7-2022 7-2023 + / – 7-2022 7-2023 + / – 7-2022 7-2023 + / – 7-2022 7-2023 + / – 7-2022 7-2023 + / – Single Family 1 SF District 1 26 25 -3.8% 13 12 -7.7% $2,410,000 $1,997,500 -17.1% 17 22 +29.4% 1.2 1.8 +50.0% 2 SF District 2 46 39 -15.2% 41 35 -14.6% $1,550,000 $1,480,000 -4.5% 18 24 +33.3% 1.0 1.2 +20.0% 3 SF District 3 26 20 -23.1% 15 12 -20.0% $1,460,000 $1,265,000 -13.4% 17 25 +47.1% 1.6 1.8 +12.5% 4 SF District 4 51 20 -60.8% 26 22 -15.4% $1,940,000 $1,925,000 -0.8% 18 30 +66.7% 1.6 0.9 -43.8% 5 SF District 5 41 38 -7.3% 27 19 -29.6% $2,645,000 $2,750,000 +4.0% 19 28 +47.4% 1.2 1.8 +50.0% 6 SF District 6 4 5 +25.0% 1 0 -100.0% $2,250,000 $0 -100.0% 13 0 -100.0% 0.9 2.5 +177.8% 7 SF District 7 18 30 +66.7% 5 4 -20.0% $7,030,000 $5,250,000 -25.3% 20 87 +335.0% 1.8 4.1 +127.8% 8 SF District 8 12 10 -16.7% 3 2 -33.3% $2,000,000 $3,439,500 +72.0% 26 63 +142.3% 3.6 5.0 +38.9% 9 SF District 9 45 28 -37.8% 14 14 0.0% $1,617,500 $1,475,000 -8.8% 27 14 -48.1% 1.9 1.7 -10.5% 10 SF District 10 98 62 -36.7% 37 37 0.0% $1,200,000 $1,155,000 -3.8% 28 22 -21.4% 2.3 1.8 -21.7% Condo/TIC/Coop 1 SF District 1 31 29 -6.5% 13 10 -23.1% $1,510,000 $1,447,500 -4.1% 22 56 +154.5% 2.0 2.5 +25.0% 2 SF District 2 8 11 +37.5% 2 0 -100.0% $1,400,000 $0 -100.0% 29 0 -100.0% 2.1 2.9 +38.1% 3 SF District 3 8 2 -75.0% 2 2 0.0% $751,500 $610,750 -18.7% 23 27 +17.4% 2.1 0.9 -57.1% 4 SF District 4 13 13 0.0% 3 2 -33.3% $610,000 $702,000 +15.1% 49 57 +16.3% 2.4 4.9 +104.2% 5 SF District 5 92 65 -29.3% 40 28 -30.0% $1,322,500 $1,247,500 -5.7% 42 33 -21.4% 1.8 1.9 +5.6% 6 SF District 6 80 46 -42.5% 22 15 -31.8% $1,337,500 $950,000 -29.0% 46 49 +6.5% 2.3 2.2 -4.3% 7 SF District 7 74 43 -41.9% 26 18 -30.8% $1,500,000 $1,580,000 +5.3% 37 59 +59.5% 2.2 2.2 0.0% 8 SF District 8 199 156 -21.6% 43 36 -16.3% $1,050,000 $1,201,595 +14.4% 52 66 +26.9% 3.7 4.5 +21.6% 9 SF District 9 475 311 -34.5% 76 45 -40.8% $1,177,500 $910,000 -22.7% 63 52 -17.5% 4.5 5.3 +17.8% 10 SF District 10 40 30 -25.0% 8 2 -75.0% $734,250 $759,500 +3.4% 44 32 -27.3% 5.5 7.2 +30.9% Key metrics by report month for the districts of San Francisco. Current as of August 8, 2023. All data from the San Francisco Association of REALTORS® MLS. Report © 2023 ShowingTime. | 16 Active Listings Sold Listings Median Sales Price Days on Market Months Supply