More Related Content
Similar to Chester County Basic Supply And Demand
Similar to Chester County Basic Supply And Demand (16)
More from Prudential Fox & Roach, Realtors
More from Prudential Fox & Roach, Realtors (20)
Chester County Basic Supply And Demand
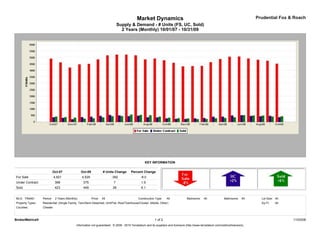
- 1. Market Dynamics Prudential Fox & Roach
Supply & Demand - # Units (FS, UC, Sold)
2 Years (Monthly) 10/01/07 - 10/31/09
KEY INFORMATION
Oct-07 Oct-09 # Units Change Percent Change
For Sale 4,921 4,529 -392 -8.0
Under Contract 368 375 7 1.9
Sold 423 449 26 6.1
MLS: TReND Period: 2 Years (Monthly) Price: All Construction Type: All Bedrooms: All Bathrooms: All Lot Size: All
Property Types: Residential: (Single Family, Twin/Semi-Detached, Unit/Flat, Row/Townhouse/Cluster, Mobile, Other) Sq Ft: All
Counties: Chester
BrokerMetrics® 1 of 2 11/03/09
Information not guaranteed. © 2009 - 2010 Terradatum and its suppliers and licensors (http://www.terradatum.com/metrics/licensors).
- 2. Market Dynamics Prudential Fox & Roach
Supply & Demand - # Units (FS, UC, Sold)
2 Years (Monthly) 10/01/07 - 10/31/09
FOR SALE UNDER CONTRACT SOLD EXPIRED NEW LISTINGS
Time Period # Properties Average DOM # Properties Average DOM # Properties Average DOM # Properties Average DOM # Properties
Oct-09 4,529 167 375 95 449 82 458 198 714
Sep-09 4,760 185 479 83 424 90 466 206 797
Aug-09 4,835 200 449 82 506 77 423 197 797
Jul-09 4,932 211 472 84 509 80 422 189 830
Jun-09 5,083 219 525 86 530 85 456 192 905
May-09 5,072 230 511 82 367 93 383 237 971
Apr-09 4,894 241 420 88 317 103 373 197 1,009
Mar-09 4,647 255 415 101 296 105 347 216 937
Feb-09 4,357 273 320 95 239 92 327 232 751
Jan-09 4,340 280 289 109 226 93 445 193 705
Dec-08 4,321 285 239 97 282 88 447 189 406
Nov-08 4,595 277 245 86 300 86 435 180 518
Oct-08 4,793 272 284 82 336 81 432 193 720
Sep-08 4,928 265 355 80 418 75 500 173 905
Aug-08 4,864 264 364 75 522 76 477 172 702
Jul-08 5,174 255 484 80 551 71 528 194 886
Jun-08 5,235 252 459 71 579 67 488 209 953
May-08 5,235 247 513 65 458 78 440 167 1,113
Apr-08 5,174 248 552 77 452 80 500 201 1,195
Mar-08 4,866 252 475 80 361 96 412 185 1,148
Feb-08 4,518 262 418 84 293 92 382 264 904
Jan-08 4,477 264 379 92 264 86 484 179 981
Dec-07 4,226 274 214 103 336 81 516 190 375
Nov-07 4,631 259 324 79 377 65 456 146 638
Oct-07 4,921 249 368 74 423 68 560 170 989
BrokerMetrics® 2 of 2 11/03/09
Information not guaranteed. © 2009 - 2010 Terradatum and its suppliers and licensors (http://www.terradatum.com/metrics/licensors).