More Related Content
Similar to Lulc dynamics (20)
Lulc dynamics
- 1. TEMPLATE DESIGN © 2008
www.PosterPresentations.com
Land-Use Land-Cover Dynamics of Coastal South Carolina Watersheds
Amit Kumar Patel
Department of Earth and Atmospheric sciences
National institute of technology , Rourkela,769008
Abstract
Introduction
Objectives
Material and Methods
Results
Conclusions
Acknowledgements
Changes in land use land cover (LULC) are a potential threat to
coastal ecosystem health and the evolving geospatial
technology (remote sensing and GIS) fits adequately for long-
term monitoring and assessment of such effects. The objective
of this research was to assess the historical changes in land
use/cover in the coastal counties of South Carolina from 1996 to
2006. The study used high resolution LANDSAT data of the U.S
Geological Survey and supervised Anderson LULC Level-2
classified data of the National Oceanic and Atmospheric
Administration’s (NOAA) Coastal Change Analysis Program (C-
CAP) to assess historic LULC changes for the coastal South
Carolina counties for the 10-year study period. Statistics on
distribution of change (losses and gains) by land cover were
then devised from the remote sensed data.
The results show an increase in the extent of open water cover
in the South Carolina coastal counties investigated-perhaps due
to global warming and the resulting rise in sea level. Similarly,
scrub/shrub lands increased; but forestlands and some wetlands
decreased for all the counties from 1996 to 2006. The increase
in surface waters could negatively affect the beaches for
recreation/tourism as well as biological diversity in the coastal
waters. Also the decreased forest and wetlands could impact
the coastal environment negatively by decreasing ecological
services such as photosynthesis and carbon sequestration,
biodiversity, water purification and flooding. More detailed LULC
study of 20-30 year trends is suggested for a more holistic
determination of the trends in coastal South Carolina
watersheds in general.
Changes in LULC impact the environment’s quality and the
quality of life and human wellbeing. Changes in habitat, water
and air quality and the quality of life are some of the
environment, social and economic concerns associated with
LULC changes. The U.S population that most directly affects the
coast resides in a standard suite of coastal watershed counties
where land use and water quality changes most directly impact
coastal ecosystems. Coastal watershed counties can be thought
of as ‘ the population that most directly affects the coast’ (U.S
EPA, 2006)
Remote sensing has played an important role in mapping land-
cover and quantifying change for more than 25 years. Land
cover represents one of the most fundamental applications of
remote sensing, and is widely used to parameterize hydrological
and biogeochemical models.
References
•NOAA –retrieved from
http://oceanservice.noaa.gov/facts/lclu.html
•CARA - retrieved from http://www.cara.psu.edu/land/lu-
primer/luprimer02.asp
•USGS National Land Cover Characterization : retrieved
http://landcover.usgs.gov/nationallandcover.html
•NOSAKHARE, O.K.; AIGHEWI ,I.T.; CHI, A.Y.; ISHAQUE,
A.B., and MBAMALU, G., 2012. Land use-land cover changes in
the lower Eastern Shore watersheds and coastal bays of
Maryland: 1986-2006. Journal of Coastal Research, 28(1A),
p56-62. West Palm Beach, FL, ISSN O749-0208
•AIGHEWI, I.T.; NOSAKHARE, O.K., and ISHAQUE, A.B.,
0000. Land use-land cover changes and
sewage loading in the lower Eastern Shore watersheds and
coastal bays of Maryland: Implications for surface water quality.
Journal of Coastal Research, 00(0), 000-000. West Palm Beach,
FL, ISSN O749-0208
•TIGER – retrieved from www.census.gov
Fig 1: Showing the process of remote sensing
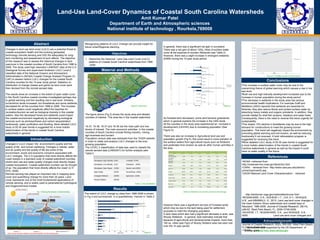
(Figure 2): Study Area
The figure above (Fig 2) shows the study area and labeled
counties of interest. This area lies in the coastal watershed
15-37, 16-36, 16-37 and 16-38 are the main path and row
blocks of interest. The main economic activities in the coastal
counties of South Carolina include fishing industry, mining ,
agri-business and tourism.
Population census data was extracted from the TIGER website
in order to relate and analyze LULC changes to the ever-
growing population.
The LEVEL 2 classification of data was used to classify the
remote sensed data (LANDSAT) for further analysis (see
Table1).
(Table 2): Distribution of Land Use-Land Cover and Changes
(Figure 3)
(Figure 4)
LEVEL 2 classification of Land Use-Land Cover (LULC) system
Developed, High Intensity (HID) Forested (FOR)
Developed, Low Intensity (LID) Grassland (GRS)
Developed, Open Space (OSD) Barren Land (BAR)
Open Water (WTR) Scrub/Shrub (SCB)
Emergent Wetland (EMW) Agriculture (AGR)
Woody Wetland (WDW)
(Table 1): Data Classification
1. Determine the historical Land Use-Land Cover (LULC)
patterns of Coastal South Carolina watersheds from 1996
-2006
(Figure 5): Population growth over study period
This research was supported by the US Department of
Energy grant.
The increase in surface water cover may be due to the
overarching theme of global warming which causes a rise in the
sea level.
Both low and high intensity development increased due to the
increase in human population during the study period.
The decrease in wetlands in the study area has serious
environmental health implications. For example Graff and
Middleton (2003) reported that wetlands are essential for
fisheries; they also reduce floods and protect surface water by
absorbing heavy metals and organic pollutants. In addition, they
provide habitat for shell fish (prawns, lobsters) and water fowls.
Consequently, there is the need to reverse this trend urgently for
sustainability .
The drastic 15% decline in forestlands may be due to the high
demand for constructions to meet the growing human
population. This trend will negatively impact the environment by
promoting global warming and soil erosion, as well as reducing
biodiversity if not reversed. A bold reforestation program is
suggested for reversing this trend.
More detailed LULC study of 20-30 year trends is suggested for
a more holistic determination of the trends in coastal South
Carolina watersheds in general as well as the impact it could
have on water quality in the future.
The extent of LULC change by class from 1996-2006 is shown
in Fig 3 and summarized in a quantitatively manner in Table 2.
In general, there was a significant net gain in scrubland
There was a net gain of about 12Sq. miles of surface water
cover at the expense of wooden Wetlands (see Table 2).
However, there was a slight increase in emergent wetlands
(EMW) during the 10-year study period.
As forested land decreased, some land became grasslands
which in general explains the increase in the GRS lands
All the counties in the study area experienced an increase in
development (LID/HID) due to increasing population (See
Figure 5).
There was also an increase in Agricultural land use and
population growth (Fig 5); this could result in more pollution of
the surface waters from agricultural inputs such as fertilizers
and pesticides from erosion as well as other human activities in
the area
However there was a significant net loss of Forested lands
which may be due to the land being used for settlement
purposes to meet the changing population
A land class which also had a significant decrease in area was
Woody Wetlands . In general, best estimates indicate that
because of agricultural and developmental impacts, more than
100 sq. miles (see Fig3) of Woody Wetland area has been lost
over the 10 year period.
Recognizing patterns of LULC Change can provide insight for
future urban/Regional planning
http://visual.merriam-webster.com/earth/satellite-remote-sensing.php