
Recommended
Recommended
More Related Content
What's hot
What's hot (20)
Similar to Stream Flow Impact of LU/LC Changes
Similar to Stream Flow Impact of LU/LC Changes (20)
Recently uploaded
Recently uploaded (20)
Stream Flow Impact of LU/LC Changes
- 1. International Journal of Civil, Mechanical and Energy Science, 6(6) Nov-Dec, 2020 | Available: http://ijcmes.com/ ISSN: 2455-5304 https://dx.doi.org/10.22161/ijcmes.66.2 24 Evaluations of Stream Flow Response to Land use and Land Cover Changes in Wabe Watershed, Omo-Gibe Basin, Ethiopia Yonas Mathewos Abose1* , Teshale Ayano Begeno2 1 Department of Hydraulic and Water Resources Engineering, College of Engineering and Technology, Wolkite University, Ethiopia 2 Department of Chemistry, College of Natural and Computational Science, Wolkite University, Ethiopia P.O.Box: 07 Wolkite University, Wolkite, Ethiopia This work was carried out by the contribution of both authors. Author Yonas Mathewos Abose designed the study, collected the data, performed the model and statistical analysis, wrote the protocol and wrote the first draft of the manuscript. Author Teshale Ayano Begeno managed the analyses of the study, interpretation of the data and critical revisions of the manuscript and managed the literature searches. Abstract— Land Use and Land Cover Change (LU/LC) is one of the notable human induced worldwide changes. Hence, understanding the stream flow responses of a watershed to this dynamic change is becoming fundamental for water resources management planning. The study was conducted with the objective to analyses the impact of Land use and Land cover changes on stream flow response of Wabe watershed, in Omo- Gibe basin. Land use and land cover maps were developed using satellite image of Landsat5 TM 1988, Landsat7 ETM+ 2001 and Landsat8 OLI/TIRS 2018 through maximum likelihood algorithm of supervised classification using ERDAS Imagine 2014 and ArcGIS software for satellite image processing and map preparation. A physical based, semi-distributed hydrological model SWAT was used to simulate LU/LC change effects on the stream flow responses of watershed. During the study period the land use and land cover has changed due to natural and anthropogenic activity. The results depicted that there was an incessant expansion of agricultural land, built-up area and forest cover, on the other hand declining of agroforestry; grassland and woodland were happened during from the 1988 to 2018 periods. Due to the occurred LU/LC changes, the mean monthly stream flow were increased by 5.97m3 /s for wet season and similarly the dry season flow showed increasing by 0.96m3 /s during the study periods from 1988 up to 2018. Generally the result indicated that large changes of the stream flow in the watershed. Hence result notified an urgent intervention, so as to regulate the LU/LC change and to reduce its strong impacts on the stream flow of the Wabe watershed. Keywords— Land use/Land covers, stream flow, Wabe watershed, SWAT Model. I. INTRODUCTION Water is an essential natural resource for all forms of life in our biosphere, which has great economic, environmental and social value and is fundamental to the livelihood, welfare of human beings and the earth's ecosystems. A fluctuation in stream flow may possibly have severe consequences for the water demand and supply of both for ecosystems and societies (Cuo, 2016; Lopes et al., 2016). It is widely recognized that land use change is an important factor that affect water resources and freshwater ecosystems (Gashaw et al., 2018; Wakjira et al., 2016; Jemberie et al., 2016; Gwate et al., 2015; Li et al., 2009). Accordingly it is important to understand interactions between hydrological regimes and associated land use and land cover changes in the river catchment (Wagner et al., 2019; Mathewos et al., 2019; Kibria et al., 2016; Boyer, 2004).
- 2. International Journal of Civil, Mechanical and Energy Science, 6(6) Nov-Dec, 2020 | Available: http://ijcmes.com/ ISSN: 2455-5304 https://dx.doi.org/10.22161/ijcmes.66.2 25 In the past decades, water resources shortages have become increasingly severe in many parts of the world, associated with the impacts of natural and anthropogenic activity. And this may be seriously affecting the economic growth of the world. Ethiopia is one of the well-endowed countries in Sub- Saharan Africa in terms of natural resources and appreciated diversity production in the environment. But now; Ethiopia’s natural resources is under considerable pressure due to a rapidly increasing population, development of infrastructures, expanding agricultural activities and increasing deforestation (Kelbessa, 2014). Human based interventions are the main factors affecting water resources availability and distribution for centuries. Land use and land cover (LU/LC) change is one of the human manifested factors and a global challenge because it drives various environmental changes at all spatial and temporal scales Joyce et al., (2017) and these factors affect the quantity and distribution of both surface and ground water resources and the amount of water available for both ecosystem function and human use. As the watershed becomes more developed, it also becomes more hydrological active, changing the flood volume and runoff components as well as the origin of stream flow (Andualem & Gebremariam, 2015). In Ethiopia currently many studies revealed that hydrologic models provide a framework for investigating the influences of land use and land cover change aspects on stream flow (Gashaw et al., 2018; Wakjira et al., 2016; Jemberie et al., 2016; Temesgen et al., 2014; Geremew, 2013). Land use and land cover change occurs in the country Ethiopia, as a whole and in the study area in particular was primarily allied with natural and anthropogenic activity such as proximate and underlying causes and rapidly increasing population, which has almost doubled in the country over the past 40 year (CSA, 2008). Hence, analyzing the potential impacts of these changes at deferent scale was found to be fundamental and thereby different thematic maps of land use change were used to assess the impact of these LU/LC change in the watershed. Previously, information on the regular monitoring watershed quality and stream flow response to land use and land cover changing aspects and their drivers are not available for the Wabe watershed. Therefore, this study were utilized SWAT model on ArcGIS platform to quantify and analyses the stream flow response to land use and land cover changes in Wabe watershed, Omo-gibe basin, Ethiopia and its implication on water resources of the watershed. II. MATERIALS AND METHODS 2.1 Description of the Study Area Wabe watershed is found in the south western and central part of Ethiopia in Omo Gibe River basins. It is situated between 08°10’00” and 08° 30’ 00”N latitudes and 37° 50’ 00” and 38° 20’ 00”E longitudes (see Figure 1). It covers a drainage area of about 1860 km2 . Wabe River (also known as Wabi River or Uabi River) is a west-southwest flowing river of south-central Ethiopia, entirely confined within the reaches of Gurage Zone of the Southern Nations, Nationalities, and Peoples' Region (SNNPR). The mountainous highland divides the Gurage zone into east and west. The mountain chain forms a watershed boundary between the Gibe River sub basin in the West, the Great East African Rift Valley in the East, the Awash River basin in the North, and the Bilate River catchment in the South. The watershed is an area of rich environmental variety, but with increasing levels of environmental pressure in recent years from a rapidly expanding human population. The watershed topography as the entire is characterized by its physical variation. The highest elevation of 3612 m above sea level, accounts for the highest area in the river sub basins and the lowest elevation of 1646 m are found in the watershed and covers slope range from flat 0º to steep 75º separately. Based on the traditional classification system, DEM and contours developed, Wabe watershed laid in a climatic zone between Wurch and Woina-dega. The maximum temperature varies between 20°C to 39°C and the minimum temperature ranges from 0°C to 19°C. Also the data obtained from the Ethiopian Metrological Services Agency between 1988 and 2018 depicted that the long-term mean annual rainfall of the Wabe watershed ranges from 1000mm to 1500mm. The watershed soil is mainly formed from pellic vertisols (55%), chromic luvisols (7.9%), eutric fluvisols (9.41%), calcic fluvisols (13.44%), leptosols (5.59%), calcic xerosols (7.31%), calcaric flubisols (0.97%) and eutric nitisols (0.38%).
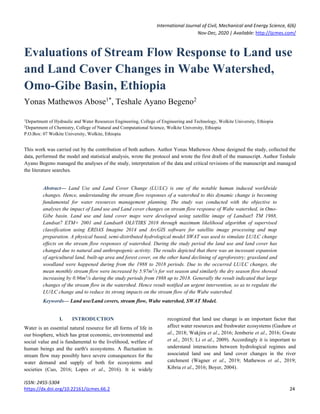
- 3. International Journal of Civil, Mechanical and Energy Science, 6(6) Nov-Dec, 2020 | Available: http://ijcmes.com/ ISSN: 2455-5304 https://dx.doi.org/10.22161/ijcmes.66.2 26 Fig.1: The location map of the study area 2.2 Data Sources and Materials Used In order to ensure reliability and to meet the objectives of this research, different kinds of data were collected from different organizations, fields and satellite imagery. The two important types of data collected were spatial and time series data from both primary and secondary sources. The data from primary sources include spatial data and acquired from the United State Geological Survey (USGS) source (see Table 1) and field data. Secondary data contains time series data such as precipitation, temperature, wind speed, relative humidity, solar radiation and stream flow data was collected from Ethiopian ministry of water, irrigation and energy. Besides different previous research works and different tools such as ERDAS Imagine 14.0 was used for image process techniques, and ArcGIS 10.3 software was implemented for the production land use land cover maps. Dry season images were selected in order to get clear images, not having clouds to facilitate the image classification without difficulty, along years the same cropping season. Additionally, Google Earth, GPS, SWAT model and SWAT-CUP were used as supportive tools. 2.3 Landsat Image Analysis Three years Landsat image data were downloaded from the official website of USGS to detect the change of LU/LC between 1988 to 2018 specifically for (1988, 2001 and 2018) changing periods. In some land use and land cover change studies the researchers used two Landsat images for change analysis (e.g. Karakus, 2019; Kasuni & Kitheka, 2017; L. Zhang et al., 2016) and the other researchers take three Landsat images to study thoroughly a land use and land cover change (Tadele & Foerch, 2007; Gashu & Gebre- Egziabher, 2018). In this study time series data for LU/LC changes created from Landsat images of three periods 1988, 2001 and 2018. To detect the change through time, the whole
- 4. International Journal of Civil, Mechanical and Energy Science, 6(6) Nov-Dec, 2020 | Available: http://ijcmes.com/ ISSN: 2455-5304 https://dx.doi.org/10.22161/ijcmes.66.2 27 31 years period was grouped into two periods (1988-2001 and 2001 -2018) and used 30m spatial resolution imagery. In general, the Wabe watersheds covered by one scene and were downloaded from https://earthexplorer.usgs.gov/ in the path and row shown below (see Table 1). Then the panchromatic bands in the scene were stacked together to produce a multispectral image for each scene. At that time geometric and radiometric corrections and image enhancement were done. Before image classification the above stated preprocess were entirely executed on ERDAS Imagine 14. Table 1: Landsat image description No Reference Year Landsat Sensor Path Row Acquisition date Spatial Resolution (m) 1 1988 Landsat5 TM 169 054 03 December 1988 30*30 2 2001 Landsat7 ETM+ 169 054 14 February 2001 30*30 3 2018 Landsat8 OIL/TIRS 169 054 20 January 2018 30*30 2.4 Image Classification Methods and Processing There are two general methods available used for satellite image classification. These are the supervised and unsupervised classifications. The classifications were conducted using ERDAS Imagine 14 software. The main difference between the two methods is how the classification was executed, in the case of supervised classification the software package carries out the classification based on signature edited or training sites and providing a signature is mandatory to classify the satellite image. On the other hand, the unsupervised classification has no training sites or signature not necessary to classify. After all the layers were stacked together and referenced the satellite image clipped or masking using watershed shape file. For this study, a supervised classification was selected using ERDAS Imagine 14 accompanied by the Google Earth software. After the signature was taken the classification conducted for every class with maximum likelihood classification algorithm at the pixel level and classified class name with their description can be stated as follows. The Six major LU/LC classes identified by using the field data and satellite images of Landsat TM 1988, ETM+ 2001 and OLI/TIRS 2018 includes agriculture land, agroforestry, built-up area, forest, grassland and woodland covers. Agriculture: Made to include areas allotted to rain fed cereal crops (e.g. Corn, Teff, and Wheat), cash crops (chat) and horticultural crops particularly vegetables (e.g. onion, potato and cabbage). Crop cultivation both annuals and perennials, mostly in subsistence farming and the land covered by rural villages and scattered rural settlements. Built-up area: Built up area actually incorporates residential houses, building, small industrial areas and other man-made structures. Forest: Areas that are covered with dense growth of trees with closed canopies. It was made to include human made plantation forest, riverine forests, dry ever green forest and moist mountain forest. Grassland: Both communal and private grazing lands that are used for livestock grazing. The land is basically covered by small grasses, grass like plants and herbaceous species. It also includes land covered with mixture of small grasses, grass like plants and shrubs less than 2m and it is used for grazing. Woodland: The land covered with both open and closed (high) woodland vegetation. It also includes the scattered rural settlements found within the Woodland. 2.5 Accuracy Assessment Accuracy assessment is an important step in the image classification process. The objective of this process is to quantitatively determine how effectively pixels were grouped into the correct feature classes in the area under investigation. In this study, accuracy assessment was done for satellite imagery of Landsat8 OLI/TIRS 2018, for which the ground truth data is likely corresponding. An overall accuracy was calculated by summing the number of pixels classified correctly and dividing by the number of pixels considered. Therefore, an overall classification accuracy of 90.35% with overall kappa statistics of 0.86 was achieved.
- 5. International Journal of Civil, Mechanical and Energy Science, 6(6) Nov-Dec, 2020 | Available: http://ijcmes.com/ ISSN: 2455-5304 https://dx.doi.org/10.22161/ijcmes.66.2 28 2.6 Influences of Land Use and Land Cover Change on Stream Flow Land use change is the key causes that could considerably alter the stream flow availability and this is accredited due to different natural and anthropogenic activities. The impact of LU/LC change on stream flow has been investigated in different parts of the world (Juckem et al., 2008; Tang et al., 2011; Getachew & Melesse, 2012; Andualem & Gebremariam, 2015; Babar & Ramesh, 2015; Gebrekristos, 2015; Jemberie et al., 2016; Leelambar et al., 2018; Gashaw et al., 2018). For example recently, Leelambar et al., (2018) depicted the increase of stream flow due to strongest expansion of urbanization in Noyyal river catchment, India. A study by Juckem et al., (2008) studied a small watershed in Wisconsin and found that the timing of hydrologic change coincided with changes in precipitation while the magnitude of the change in base flow and storm flow was likely increased by changes in agricultural land management. Tang et al. (2011) identified that the effects of land use change on stream flow, sediment yield and nutrient losses from a reservoir basin using distributed hydrological simulation model. The incessant increasing of land under agriculture by 48% in Dedissa sub basin, Abay basin, south western Ethiopia has increased the mean monthly stream flow for wet months by 30.69m3 /s and decreased for dry months (Jemberie et al., 2016). Most recently a study by Gashaw et al., (2018) inferred that the annual stream flow increase from 300.6mm to 304.5mm and to 307.3mm in year 1985, 2000 and 2015 respectively, due to expansion of cultivated land and built-up area, on the other hand the reduction of forest, shrub land and grassland in Andassa watershed, Blue Nile Basin, Ethiopia. Getachew & Melesse, (2012) concluded that the change of forest cover area to agricultural land in Angereb watershed, Ethiopia has amplified the mean wet flow by 39% and decreased the dry average flow by 46% between 1985 and 201l periods. Similarly Andualem & Gebremariam (2015) elucidated that most parts of the grassland and shrub land were changed to cultivated land triggered an increase of stream flow by 5.87m3 /s in between 1986 and 2011 periods in Lake Tana Sub-Basin, Ethiopia.Therefore, such change of land use and land cover may have impact on the stream flow of watershed. The general methodology primarily highlighting on addressing the impact of land use and land cover change on stream flow by using ERDAS imagine 14 and arc SWAT models by changing LU/LC maps of point years while all other SWAT inputs parameters were kept similar. III. RESULTS AND DISCUSSION 3.1 Land Use/ Land Cover Change Analysis Land use and land cover classes categorized from Landsat TM 1988, ETM+ 2001 and OLI-TIRS 2018 contains agricultural land, agroforestry, built-up area, and forest, grassland and woodland cover (Figures 2, 3 and 4). The analysis result depicted agriculture and agroforestry were the dominant LU/LC types in the watershed and jointly accounted 53.92% (100309.42 ha), 63.29% (117728.29 ha) and 67.46% (125497.09 ha) from total watershed area in years 1988, 2001 and 2018 respectively. During the entire study period agriculture, built-up area and forest land had shown expansion and both built-up and forest covered 14.03% (26102.61 ha), 17.18% (31959.72 ha) and 22.30% (41479.83 ha) of the total watershed area (see Table 2). On the other hand, LU/LC analysis from the Landsat imagery of ETM+ and OLI/TIRS showed that the area coverage of grassland accounted 9.31% (17319.87 ha) and 0.77% (1423.62 ha) in 2001 and 2018 respectively and it was promptly decreased as compared to Landsat imagery TM analysis result of 1988. Correspondingly, woodland covered 11.21% (20859.84 ha), 10.22% (19014.12 ha) and 9.47% (17621.46 ha) of the study area and had shown decreasing trend throughout the study period from 1988 up to 2018. Generally, throughout the study period LU/LC change was linked with several proximate and underlying causes. For example, improper agricultural practices, climate variability and change and demand for firewood and construction materials, demographic change, economic activities, poverty, policy and institutional changes. Also the LU/LC change was allied by rural village establishment during the two regimes which made effective around 1987/1988 and the transitional period (1990/1991), resettlement program taken by government and arrival of illegal migrants and local peoples involved in the war. During the transitional period, the new government in power was not capable to manage the country and no one was in charge of protecting the natural resources of the country. Following the end of the war local peoples participating in the war were returned to their environment and subsequently cleared the woodland and to some extent the land under agroforestry to achieve their livelihood needs. Therefore lack of administration coupled with lack of awareness among the local communities about the consequences of conversion of land cover was the reasons behind the LU/LC changes observed in the Wabe watershed. The results of these studies were in agreement
- 6. International Journal of Civil, Mechanical and Energy Science, 6(6) Nov-Dec, 2020 | Available: http://ijcmes.com/ ISSN: 2455-5304 https://dx.doi.org/10.22161/ijcmes.66.2 29 with numerous studies presented in Ethiopia and other parts of the world. For example Garedew (2010), Tefera (2011), Tekleab et al., (2013), Desalegna et al., (2014), Alemu et al. (2015) and Wakjira et al., (2016) who inferred decrease of area under woodland and increase in area under agricultural land. However it is contrary to the work of Alemayehu (2015) who reported expansion of forest land between 1973 and 2015 with corresponding reduction of cultivated land in Fagita Lekoma Woreda, Awi Zone, and Northwestern Ethiopia. Continuous expansion of agriculture in Wabe watershed was primarily related via rapid population growth, gradual change in the economic activities of communities in the area, loss of soil fertility, vilagization and resettlement policies and poverty and food insecurity. Likewise, increases in forest cover area closely allied to socio-economic activities in the watershed and consistent with Alemayehu (2015). There are also a number of case studies on the increase in forest cover in different countries in Europe, Asia, and America. Roland Cochard et al., (2017) inferred the increase in forest cover in Europe and North America was mainly related to economic development. But, increases in forest cover in some Asian countries not extensively depend on economic development level; rather it depends on social and political factors at work in their distinctive national conditions and capacities (for example China, India, Vietnam and South Korea). Moreover the reason of the increased forest cover, might be uncommon outside this study area, was due to the inhabitants started to grow eucalyptus trees on an increasing scale, which has increased the amount of land being covered with trees Woldetsadik and Muluneh, (2004) and the regeneration of previously degraded natural forests, since plantations have reduced the pressure on natural forests by substituting the demand for fuel wood and charcoal were the key and foremost factors manipulating the increase of forest cover, which are designed for sustainable livelihoods and a land recovery strategy in the study area. Table 2: LU/LC types and coverage area in Wabe watershed between 1988 and 2018 LU/LC category 1988 2001 2018 Area (ha) % Area (ha) % Area (ha) % Agriculture 52359.85 28.15 74549.26 40.08 87390.37 46.98 Grassland 38750.13 20.83 17319.87 9.31 1423.62 0.77 Woodland 20859.84 11.21 19014.12 10.22 17621.46 9.47 Built-up area 4978.26 2.68 8111.97 4.36 12983.4 6.98 Forest 21124.35 11.36 23847.75 12.82 28496.43 15.32 Agroforestry 47949.57 25.78 43179.03 23.21 38106.72 20.49
- 7. International Journal of Civil, Mechanical and Energy Science, 6(6) Nov-Dec, 2020 | Available: http://ijcmes.com/ ISSN: 2455-5304 https://dx.doi.org/10.22161/ijcmes.66.2 30 Fig.2: Land use land cover map of Wabe watershed in year 1988 Fig.3: Land use land cover map of Wabe watershed in year 2001
- 8. International Journal of Civil, Mechanical and Energy Science, 6(6) Nov-Dec, 2020 | Available: http://ijcmes.com/ ISSN: 2455-5304 https://dx.doi.org/10.22161/ijcmes.66.2 31 Fig.4: Land use land cover map of Wabe watershed in year 2018 3.2 Land Use/Land Cover trend in Wabe watershed Wabe watershed experienced various LU/LC trends during the study periods. The land covers under agroforestry and woodland declined slightly whereas grassland decreased incessantly between the indicated years. In contrast the area of agricultural land, built-up and forest showed an increasing trend between 1988 up to 2018 (see Figure 5). Fig.5: Wabe watershed LU/LC change trend between 1988 up to 2018 0 10000 20000 30000 40000 50000 60000 70000 80000 90000 100000 1980 1990 2000 2010 2020 Area(ha) Time (years) Agriculture Grassland Woodland Builtup area Forest Agroforestry
- 9. International Journal of Civil, Mechanical and Energy Science, 6(6) Nov-Dec, 2020 | Available: http://ijcmes.com/ ISSN: 2455-5304 https://dx.doi.org/10.22161/ijcmes.66.2 32 3.3 Evaluation of Stream Flow Due to Land Use/ Land Cover Change One of the most important parts of the study was to assess the impact of land use and land cover changes on stream flow of the Wabe watershed. The assessment was done in terms of the impact of land use and land cover changes on the annual and monthly stream flow basis and the differences was assessed at the watershed outlet. The processes might be affected with changing LU/LC and it was done to perceive the stream flow change through incessant evolution of LU/LC change throughout the study period. Simulated average annual stream flow during calibration and validation period for the thematic map of 1988, 2001 and 2018 was presented in Table 3. The result has shown that, increase of stream flow both in calibration and validation period. Table 3: Mean annual stream flow results during calibration and validation period Years 1988 2001 2018 Simulated stream flow variability 1988-20001 2001-2018 1988-2018 Calibration 60.16 60.78 63.26 0.62 2.48 3.10 Validation 62.10 62.73 65.53 0.63 2.80 3.43 The stream flow simulated for the three thematic maps were compared and judgment has been made based on the validation result. Stream flows exhibited a higher increase in the second period (2.80m3 /s) than the former period (0.63m3 /s). Generally, the stream flow has increased with a magnitude of 3.43m3 /s during the study period (1988 to 2018). The result has noticeably indicated augmentation of stream flow associated with a prompt change of LU/LC in the watershed. Mainly the exacerbate increase of agriculture land contributed a lot more (see Table 2) and is in agreement with studies of (Andualem & Gebremariam, 2015). In Figure 6 presented the simulation result of mean monthly stream flow for 1988, 2001 and 2018 land use and land cover map. Fig.6: Mean monthly stream flow results for the three land use and land cover map 0 20 40 60 80 100 120 140 160 Jan Feb Mar Apr May Jun Jul Aug Sep Oct Nov Dec Meanmonthlystreamflow(m3/s) Months Flow_1988 Flow_2001 Flow_2018
- 10. International Journal of Civil, Mechanical and Energy Science, 6(6) Nov-Dec, 2020 | Available: http://ijcmes.com/ ISSN: 2455-5304 https://dx.doi.org/10.22161/ijcmes.66.2 33 The mean monthly stream flow results for the different years were revealed in Figure 6 above. Mean monthly stream flow depicted a higher increase in 2018 land use and land cover as compared to 1988 and 2001. This was accredited due to increase in area under agriculture, built-up and forest cover and decrease of agroforestry and woodland cover area in most parts of the Wabe watershed. As result of expansions in agricultural land rainfall infiltrate in to the soil decrease and concurrently soil moisture shortage more rapidly satisfied under agricultural land than forest thereby producing more runoff in agricultural land and so, more runoff was created in 2001 than 1988’s LU/LC map and hence, stream flow in wet months. On the other hand to other studies, the dry season flow indicate increasing due to substantial increase of forest cover of the watershed along the river channel and less decline of land under agroforestry and woodland during the study period. But, as compared to the wettest seasonal flows the dry season flow is expressively less. Through in rainy months the stream flow was accredited more from surface runoff while in dry months it was contributed more from ground water. Similarly, in 2018 LU/LC stream flow was increased both in wet and dry seasons in consistent with earlier 1988 and 2001 produced stream flows as a result of incessant expansion of the land under agriculture and built- up. Generally, stream flow has increased throughout the study period for over thirty one year’s period (1988 to 2018) with an amplified magnitude. These remarkable alterations of stream flow perceived due to land use and land cover changes of the watershed, as a result of an increase of agricultural land, built-up areas and forest cover in expenses of other land cover such as agroforestry, grass land and woodland throughout the study period. Also seasonal change of stream flows was assessed both on wet (July, August and September) and dry (January, February and March) months and Table 4 presented the wettest and driest mean monthly stream flow for the three prepared land use and land cover maps and their variability throughout the study period below. Table 4: Mean monthly wet and dry season stream flow and their variability Mean monthly stream flow (m3 /s) Years Land use/land cover map Change Detection 1988 2001 2018 2001-1988 2018-2001 2018-1988 Dry period 13.18 13.40 14.14 0.21 0.75 0.96 Wet period 118.22 119.43 124.18 1.21 4.76 5.97 As revealed in Table 4 the seasonal variability of watershed mean monthly stream flow at the outlet were increased by 0.21m3 /s for the first period (1988-2001) and also increased by 0.75m3 /s for the subsequent period (2018-2001) all through the dry season. There were also changes in mean monthly stream flows in the wet period with an increase of stream flow by 1.21m3 /s and 4.76m3 /s for the former and later periods respectively. Generally, for over the thirty one year’s period (1988-2018) mean monthly stream flows has exhibited an increase (+) 5.97m3 /s during the wet season as a result of an increase of agricultural land by 66.25% and built-up areas by 160.80% and decreases of grassland by 96.33% separately and thereby increased surface runoff. These results of explorations were in agreement with several studies. For instance Gashaw et al., (2018) interpreted that, the annual stream flow increase from 300.6mm to 304.5mm and to 307.3mm for 1985, 2000 and 2015 LU/LC respectively, associated with expansion of cultivated land and built-up area and the reduction of forest, shrub land and grassland in Andassa watershed, Blue Nile Basin, Ethiopia. Leelambar et al., (2018) elucidated the amplification of stream flow because of strongest expansion of urbanization in Noyyal river catchment, India. Jemberie et al., (2016) inferred that mean monthly stream flow for wet months increased by 30.69m3 /s and decreased for dry months allied with increasing of agricultural land by 48% in Dedissa sub basin. Geremew, (2013) indicated that, the mean monthly stream flow for wet months had increased with a magnitude values of (+) 16.26 m3 /s while the dry season had decreased by a magnitude value of (-) 5.41 m3 /s for years from 1986 to 2001 associated with land use and land cover change (explicitly due to expansion of agricultural land) in Gilgel– Abbay watershed. Similarly studies conducted in Angereb Watershed, Ethiopia by Getachew & Melesse, (2012) presented that, the mean wet monthly stream flow has increased by 39% and dry mean monthly flow decreased by 46% for 2011 land cover as compared to 1985 LU/LC due to land use/land cover change. Likewise, the significant
- 11. International Journal of Civil, Mechanical and Energy Science, 6(6) Nov-Dec, 2020 | Available: http://ijcmes.com/ ISSN: 2455-5304 https://dx.doi.org/10.22161/ijcmes.66.2 34 decrease of minimum daily flows in the Chemoga watershed during the three driest months (December to February) between the 1960 and 1999 periods was partially explained by changes in LU/LC and degradation of the watershed that involves destruction of natural vegetative covers, expansion of croplands, overgrazing and increased area under eucalyptus plantations (Woldeamlak & Sterk, 2005). Other studies like Rientjes et al (2011) on Upper Gilgel Abbay catchment, Blue Nile basin, for the period 1986-2001 also showed that the annual and the high flows of the catchment were increased by 13% and 46%, respectively while the low flows decreased by 35%. Unlike to other studies, dry season stream flows has depicted slightly an increasing trend for the whole study period with a magnitude of (+) 0.96m3/s, which has reflected due to soil moisture content and lateral flow increased in the watershed; but as compared to wet seasonal flows the dry season flows were found to be smaller associated with intense agricultural expansion ground water flow influence were decreased in dry season. IV. CONCLUSIONS During the study period Wabe watershed has been undergoing different LU/LC changes and main finding of this study depicted an incessant increase in agriculture land, built-up area and forest cover at the expense of agroforestry, grassland and woodland between 1988 and 2018. Mostly, the major LU/LC change observed in the last 31 years from 1988 up to 2018, agriculture land, built-up area and forest cover expanded by 66.90, 160.80 and 34.90% respectively whereas agroforestry, grassland and woodland declined by 20.53, 96.33 and 15.52% separately over the analysis period. The reason is mainly due to the population growth. This might be due to the population pressure has caused a high demand for additional land result absence of agriculture land is the major problem for farmers in the study area. Due to the occurred LU/LC changes, the mean monthly stream flow were increased by 5.97m3 /s for wet season and similarly the dry season flow showed increasing by 0.96m3 /s during the study periods from 1988 up to 2018. Therefore curving the trends of LU/LC towards increasing vegetation covers is very important so as to regulate the LU/LC change and to reduce the seasonal flow and thereby to control the large changes of the flow regime in the Wabe watershed. ACKNOWLEDGEMENT We would like to express our heartfelt gratitude to our parents for their precious guidance, encouragement, endless support and decisive comments extended throughout the research period. Also we would like to acknowledge the National Meteorological Agency of Ethiopia (NMA) and Ethiopian Ministry of Water, Irrigation and Energy for their help by providing the necessary data free of charge. CONFLICT OF INTERESTS The authors have not declared any conflict of interests. REFERENCES [1] Alemayehu, B. (2015). GIS and remote sensing based land use/land cover change detection and prediction in Fagita Lekoma Woreda, Awi Zone, and North Western Ethiopia. MSc. thesis, Addis Ababa University, Ethiopia. [2] Alemu, B., Garedew, E., Eshetu, Z. and Kassa, H. (2015). Land use and land cover changes and associated driving forces in north western lowlands of Ethiopia. International research journal of agricultural science and soil science, 5(1), pp.28-44. [3] Andualem, T.G. and Gebremariam, B. (2015). Impact of land use land cover change on stream flow and sediment yield: a case study of Gilgel Abay watershed, Lake Tana sub-basin, Ethiopia. International Journal of Technology Enhancements and Emerging Engineering Research, 3, pp.28-42. [4] Babar, S. and Ramesh, H. (2015). Streamflow response to land use–land cover change over the Nethravathi River Basin, India. Journal of Hydrologic Engineering, 20(10), p.05015002. [5] Boyer, K. L. and Unsalan, C. (2004). Linearized vegetation indices based on a formal statistical framework. IEEE Transactions on geoscience and remote sensing, 42(7), pp.1575-1585. [6] Central Statistical Agency (2008). Summary and statistical report of the 2007 population and Housing census: population size by age and sex. Addis Ababa: Federal Democratic Republic of Ethiopia Population Census Commission. [7] Cuo, L. (2016). Land use/cover change impacts on hydrology in large river basins: a review. Terrestrial Water Cycle and Climate Change: Natural and Human-Induced Impacts. John Wiley and Sons, Inc, 221, pp.103-134. [8] Desalegn, T., Cruz, F., Kindu, M., Turrión, M.B. and Gonzalo, J. (2014). Land-use/land-cover (LULC) change and socioeconomic conditions of local community in the central highlands of Ethiopia. International Journal of Sustainable Development & World Ecology, 21(5), pp.406-413. [9] Garedew, E. (2010). Land-use and land-cover dynamics and rural livelihood perspectives, in the semi-arid areas of Central Rift Valley of Ethiopia. Doctoral thesis, Swedish University of Agricultural Sciences, Umeå.
- 12. International Journal of Civil, Mechanical and Energy Science, 6(6) Nov-Dec, 2020 | Available: http://ijcmes.com/ ISSN: 2455-5304 https://dx.doi.org/10.22161/ijcmes.66.2 35 [10] Gashaw, T., Tulu, T., Argaw, M., & Worqlul, A. W. (2018). Modeling the hydrological impacts of land use/land cover changes in the Andassa watershed, Blue Nile Basin, Ethiopia. Science of the Total Environment, 619–620 (2018) 1394– 1408. [11] Gashu, K. and Gebre-Egziabher, T. (2018). Spatiotemporal trends of urban land use/land cover and green infrastructure change in two Ethiopian cities: Bahir Dar and Hawassa. Environmental Systems Research, 7(1), p.8. [12] Gebrekristos, S.T. (2015). Understanding Catchment Processes and Hydrological Modelling in the Abay/Upper Blue Nile Basin, Ethiopia. [13] Geremew, A. A. (2013). Assessing the impacts of land use and land cover change on hydrology of watershed: a case study on Gigel-Abbay Watershed, Lake Tana Basin,Ethiopia. Castellon, Spain: Msc thesis. Universitat Jaume I. [14] Getachew, H. E., & Melesse, A. M. (2012). The impact of land use change on the hydrology of the Angereb Watershed, Ethiopia. International Journal of Water Sciences, 1(4), pp.1- 7. [15] Gwate, O., Woyessa, Y. and Wiberg, D. (2015). Dynamics of land cover and impact on stream flow in the Modder River Basin of South Africa: case study of a Quaternary catchment. Int. J. Environ Prot Policy, 3, pp.31-38. [16] Jemberie, M., Gebrie, T. and Gebremariam, B. (2016). Evaluation of land use land cover change on stream flow: a case study of dedissa sub basin, Abay basin, South Western Ethiopia. International Journal of Innovations in Engineering Research and Technology, 3(8),pp.2394–3696. [17] Joyce H. C. Bosmans, L. P. (2017). Hydrological impacts of global land cover change and human water use. Hydrol. Earth System sciences. [18] Juckem, P.F., Hunt, R.J., Anderson, M.P. and Robertson, D.M. (2008). Effects of climate and land management change on stream flow in the driftless area of Wisconsin. Journal of Hydrology, 355(1-4), pp.123-130. [19] Karakuş, C. B. (2019). The impact of land use/land cover (LULC) changes on land surface temperature in Sivas City Center and its surroundings and assessment of Urban Heat Island. Asia-Pacific Journal of Atmospheric Sciences, 55(4), pp.669-684. [20] Kasuni, S.M. and Kitheka, J.U. (2017). Modeling the impacts of land cover changes on stream flow response in Thiba river basin in Kenya. Journal of Water Resources and Ocean Science, 6(1), pp.1-13. [21] Kelbessa, T. S. (2014). Interplay of regeneration, structure and uses of some woody species in Chilimo Forest, Central Ethiopia. Science, Technology and Arts Research Journal, 3(1), pp.90-100. [22] Kibria, K.N., Ahiablame, L., Hay, C. and Djira, G. (2016). Streamflow trends and responses to climate variability and land cover change in South Dakota. journal of Hydrology, 3(1), p.2. [23] L., Zhang, L., Shen, H., Huang, Wu, P. and Zeng, C. (2016). Long-term and fine-scale satellite monitoring of the urban heat island effect by the fusion of multi-temporal and multi- sensor remote sensed data: A 26-year case study of the city of Wuhan in China. Remote Sensing of Environment, 172, pp.109-125. [24] Leelambar, S., Saravanan, S. and Jennifer, J. (2018). Assessing Impact of Land Use/Land Cover Changes on Stream Flow in Noyyal River Catchment Using ArcSWAT Model. In SWAT International Conference Chennai, India (pp. 10-12). [25] Li, Z., Liu, W.Z., Zhang, X.C. and Zheng, F.L. (2009). Impacts of land use change and climate variability on hydrology in an agricultural catchment on the Loess Plateau of China. Journal of hydrology, 377(1-2), pp.35-42. [26] Lopes, P. and Nunes, A.N. (2016). Stream flow Response to Climate Variability and Land‐Cover Changes in the River Beça Watershed, Northern Portugal. River Basin Management, pp.61-80. [27] Mathewos, M., Dananto, M., Erkossa, T. and Mulugeta, G. (2019). Land use land cover dynamics at Bilate Alaba sub- watershed, southern Ethiopia. Journal of Applied Sciences and Environmental Management, 23(8), pp.1521-1528. [28] Rientjes, T.H.M., Haile, A.T., Kebede, E., Mannaerts, C.M.M., Habib, E. and Steenhuis, T.S. (2011). Changes in land cover, rainfall and stream flow in Upper Gilgel Abbay catchment, Blue Nile basin--Ethiopia. Hydrology & Earth System Sciences, 15(6). [29] Roland, C., Ngo, D.T., Waeber, P.O. and Kull, C.A. (2017). Extent and causes of forest cover changes in Vietnam’s provinces 1993–2013: a review and analysis of official data. Environmental reviews, 25(2), pp.199-217. [30] Tadele, K. and Förch, G. (2007). Impact of land use/cover change on stream flow: the case of Hare River Watershed, Ethiopia. In Catchment and lake research, proceedings 2nd Lake Abaya research symposium (LARS), Arba Minch, Ethiopia. [31] Tang, L., Yang, D., Hu, H. and Gao, B. (2011). Detecting the effect of land-use change on streamflow, sediment and nutrient losses by distributed hydrological simulation. Journal of Hydrology, 409(1-2), pp.172-182. [32] Teferi, E., Uhlenbrook, S., Bewket, W., Wenninger, J. and Simane, B. (2010). The use of remote sensing to quantify wetland loss in the Choke Mountain range, Upper Blue Nile basin, Ethiopia. Hydrology and Earth System Sciences Discussions, 7(4), pp.6243-6284. [33] Tekleab, S., Mohamed, Y., Uhlenbrook, S. and Wenninger, J. (2013). Hydrologic responses to land cover change: the case of Jedeb mesoscale catchment, Abay/Upper Blue Nile basin, Ethiopia. Hydrological Processes, 28(20), pp.5149-5161. [34] Temesgen, G., Bantider, A. and Mahari, A. (2014). Evaluations of land use/land cover changes and land degradation in Dera District, Ethiopia: GIS and remote sensing based analysis. International Journal of Scientific Research in Environmental Sciences, 2(6), pp. 199-208. [35] Wagner, P.D., Bhallamudi, S.M., Narasimhan, B., Kumar, S., Fohrer, N. and Fiener, P. (2019). Comparing the effects of dynamic versus static representations of land use change in
- 13. International Journal of Civil, Mechanical and Energy Science, 6(6) Nov-Dec, 2020 | Available: http://ijcmes.com/ ISSN: 2455-5304 https://dx.doi.org/10.22161/ijcmes.66.2 36 hydrologic impact assessments. Environmental Modelling & Software, 122, p.103987. [36] Wakjira, T. and Tamam, D. (2016). The effects of land use land cover change on hydrological process of Gilgel Gibe, Omo Gibe Basin, Ethiopia. International journal of scientific and engineering research, 7(8). [37] Woldeamlak, B., & Sterk, G. (2005). Dynamics in land cover and its effect on streamflow in the Chemoga watershed, Blue Nile basin, Ethiopia. Hydrol. Process, 19, 445–458. [38] Woldetsadik, M. (2004). Impacts of Population Pressure on Land Use/Land Cover Change. Agricultural System and Income Diversification in West Gurageland, Ethiopia [Unpublished thesis]. Trondheim, Norway: Norwegian University of Science and Technology (NTNU).