Download to read offline

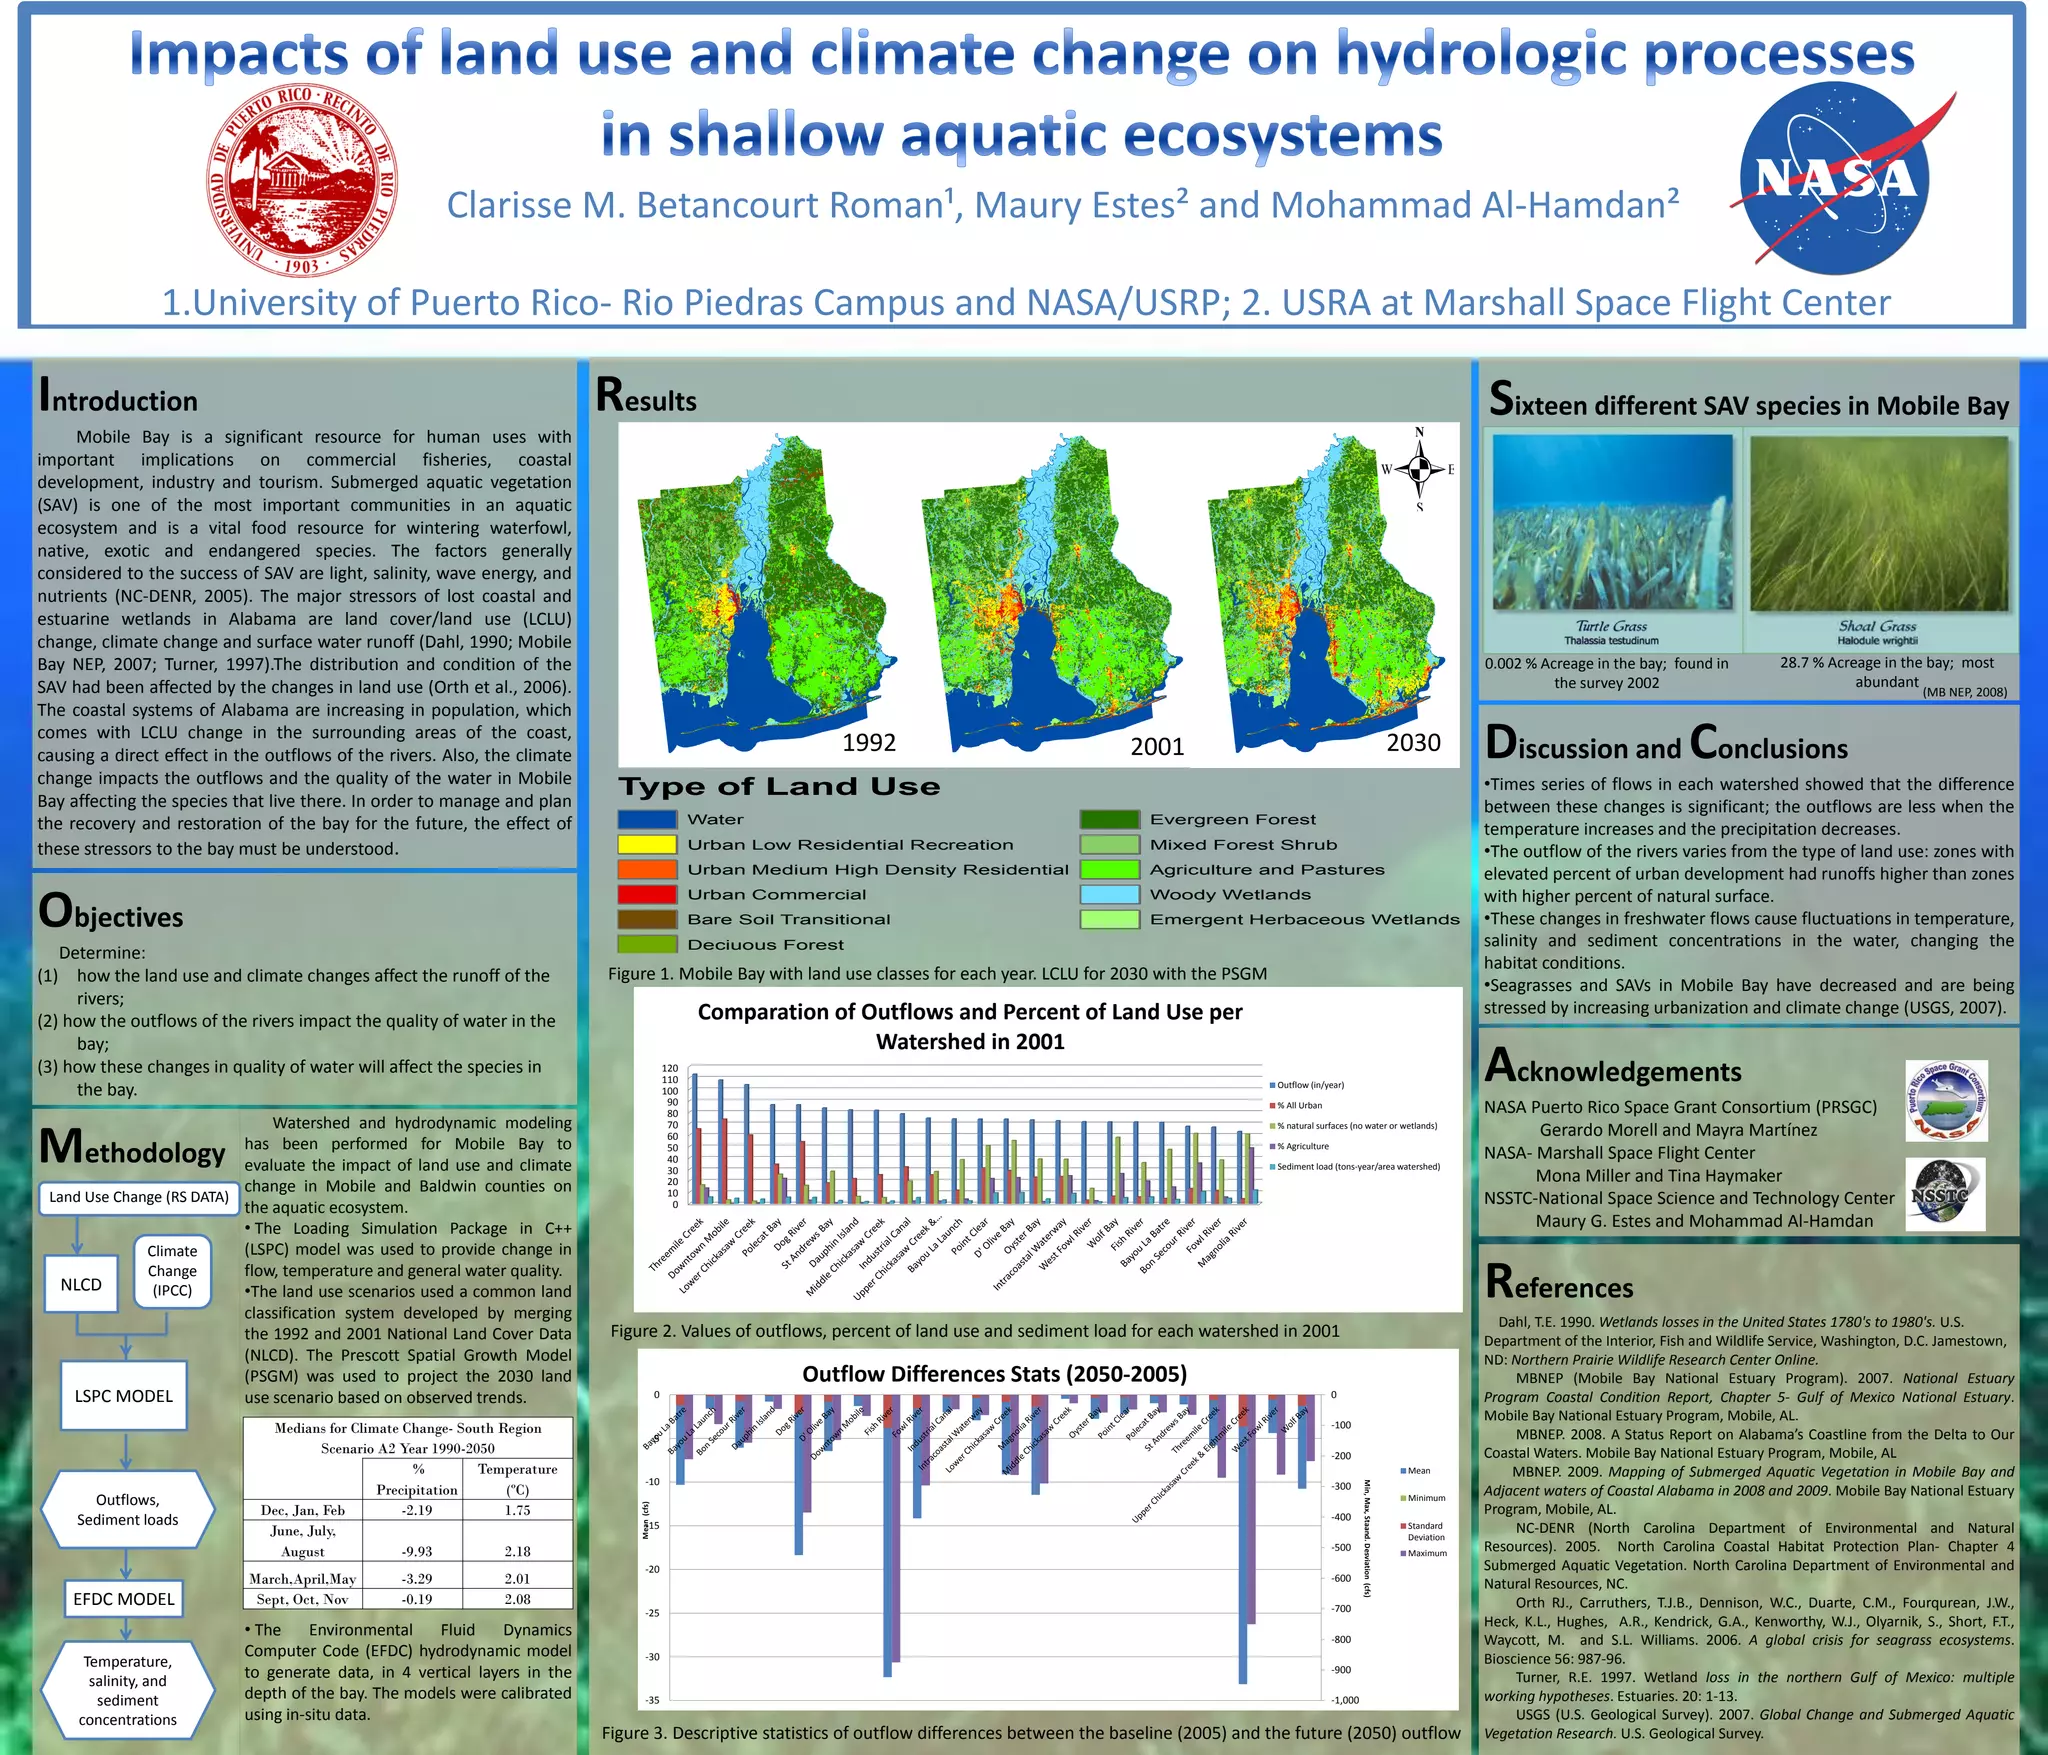

This document summarizes a study on the impacts of land use change and climate change on the aquatic ecosystem of Mobile Bay in Alabama. The study used watershed and hydrodynamic models to analyze how increased urbanization and climate change could affect river outflows, water quality parameters like temperature and salinity, and submerged aquatic vegetation (SAV) in the bay. The models project increased runoff and decreased outflows from watersheds with more urban development compared to natural areas. Climate change is also expected to decrease precipitation and increase temperatures, further impacting outflows. Changes in flows, sediment loads, temperature and salinity could stress SAV communities in Mobile Bay that provide important habitat. The goal is to understand these stressors to