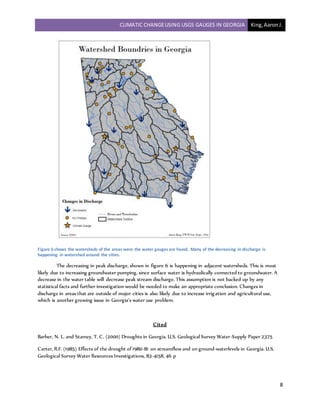
Climate Change
Assessment using USGS
Water Gauges to Judge
Peak Discharge in the
State of Georgia
U n i v e r s i t y o f W i s c o n s i n -
W h i t e w a t e r ; G e o g r a p h y
D e p a r t m e n t
5 / 8 / 2 0 1 4
King, Aaron J
Due to documented climatic change of the past 50 years, USGS
Hydro-Climatic Data Network water gauges in the state of
Georgia were used to test these hypotheses. In addition, multiple
USGS water gauges were used to look at trends of discharge over
the past 50 years.
CLIMATIC CHANGEUSING USGS GAUGES IN GEORGIA King,AaronJ.
1
Introduction
Climatic Change has been reported in the United States and the world over the past 50 years. In order
to investigate these climatic changes, USGS (United States Geological Survey) water gauges were used to record
peak steam discharge in major rivers and water bodies around the United States. Changes in climate indicate that
there should be alternations in precipitation and temperature, which, according to climate change, will change
peak stream discharge over the area. This report analyses peak stream discharge trends in the state of Georgia
over the past 50 years.
Since the early 1900s, the state of Georgia has recorded several droughts and appears to be the victim of
low reoccurrence intervals. This means that Georgia tends to get a large number of bad droughts (Barber and
Stamey, 2000). More recently, the 1980–82 drought resulted in the lowest streamflows since 1954 in most areas,
and the lowest streamflows since 1925 in some areas (Carter, 1983). Since droughts have a severe impact of the
hydrology of this area, with increased climate change, changes in peak stream discharge could lead to more or
longer severe droughts.
Data will be compiled from the “USGS Current Water Data for the Nation” data base, which stores all
water data for the nation. In order for the data to hold any scientific weight for climate change, specific guidelines
were used. Of the national water data, only water gauges with 50 years of consecutive data as well as starting and
ending in the same year. This data will be compared to the USGS Hydro-Climatic Data Network 2009 (HCDN-
2009) gauges. These gauges were chosen specifically by the USGS to be deemed acceptable for recording climate
change. The HCDN-2009 gauges were chosen according to specific guidelines, as outline by USGS Hydro-Climatic
Data Network 2009 fact sheet (http://pubs.usgs.gov/fs/2012/3047/)(Lins, 2012):
1.) Identified as being current “reference” condition according to GAGES-II classification (a data base
that the HCDN-2009 gauges were based from)
2.) Have at least 20 years of complete and continuous data through 2009
3.) Have less than 5% impervious surface as measured by the National Land Cover Data
4.) Were not eliminated during a review by participating State USGS water Science Centers
Methods
Data for peak discharge was downloaded via the USGS website. There, peak stream discharge was
accessed for the entire United States, as shown in fig. 1. In this report, the state of Georgia was selected and
examined. There were 1,265 different water gauge sites located in Georgia. In order to get viable, accurate data,
only gauges that followed specific guidelines were allowed to be used. Each gauge needed:
1.) 50 years of consecutive data
2.) Needed to end in the year 2012
CLIMATIC CHANGEUSING USGS GAUGES IN GEORGIA King,AaronJ.
2
Figure 1 shows all the USGS water gauges in the United States. This report will focus on the state of Georgia. Basemapfrom
USGS website (http://pubs.usgs.gov/fs/2012/3047/)
This ensured that the data that was used was viable to determine climate change. Using the USGS
website, the amount of observations was set to 50, and the end date was set to Dec. 31st, 2012. This limited all
USGS data down to every gauge that had at least 50 years of data or ended on Dec. 31st 2012. After that, these
water gauge data were put into a Microsoft Excel sheet to combine the two, leading to the result of all Georgia
water gauges that had stream discharge data from 1963 to 2012 with no interruptions in the data.
54 separate data sets were retrieved from the USGS database. A collection of stream gauge names are
shown in table 2. To gather the trends of data, the excel sheet was exported into IMB® statistics program SPSS. In
SPSS, the data was devised into two categories, peak stream gauges for the first 25 years (1963-1988), and the
second 25 years (1989-2012). The peak stream discharge of the first group will be compared to the second group
using a Mann-Whitney U statistical test. This test is a non-parametric test used for ordinal, rank data. Any data
that scored a P value < .05 was deemed statistically different, or there was a change in discharge between the two
groups. The group with the higher mean average in this group determined whether or not the change was an
increase or decrease in discharge.
From the USGS HCDN-2009 water gauges data (http://water.usgs.gov/osw/hcdn-2009/), downloaded by
Aaron King of the University of Wisconsin-Whitewater Geography Department on March 13th, 2014, these files
were then then selected and used in the program ArcGIS© by ESRI® whose headquarters are located in Redlands,
California. These files were selected and exported to create a new shapefile depicting all the water gauge data in
Georgia. A table of HCDN-2009 gauges can be seen in table 3. This shapefile now contains all the information for
all the water gauges that contain all the constraints for the USGS Hydro-Climatic Data Network 2009. This data
was used to compare the gauges that contained the 50 years of consecutive data to the HCDN-2009 data that
holds the constraints for determining climate change.
Ecoregions of area are connected to the hydrology of that specific area. To look at trends in changes of
peak discharge, a layer of eco regions will also be used. This data was downloaded via the U.S. Environmental
Protection Agency (EPA) website under Western Ecology Division (WED) on March 13th, 2014 by Aaron King of
the University of Wisconsin-Whitewater Geography Department
(http://www.epa.gov/wed/pages/ecoregions/alga_eco.htm). Here, Level III and Level IV ecoregion data was available
CLIMATIC CHANGEUSING USGS GAUGES IN GEORGIA King,AaronJ.
3
for Georgia. Level IV data is more specific than Level III. For this project, Level IV data will be used in order to
determine trends of discharge. All data is in the NAD1983 UTM Zone 17N project.
Table 2 shows the USGS gauge station number, as well as the latitude and longitude in decimal degrees, and the trend based
on SPSS
Number Latitude Longitude Trend
02177000 32.5282 -84.5705 none
02191300 34.56417 -84.8331 none
02192000 33.99722 -84.2019 none
02197000 34.46639 -85.3361 Decreasing
02198000 30.7041 -83.0332 none
02198500 32.29306 -84.0436 none
02202500 34.05056 -84.2694 none
02203000 30.59549 -83.2596 none
02213000 34.16315 -84.741 none
02213500 32.54461 -82.8946 none
02215500 31.30694 -84.3389 Decreasing
02217500 34.15694 -84.0789 none
02223000 30.70103 -84.8591 Decreasing
02223500 34.29843 -85.138 none
02225500 33.85917 -84.4544 Decreasing
02226000 32.72139 -84.2325 none
02226500 31.23827 -82.3246 none
02227500 32.83861 -83.6206 none
02228000 33.77661 -84.6155 none
02231000 33.24417 -84.4292 Decreasing
02317500 32.88624 -85.1822 none
02319000 33.81944 -84.4078 none
02331600 31.92018 -82.674 none
02333500 34.54072 -83.6228 Decreasing
02334430 32.93349 -81.6512 Decreasing
02335000 34.67509 -84.5085 none
02335700 34.07333 -83.0033 none
02336000 33.52956 -84.9283 none
02336300 32.19159 -81.4159 none
02337000 34.52806 -83.9397 none
02337500 32.52824 -81.2687 none
02339500 34.71667 -84.77 none
02341600 34.81398 -83.306 none
02344500 31.45133 -82.0546 none
02347500 31.59417 -84.1442 Decreasing
CLIMATIC CHANGEUSING USGS GAUGES IN GEORGIA King,AaronJ.
4
02349605 31.38278 -84.5464 none
02349900 32.18491 -81.8887 none
02352500 34.23993 -84.4947 none
02353000 31.22064 -81.8657 Decreasing
02353500 30.35885 -82.0815 none
02358000 32.19556 -83.9022 none
02380500 32.80889 -83.7583 Decreasing
02383500 33.94667 -83.4228 none
02384500 33.37375 -81.9429 none
02385800 33.97417 -82.77 none
02387000 32.07853 -82.1773 none
02387500 34.20037 -85.2566 Decreasing
02388500 34.57711 -84.9419 none
02392000 34.23232 -85.1169 Decreasing
02394000 31.65466 -81.8279 none
02395980 34.82786 -84.8508 none
02397000 34.66675 -84.9283 Decreasing
Table 3 shows all the HCDN-2009 gauges for Georgia.
2177000 CHATTOOGA RIVER NEAR CLAYTON, GA 34.813981 -83.305993
2178400 TALLULAH RIVER NEAR CLAYTON, GA 34.890371 -83.530441
2193340 KETTLE CREEK NEAR WASHINGTON, GA 33.682628 -82.857923
2198100 BEAVERDAM CREEK NEAR SARDIS, GA 32.937658 -81.815392
2202600 BLACK CREEK NEAR BLITCHTON, GA 32.167980 -81.488167
2212600 FALLING CREEK NEAR JULIETTE, GA 33.099854 -83.723510
2215100 TUCSAWHATCHEE CREEK NEAR HAWKINSVILLE, GA 32.239444 -83.501667
2216180 TURNPIKE CREEK NEAR MCRAE, GA 31.991389 -82.921944
2221525 MURDER CREEK BELOW EATONTON, GA 33.252355 -83.481276
2314500 SUWANNEE RIVER AT US 441, AT FARGO, GA 30.680556 -82.560556
2349900 TURKEY CREEK AT BYROMVILLE, GA 32.195556 -83.902222
2350900 KINCHAFOONEE CREEK NEAR DAWSON, GA 31.764444 -84.253333
2381600 FAUSETT CREEK NEAR TALKING ROCK, GA 34.570366 -84.468816
2384540 MILL CREEK NEAR CRANDALL, GA 34.872024 -84.721326
2395120 TWO RUN CREEK NEAR KINGSTON, GA 34.242778 -84.889722
Results
Of the 54 water gauges only two of them matched the HCDN-2009 standards. The USGS stations were
02177000 and 02349900, as indicated by star on figure 3. All other stations are indicated as arrows showing
changes in discharge or circles. Of the 54 gauge stations, 13 gauges indicated that there was a statistically
difference in peak stream discharge over the past 50 years. Of the 13 gauges that showed a difference in
discharge, all of them showed a “Decrease” in discharge. Any decreasing in indicated by a blue color, whereas
orange indicates no change. Figure 3 shows that there is a trend of decreasing stream peak discharge, but there is
no change in discharge on the two HCDN-2009 stations that would indicate climate change.
CLIMATIC CHANGEUSING USGS GAUGES IN GEORGIA King,AaronJ.
5
Figure 4 shows the water gauges on top of the various ecoregions in the state of Georgia. What this
maps shows is that every region is showing a trend of decreasing stream discharge across the entire state. No
one particular ecoregion appears to be causing any form of change in peak discharge.
Figure 3 shows all the stations that fit the 50 years of consecutive data for this report. The stars indicate HCDN-2009 stations.
CLIMATIC CHANGEUSING USGS GAUGES IN GEORGIA King,AaronJ.
6
Figure 4 shows water gauges over a layerof ecoregions. This shows a general decreasing in discharge across the state of
Georgia.
Discussion
When looking at the trends and patterns of stream discharge, there is an obvious trend is decreasing
peak discharge across the state of Georgia. When using SPSS, every single change in discharge was a decrease.
However, the project was to look at climate change. Only two of the 54 water gauges that had 50 years of
consecutive data also met the HCDN-2009 standards. Neither of these two gauges indicated a change in
decreasing peak discharge. So according to this report, climate change is not having an effect on water hydrology
and peak discharge. However, the overall trend of the state of Georgia is a decrease in peak discharge. So even
though there is no change in the climate change stations, there is an overall drop in discharge and changes in the
hydrology of the state of Georgia. Ecoregions appeared to not have any effect of the discharge. Across the state,
every ecoregion showed a decrease in discharge.
One of the reasons that the HCDN-2009 stations differ so drastically is that the HCDN-2009 gauges only
account for 20 years of consecutive data. It was decided that 20 years is not enough time to determine climate
change, due to the nature of slow changes over long periods of time. So the standard that was used in this report
CLIMATIC CHANGEUSING USGS GAUGES IN GEORGIA King,AaronJ.
7
was 50 consecutive years. When looking at the USGS website, many stations came close to 50 years but did not
make it. Another reason is that many stations had 50 years of data but were interrupted and missing some years
in-between 1963 and 2012.
As stated before, possible reasons for a decrease in peak stream discharge across the state could have to
deal with increased droughts. The statistical approach that was used took the first 25 years of records against the
second 25 years of record. Looking at the history of Georgia, an increase in droughts and population increase
which leads to more groundwater drainage may have altered these levels. From 1985 through 1989 recorded some
of the worst droughts since the mid-50s and reached a flood reoccurrence interval of 50-100 years (Barber and
Stamey (2000). This, along with heavy population increase, led to more groundwater drilling. According to the
United States National Atlas, the state of Georgia increase by 1,708,237 people between the year 1990 and 2000,
making it the fastest growing state, upping the population by 26%. Figure 5 shows the peak water discharges
over an image of Georgia’s most populated cities.
Figure 5 shows a true color image of Georgia featuring the most populated cities.
Figure 5 shows that the decreasing areas are happening around the cities. This most likely is the due to
groundwater pumping to help supply these cities with big populations, like Atlanta with water. To help better
understand this, a map of watersheds of Georgia, shown in figure 6, shows that the watersheds of around the city
are the subject to the most dropping in peak discharge.
CLIMATIC CHANGEUSING USGS GAUGES IN GEORGIA King,AaronJ.
8
Figure 6 shows the watersheds of the areas were the water gauges are found. Many of the decreasing in discharge is
happening in watershed around the cities.
The decreasing in peak discharge, shown in figure 6 is happening in adjacent watersheds. This is most
likely due to increasing groundwater pumping, since surface water is hydraulically connected to groundwater. A
decrease in the water table will decrease peak stream discharge. This assumption is not backed up by any
statistical facts and further investigation would be needed to make an appropriate conclusion. Changes in
discharge in areas that are outside of major cities is also likely due to increase irrigation and agricultural use,
which is another growing issue in Georgia’s water use problem.
Cited
Barber, N. L. and Stamey, T. C. (2000) Droughts in Georgia. U.S. Geological Survey Water-Supply Paper 2375
Carter, R.F. (1985) Effects of the drought of 1980-81 on streamflow and on ground-waterlevels in Georgia. U.S.
Geological Survey Water Resources Investigations, 83-4158, 46 p
CLIMATIC CHANGEUSING USGS GAUGES IN GEORGIA King,AaronJ.
9
Lins, H. F. (2012) USGS Hydro-Climatic Data Network 2009 (HCDN-2009). U.S. Geological Survey Fact Sheet
2047.

Watergauges

  • 1.
    Climate Change Assessment usingUSGS Water Gauges to Judge Peak Discharge in the State of Georgia U n i v e r s i t y o f W i s c o n s i n - W h i t e w a t e r ; G e o g r a p h y D e p a r t m e n t 5 / 8 / 2 0 1 4 King, Aaron J Due to documented climatic change of the past 50 years, USGS Hydro-Climatic Data Network water gauges in the state of Georgia were used to test these hypotheses. In addition, multiple USGS water gauges were used to look at trends of discharge over the past 50 years.
  • 2.
    CLIMATIC CHANGEUSING USGSGAUGES IN GEORGIA King,AaronJ. 1 Introduction Climatic Change has been reported in the United States and the world over the past 50 years. In order to investigate these climatic changes, USGS (United States Geological Survey) water gauges were used to record peak steam discharge in major rivers and water bodies around the United States. Changes in climate indicate that there should be alternations in precipitation and temperature, which, according to climate change, will change peak stream discharge over the area. This report analyses peak stream discharge trends in the state of Georgia over the past 50 years. Since the early 1900s, the state of Georgia has recorded several droughts and appears to be the victim of low reoccurrence intervals. This means that Georgia tends to get a large number of bad droughts (Barber and Stamey, 2000). More recently, the 1980–82 drought resulted in the lowest streamflows since 1954 in most areas, and the lowest streamflows since 1925 in some areas (Carter, 1983). Since droughts have a severe impact of the hydrology of this area, with increased climate change, changes in peak stream discharge could lead to more or longer severe droughts. Data will be compiled from the “USGS Current Water Data for the Nation” data base, which stores all water data for the nation. In order for the data to hold any scientific weight for climate change, specific guidelines were used. Of the national water data, only water gauges with 50 years of consecutive data as well as starting and ending in the same year. This data will be compared to the USGS Hydro-Climatic Data Network 2009 (HCDN- 2009) gauges. These gauges were chosen specifically by the USGS to be deemed acceptable for recording climate change. The HCDN-2009 gauges were chosen according to specific guidelines, as outline by USGS Hydro-Climatic Data Network 2009 fact sheet (http://pubs.usgs.gov/fs/2012/3047/)(Lins, 2012): 1.) Identified as being current “reference” condition according to GAGES-II classification (a data base that the HCDN-2009 gauges were based from) 2.) Have at least 20 years of complete and continuous data through 2009 3.) Have less than 5% impervious surface as measured by the National Land Cover Data 4.) Were not eliminated during a review by participating State USGS water Science Centers Methods Data for peak discharge was downloaded via the USGS website. There, peak stream discharge was accessed for the entire United States, as shown in fig. 1. In this report, the state of Georgia was selected and examined. There were 1,265 different water gauge sites located in Georgia. In order to get viable, accurate data, only gauges that followed specific guidelines were allowed to be used. Each gauge needed: 1.) 50 years of consecutive data 2.) Needed to end in the year 2012
  • 3.
    CLIMATIC CHANGEUSING USGSGAUGES IN GEORGIA King,AaronJ. 2 Figure 1 shows all the USGS water gauges in the United States. This report will focus on the state of Georgia. Basemapfrom USGS website (http://pubs.usgs.gov/fs/2012/3047/) This ensured that the data that was used was viable to determine climate change. Using the USGS website, the amount of observations was set to 50, and the end date was set to Dec. 31st, 2012. This limited all USGS data down to every gauge that had at least 50 years of data or ended on Dec. 31st 2012. After that, these water gauge data were put into a Microsoft Excel sheet to combine the two, leading to the result of all Georgia water gauges that had stream discharge data from 1963 to 2012 with no interruptions in the data. 54 separate data sets were retrieved from the USGS database. A collection of stream gauge names are shown in table 2. To gather the trends of data, the excel sheet was exported into IMB® statistics program SPSS. In SPSS, the data was devised into two categories, peak stream gauges for the first 25 years (1963-1988), and the second 25 years (1989-2012). The peak stream discharge of the first group will be compared to the second group using a Mann-Whitney U statistical test. This test is a non-parametric test used for ordinal, rank data. Any data that scored a P value < .05 was deemed statistically different, or there was a change in discharge between the two groups. The group with the higher mean average in this group determined whether or not the change was an increase or decrease in discharge. From the USGS HCDN-2009 water gauges data (http://water.usgs.gov/osw/hcdn-2009/), downloaded by Aaron King of the University of Wisconsin-Whitewater Geography Department on March 13th, 2014, these files were then then selected and used in the program ArcGIS© by ESRI® whose headquarters are located in Redlands, California. These files were selected and exported to create a new shapefile depicting all the water gauge data in Georgia. A table of HCDN-2009 gauges can be seen in table 3. This shapefile now contains all the information for all the water gauges that contain all the constraints for the USGS Hydro-Climatic Data Network 2009. This data was used to compare the gauges that contained the 50 years of consecutive data to the HCDN-2009 data that holds the constraints for determining climate change. Ecoregions of area are connected to the hydrology of that specific area. To look at trends in changes of peak discharge, a layer of eco regions will also be used. This data was downloaded via the U.S. Environmental Protection Agency (EPA) website under Western Ecology Division (WED) on March 13th, 2014 by Aaron King of the University of Wisconsin-Whitewater Geography Department (http://www.epa.gov/wed/pages/ecoregions/alga_eco.htm). Here, Level III and Level IV ecoregion data was available
  • 4.
    CLIMATIC CHANGEUSING USGSGAUGES IN GEORGIA King,AaronJ. 3 for Georgia. Level IV data is more specific than Level III. For this project, Level IV data will be used in order to determine trends of discharge. All data is in the NAD1983 UTM Zone 17N project. Table 2 shows the USGS gauge station number, as well as the latitude and longitude in decimal degrees, and the trend based on SPSS Number Latitude Longitude Trend 02177000 32.5282 -84.5705 none 02191300 34.56417 -84.8331 none 02192000 33.99722 -84.2019 none 02197000 34.46639 -85.3361 Decreasing 02198000 30.7041 -83.0332 none 02198500 32.29306 -84.0436 none 02202500 34.05056 -84.2694 none 02203000 30.59549 -83.2596 none 02213000 34.16315 -84.741 none 02213500 32.54461 -82.8946 none 02215500 31.30694 -84.3389 Decreasing 02217500 34.15694 -84.0789 none 02223000 30.70103 -84.8591 Decreasing 02223500 34.29843 -85.138 none 02225500 33.85917 -84.4544 Decreasing 02226000 32.72139 -84.2325 none 02226500 31.23827 -82.3246 none 02227500 32.83861 -83.6206 none 02228000 33.77661 -84.6155 none 02231000 33.24417 -84.4292 Decreasing 02317500 32.88624 -85.1822 none 02319000 33.81944 -84.4078 none 02331600 31.92018 -82.674 none 02333500 34.54072 -83.6228 Decreasing 02334430 32.93349 -81.6512 Decreasing 02335000 34.67509 -84.5085 none 02335700 34.07333 -83.0033 none 02336000 33.52956 -84.9283 none 02336300 32.19159 -81.4159 none 02337000 34.52806 -83.9397 none 02337500 32.52824 -81.2687 none 02339500 34.71667 -84.77 none 02341600 34.81398 -83.306 none 02344500 31.45133 -82.0546 none 02347500 31.59417 -84.1442 Decreasing
  • 5.
    CLIMATIC CHANGEUSING USGSGAUGES IN GEORGIA King,AaronJ. 4 02349605 31.38278 -84.5464 none 02349900 32.18491 -81.8887 none 02352500 34.23993 -84.4947 none 02353000 31.22064 -81.8657 Decreasing 02353500 30.35885 -82.0815 none 02358000 32.19556 -83.9022 none 02380500 32.80889 -83.7583 Decreasing 02383500 33.94667 -83.4228 none 02384500 33.37375 -81.9429 none 02385800 33.97417 -82.77 none 02387000 32.07853 -82.1773 none 02387500 34.20037 -85.2566 Decreasing 02388500 34.57711 -84.9419 none 02392000 34.23232 -85.1169 Decreasing 02394000 31.65466 -81.8279 none 02395980 34.82786 -84.8508 none 02397000 34.66675 -84.9283 Decreasing Table 3 shows all the HCDN-2009 gauges for Georgia. 2177000 CHATTOOGA RIVER NEAR CLAYTON, GA 34.813981 -83.305993 2178400 TALLULAH RIVER NEAR CLAYTON, GA 34.890371 -83.530441 2193340 KETTLE CREEK NEAR WASHINGTON, GA 33.682628 -82.857923 2198100 BEAVERDAM CREEK NEAR SARDIS, GA 32.937658 -81.815392 2202600 BLACK CREEK NEAR BLITCHTON, GA 32.167980 -81.488167 2212600 FALLING CREEK NEAR JULIETTE, GA 33.099854 -83.723510 2215100 TUCSAWHATCHEE CREEK NEAR HAWKINSVILLE, GA 32.239444 -83.501667 2216180 TURNPIKE CREEK NEAR MCRAE, GA 31.991389 -82.921944 2221525 MURDER CREEK BELOW EATONTON, GA 33.252355 -83.481276 2314500 SUWANNEE RIVER AT US 441, AT FARGO, GA 30.680556 -82.560556 2349900 TURKEY CREEK AT BYROMVILLE, GA 32.195556 -83.902222 2350900 KINCHAFOONEE CREEK NEAR DAWSON, GA 31.764444 -84.253333 2381600 FAUSETT CREEK NEAR TALKING ROCK, GA 34.570366 -84.468816 2384540 MILL CREEK NEAR CRANDALL, GA 34.872024 -84.721326 2395120 TWO RUN CREEK NEAR KINGSTON, GA 34.242778 -84.889722 Results Of the 54 water gauges only two of them matched the HCDN-2009 standards. The USGS stations were 02177000 and 02349900, as indicated by star on figure 3. All other stations are indicated as arrows showing changes in discharge or circles. Of the 54 gauge stations, 13 gauges indicated that there was a statistically difference in peak stream discharge over the past 50 years. Of the 13 gauges that showed a difference in discharge, all of them showed a “Decrease” in discharge. Any decreasing in indicated by a blue color, whereas orange indicates no change. Figure 3 shows that there is a trend of decreasing stream peak discharge, but there is no change in discharge on the two HCDN-2009 stations that would indicate climate change.
  • 6.
    CLIMATIC CHANGEUSING USGSGAUGES IN GEORGIA King,AaronJ. 5 Figure 4 shows the water gauges on top of the various ecoregions in the state of Georgia. What this maps shows is that every region is showing a trend of decreasing stream discharge across the entire state. No one particular ecoregion appears to be causing any form of change in peak discharge. Figure 3 shows all the stations that fit the 50 years of consecutive data for this report. The stars indicate HCDN-2009 stations.
  • 7.
    CLIMATIC CHANGEUSING USGSGAUGES IN GEORGIA King,AaronJ. 6 Figure 4 shows water gauges over a layerof ecoregions. This shows a general decreasing in discharge across the state of Georgia. Discussion When looking at the trends and patterns of stream discharge, there is an obvious trend is decreasing peak discharge across the state of Georgia. When using SPSS, every single change in discharge was a decrease. However, the project was to look at climate change. Only two of the 54 water gauges that had 50 years of consecutive data also met the HCDN-2009 standards. Neither of these two gauges indicated a change in decreasing peak discharge. So according to this report, climate change is not having an effect on water hydrology and peak discharge. However, the overall trend of the state of Georgia is a decrease in peak discharge. So even though there is no change in the climate change stations, there is an overall drop in discharge and changes in the hydrology of the state of Georgia. Ecoregions appeared to not have any effect of the discharge. Across the state, every ecoregion showed a decrease in discharge. One of the reasons that the HCDN-2009 stations differ so drastically is that the HCDN-2009 gauges only account for 20 years of consecutive data. It was decided that 20 years is not enough time to determine climate change, due to the nature of slow changes over long periods of time. So the standard that was used in this report
  • 8.
    CLIMATIC CHANGEUSING USGSGAUGES IN GEORGIA King,AaronJ. 7 was 50 consecutive years. When looking at the USGS website, many stations came close to 50 years but did not make it. Another reason is that many stations had 50 years of data but were interrupted and missing some years in-between 1963 and 2012. As stated before, possible reasons for a decrease in peak stream discharge across the state could have to deal with increased droughts. The statistical approach that was used took the first 25 years of records against the second 25 years of record. Looking at the history of Georgia, an increase in droughts and population increase which leads to more groundwater drainage may have altered these levels. From 1985 through 1989 recorded some of the worst droughts since the mid-50s and reached a flood reoccurrence interval of 50-100 years (Barber and Stamey (2000). This, along with heavy population increase, led to more groundwater drilling. According to the United States National Atlas, the state of Georgia increase by 1,708,237 people between the year 1990 and 2000, making it the fastest growing state, upping the population by 26%. Figure 5 shows the peak water discharges over an image of Georgia’s most populated cities. Figure 5 shows a true color image of Georgia featuring the most populated cities. Figure 5 shows that the decreasing areas are happening around the cities. This most likely is the due to groundwater pumping to help supply these cities with big populations, like Atlanta with water. To help better understand this, a map of watersheds of Georgia, shown in figure 6, shows that the watersheds of around the city are the subject to the most dropping in peak discharge.
  • 9.
    CLIMATIC CHANGEUSING USGSGAUGES IN GEORGIA King,AaronJ. 8 Figure 6 shows the watersheds of the areas were the water gauges are found. Many of the decreasing in discharge is happening in watershed around the cities. The decreasing in peak discharge, shown in figure 6 is happening in adjacent watersheds. This is most likely due to increasing groundwater pumping, since surface water is hydraulically connected to groundwater. A decrease in the water table will decrease peak stream discharge. This assumption is not backed up by any statistical facts and further investigation would be needed to make an appropriate conclusion. Changes in discharge in areas that are outside of major cities is also likely due to increase irrigation and agricultural use, which is another growing issue in Georgia’s water use problem. Cited Barber, N. L. and Stamey, T. C. (2000) Droughts in Georgia. U.S. Geological Survey Water-Supply Paper 2375 Carter, R.F. (1985) Effects of the drought of 1980-81 on streamflow and on ground-waterlevels in Georgia. U.S. Geological Survey Water Resources Investigations, 83-4158, 46 p
  • 10.
    CLIMATIC CHANGEUSING USGSGAUGES IN GEORGIA King,AaronJ. 9 Lins, H. F. (2012) USGS Hydro-Climatic Data Network 2009 (HCDN-2009). U.S. Geological Survey Fact Sheet 2047.