Earthquakes, Geology Lesson PowerPoint, Faults, Folds, Seismograph and more

This PowerPoint is one small part of the Geology Topics unit from www.sciencepowerpoint.com. This unit consists of a five part 6000+ slide PowerPoint roadmap, 14 page bundled homework package, modified homework, detailed answer keys, 12 pages of unit notes for students who may require assistance, follow along worksheets, and many review games. The homework and lesson notes chronologically follow the PowerPoint slideshow. The answer keys and unit notes are great for support professionals. The activities and discussion questions in the slideshow are meaningful. The PowerPoint includes built-in instructions, visuals, and review questions. Also included are critical class notes (color coded red), project ideas, video links, and review games. This unit also includes four PowerPoint review games (110+ slides each with Answers), 38+ video links, lab handouts, activity sheets, rubrics, materials list, templates, guides, 6 PowerPoint review Game, and much more. Also included is a 190 slide first day of school PowerPoint presentation. Areas of Focus within The Geology Topics Unit: -Plate Tectonics, Evidence for Plate Tectonics, Pangea, Energy Waves, Layers of the Earth, Heat Transfer, Types of Crust, Plate Boundaries, Hot Spots, Volcanoes, Positives and Negatives of Volcanoes, Types of Volcanoes, Parts of a Volcano, Magma, Types of Lava, Viscosity, Earthquakes, Faults, Folds, Seismograph, Richter Scale, Seismograph, Tsunami's, Rocks, Minerals, Crystals, Uses of Minerals, Types of Crystals, Physical Properties of Minerals, Rock Cycle, Common Igneous Rocks, Common Sedimentary Rocks, Common Metamorphic Rocks. This unit aligns with the Next Generation Science Standards and with Common Core Standards for ELA and Literacy for Science and Technical Subjects. See preview for more information If you have any questions please feel free to contact me. Thanks again and best wishes. Sincerely, Ryan Murphy M.Ed www.sciencepowerpoint@gmail.com

Recommended
More Related Content
Viewers also liked
More from www.sciencepowerpoint.com
More from www.sciencepowerpoint.com (20)
Recently uploaded
Recently uploaded (20)
Earthquakes, Geology Lesson PowerPoint, Faults, Folds, Seismograph and more
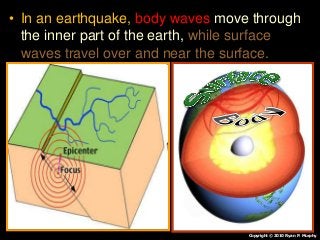
- 1. • In an earthquake, body waves move through the inner part of the earth, while surface waves travel over and near the surface. Copyright © 2010 Ryan P. Murphy
- 3. • RED SLIDE: These are notes that are very important and should be recorded in your science journal. Copyright © 2010 Ryan P. Murphy
- 4. -Nice neat notes that are legible and use indentations when appropriate. -Example of indent. -Skip a line between topics -Don’t skip pages -Make visuals clear and well drawn.
- 5. • RED SLIDE: These are notes that are very important and should be recorded in your science journal. • BLACK SLIDE: Pay attention, follow directions, complete projects as described and answer required questions neatly. Copyright © 2010 Ryan P. Murphy
- 15. • Earthquakes available sheet that follows slideshow for class work.
- 16. New Area of Focus: Faults and Folds. Copyright © 2010 Ryan P. Murphy
- 17. Movement of tectonic plates against each other cause the plates to fault and fold. Copyright © 2010 Ryan P. Murphy
- 18. • Deformation: When a rock gets bent, twisted, or breaks.
- 19. • Deformation: When a rock gets bent, twisted, or breaks.
- 20. • Deformation: When a rock gets bent, twisted, or breaks.
- 21. • Deformation: When a rock gets bent, twisted, or breaks.
- 22. Orogeny: The formation of mountain ranges by intense upward displacement of the earth's crust. -
- 23. Orogeny: The formation of mountain ranges by intense upward displacement of the earth's crust. Usually associated with folding, thrust faulting, and other compressional processes.
- 24. Orogeny: The formation of mountain ranges by intense upward displacement of the earth's crust. Usually associated with folding, thrust faulting, and other compressional processes.
- 25. Movement of tectonic plates against each other cause the plates to fault and fold. Copyright © 2010 Ryan P. Murphy
- 26. Movement of tectonic plates against each other cause the plates to fault and fold. Copyright © 2010 Ryan P. Murphy
- 27. Movement of tectonic plates against each other cause the plates to fault and fold. Copyright © 2010 Ryan P. Murphy
- 28. Movement of tectonic plates against each other cause the plates to fault and fold. Copyright © 2010 Ryan P. Murphy
- 29. Movement of tectonic plates against each other cause the plates to fault and fold. Copyright © 2010 Ryan P. Murphy
- 30. Movement of tectonic plates against each other cause the plates to fault and fold. Copyright © 2010 Ryan P. Murphy
- 31. Movement of tectonic plates against each other cause the plates to fault and fold. Copyright © 2010 Ryan P. Murphy
- 32. Stress on a rock can be… -
- 33. Stress on a rock can be… Compression
- 34. Stress on a rock can be… Compression
- 35. Stress on a rock can be… Compression Tension
- 36. Stress on a rock can be… Compression Tension
- 37. Stress on a rock can be… Compression Tension
- 38. • Activity! Learning about tension with gum. – Chew a piece of gum for a bit. – Slowly stretch gum apart with your hands. – Draw picture in journal. Copyright © 2010 Ryan P. Murphy
- 39. Stress on a rock can be… Compression Tension
- 40. Stress on a rock can be… Compression Tension Shearing
- 41. Stress on a rock can be… Compression Tension Shearing
- 42. Stress on a rock can be… Compression Tension Shearing
- 43. • Activity! Learning about shearing with gum. – Get a fresh piece of gum. – Slowly stretch stick of gum in opposite directions until it shears. – Draw picture in journal. Copyright © 2010 Ryan P. Murphy
- 44. Stress on a rock can be… Compression Tension Shearing
- 45. Stress on a rock can be… Compression Tension Shearing Confining / Uniform
- 46. Stress on a rock can be… Compression Tension Shearing Confining / Uniform
- 47. • Activity! Learning about shearing with gum. – Get a fresh piece of gum. – Use your hands to squish the gum into a ball. Try and make your pressure uniform in all directions. Draw picture in journal. Copyright © 2010 Ryan P. Murphy
- 48. • Quiz Wiz! Stand and stress.
- 49. • Quiz Wiz! Stand and stress.
- 50. • Quiz Wiz! Stand and stress.
- 51. • Quiz Wiz! Stand and stress.
- 52. • Quiz Wiz! Stand and stress.
- 53. • Quiz Wiz! Stand and stress.
- 54. • Quiz Wiz! Stand and stress.
- 55. • Quiz Wiz! Stand and stress.
- 56. • Quiz Wiz! Practice.
- 57. • Quiz Wiz! Practice.
- 58. • Quiz Wiz! Practice.
- 59. • Quiz Wiz! Practice.
- 60. • Quiz Wiz! Practice.
- 61. • Quiz Wiz! Practice.
- 62. • Quiz Wiz! Practice.
- 63. • Quiz Wiz! Practice.
- 64. • Quiz Wiz! Practice.
- 65. • Quiz Wiz! Practice.
- 98. • Bonus: Can anyone name this movie?
- 99. • Bonus: Can anyone name this movie?
- 100. • Rocks can bend, twist, and fracture.
- 101. • Rocks can bend, twist, and fracture.
- 102. Fault: Break / crack where movement occurs. Copyright © 2010 Ryan P. Murphy
- 103. Fault: Break / crack where movement occurs. Copyright © 2010 Ryan P. Murphy
- 104. Fault: Break / crack where movement occurs. Copyright © 2010 Ryan P. Murphy
- 105. Fault: Break / crack where movement occurs. Copyright © 2010 Ryan P. Murphy
- 106. Fault: Break / crack where movement occurs. Copyright © 2010 Ryan P. Murphy
- 107. Fault: Break / crack where movement occurs. Copyright © 2010 Ryan P. Murphy
- 108. Fault: Break / crack where movement occurs. Copyright © 2010 Ryan P. Murphy
- 109. Fault: Break / crack where movement occurs. Copyright © 2010 Ryan P. Murphy
- 110. Fault: Break / crack where movement occurs. Copyright © 2010 Ryan P. Murphy
- 111. Fault: Break / crack where movement occurs. Copyright © 2010 Ryan P. Murphy
- 117. How large is this Fault?
- 118. How large is this Fault?
- 119. How large is this Fault? Small!
- 120. How large is this Fault? Small! Geologist provide a size reference when they photograph.
- 121. • Picture of fault on the planet Mercury.
- 122. • Picture of fault on the planet Mercury.
- 131. Which big idea do faults and folds deal with the most?
- 132. It may appear that rocks are standing still. They are However moving on a very dynamic planet.
- 133. It may appear that rocks are standing still. They are However moving on a very dynamic planet.
- 135. • Activity! Learning about a fault. – Each student should be given one Hershey‟s Miniatures. (Mr. Goodbar has peanuts ). – Draw a before picture. – Place thumbs under middle and bend Hershey‟s Slowly until it snaps in wrapper. – Unwrap. Draw an after picture and label the fault. Do not eat yet! Copyright © 2010 Ryan P. Murphy
- 137. • The Hershey‟s Miniature should have snapped creating a break or fault in the chocolate. Copyright © 2010 Ryan P. Murphy
- 139. • Available Sheet: Folding a Fault (Optional) – No instructions, figuring out how to fold it correctly is part of the challenge / learning.
- 140. Normal Fault: Pulling apart tension causes crust to drop down. Copyright © 2010 Ryan P. Murphy
- 141. Normal Fault: Pulling apart tension causes crust to drop down. Copyright © 2010 Ryan P. Murphy
- 142. Normal Fault: Pulling apart tension causes crust to drop down. Copyright © 2010 Ryan P. Murphy
- 143. Normal Fault: Pulling apart tension causes crust to drop down. Copyright © 2010 Ryan P. Murphy
- 157. • Activity! Demonstrate a normal fault using some classroom materials. – Ideas – Clay – Styrofoam – Foam pads – Index Cards – Card Board
- 159. Thrust / Reverse Fault: Compression forces cause crust to move up. Copyright © 2010 Ryan P. Murphy
- 160. Thrust / Reverse Fault: Compression forces cause crust to move up. Copyright © 2010 Ryan P. Murphy
- 161. Thrust / Reverse Fault: Compression forces cause crust to move up. Copyright © 2010 Ryan P. Murphy
- 162. Thrust / Reverse Fault: Compression forces cause crust to move up. Copyright © 2010 Ryan P. Murphy
- 192. “It’s not my fault.”
- 193. • Which is a reverse / thrust fault? B
- 194. • Which is a reverse / thrust fault? B
- 195. • Which is a reverse / thrust fault? B
- 196. • Which is a reverse / thrust fault? B
- 197. • Which is a reverse / thrust fault? B
- 198. • Which is a reverse / thrust fault? B
- 199. • Which is a reverse / thrust fault? B
- 200. • Which is a reverse / thrust fault? B
- 201. • Which is a reverse / thrust fault? B
- 202. • Which is a reverse / thrust fault? B
- 203. • Which is a reverse / thrust fault? B
- 204. • Which is a reverse / thrust fault? B
- 205. “It’s your fault.”
- 206. • Which is a normal fault?
- 207. • Which is a normal fault?
- 208. • Which is a normal fault?
- 209. • Which is a normal fault?
- 210. • Which is a normal fault?
- 211. • Which is a normal fault?
- 212. • Which is a normal fault?
- 213. • Which is a normal fault?
- 214. • Which is a normal fault?
- 215. • Which is a normal fault?
- 216. • Which is a normal fault?
- 217. “I fault you.”
- 218. • Is this a normal fault? (True of False)
- 219. • Is this a normal fault? (True of False)
- 220. • Is this a normal fault? (True of False)
- 221. • Is this a normal fault? (True of False)
- 222. • Is this a normal fault? (True of False)
- 223. • Is this a normal fault? (True of False)
- 224. “It’s your fault.”
- 225. • Is this a normal fault? (True or False)
- 226. • Is this a normal fault? (True or False)
- 227. • Is this a normal fault? (True or False)
- 228. • Is this a normal fault? (True or False)
- 229. • Is this a normal fault? (True or False)
- 230. • Is this a normal fault? (True or False)
- 231. • Is this a normal fault? (True or False)
- 232. • Activity! Demonstrate a normal fault using some classroom materials. – Ideas – Clay – Styrofoam – Foam pads – Index Cards – Card Board
- 234. Lateral or strike-slip Fault: Crust moves alongside each other in opposite directions. Copyright © 2010 Ryan P. Murphy
- 235. Lateral or strike-slip Fault: Crust moves alongside each other in opposite directions. Copyright © 2010 Ryan P. Murphy
- 236. Lateral or strike-slip Fault: Crust moves alongside each other in opposite directions. Copyright © 2010 Ryan P. Murphy
- 241. • Which is a lateral fault?
- 242. • Which is a lateral fault?
- 243. • Which is a lateral fault?
- 244. • Which is a lateral fault?
- 245. • Which is a lateral fault?
- 246. • Which is a lateral fault?
- 247. • Which is a lateral fault?
- 248. • Which is a lateral fault?
- 249. • Which is a lateral fault?
- 250. • Which is a lateral fault?
- 251. • Which is a lateral fault?
- 253. “My Fault.”
- 254. • Which is an oblique lateral fault? B
- 255. • Which is an oblique lateral fault? B
- 256. • Which is an oblique lateral fault? B
- 257. • Which is an oblique lateral fault? B
- 258. • Which is an oblique lateral fault? B
- 259. “Faultwanna”
- 260. • Which is an oblique lateral fault? A BB
- 261. • Which is an oblique lateral fault? A BB
- 262. • Which is an oblique lateral fault? A BB
- 263. • Which is an oblique lateral fault? A BB
- 264. • Which is an oblique lateral fault? A BB
- 265. “Back to strike- slip or lateral faults.”
- 275. • San-Andreas Fault in California.
- 276. • San-Andreas Fault in California.
- 277. • San-Andreas Fault in California.
- 279. • Video! The San Andreas Fault. – http://www.youtube.com/watch?v=ixVVuN- mF1M
- 280. • Activity! Demonstrate a normal fault using some classroom materials. – Ideas – Clay – Styrofoam – Foam pads – Index Cards – Card Board
- 281. • Name the type of fault or stress.
- 282. • Name the type of fault or stress.
- 283. • Name the type of fault or stress.
- 284. • Name the type of fault or stress.
- 285. • Name the type of fault or stress.
- 286. • Name the type of fault or stress.
- 287. • Name the type of fault or stress.
- 288. “Last question.”
- 289. • Which arrows are incorrect?
- 290. • Which arrows are incorrect?
- 291. • Which arrows are incorrect?
- 292. • Which arrows are incorrect?
- 293. • Activity! Demonstrate the three types of faults you have learned using your Hershey‟s Miniature. – Normal Fault – Reverse / Thrust Fault – Strike-Slip / Lateral • Oblique Lateral Fault – Eat after teacher has seen you demonstrate an understanding of these faults Copyright © 2010 Ryan P. Murphy
- 295. • Activity! Creating a Fold. – Hold Hershey‟s Miniature (wrapped) in non- writing hand for several minutes so it warms up. • (Mr. Goodbar has peanuts ). – Draw a before picture. – Repeat same breaking / faulting process from before but this time it should fold. – Draw an after sketch (unwrap). Do not eat yet! Copyright © 2010 Ryan P. Murphy
- 296. Fold: Collision of crust bends rock layers. “Stress” Copyright © 2010 Ryan P. Murphy
- 308. • Which type of fold?
- 309. • Which type of fold?
- 310. • Which type of fold?
- 311. • Which type of fold?
- 312. • Which type of fold? Not perpendicular and not 90º.
- 313. • Which type of fold?
- 314. • Which type of fold?
- 315. • Which type of fold?
- 316. • Which type of fold?
- 317. • Which type of fold?
- 318. • Which type of fold?
- 319. • Which type of fold?
- 320. • Which type of fold?
- 321. • Which type of fold? Mirror image, Right angles formed
- 323. • Which type of fold?
- 324. • Which type of fold?
- 325. • Which type of fold?
- 327. • Which type of fold?
- 328. • Which type of fold?
- 329. • Which type of fold?
- 330. • Which type of fold?
- 331. • Which type of fold?
- 332. • Activity! Creating a Fold. – The rock / chocolate should be more elastic now. – Repeat same breaking / faulting process from before but this time it should fold. – Draw an after sketch (unwrap). Do not eat yet! Copyright © 2010 Ryan P. Murphy
- 333. • The warm chocolate should have folded because the heat made it more malleable. Folds occur in this way as well.
- 334. • The warm chocolate should have folded because the heat made it more malleable. Folds occur in this way as well.
- 335. Compression Folds - - Copyright © 2010 Ryan P. Murphy
- 336. • Activity! Can we compress a carpet together along the floor to make folds.
- 337. • Activity! Can we compress a carpet together along the floor to make folds.
- 338. Compression Folds. - - Copyright © 2010 Ryan P. Murphy
- 339. Compression Folds. - A - S Copyright © 2010 Ryan P. Murphy
- 340. Anticline: Oldest layer at core. Copyright © 2010 Ryan P. Murphy
- 341. Anticline: Oldest layer at core. Copyright © 2010 Ryan P. Murphy
- 342. Anticline: Oldest layer at core. Copyright © 2010 Ryan P. Murphy “Arrggh, I’m all old and grumpy…. ”
- 343. Syncline: Youngest layer at core. Copyright © 2010 Ryan P. Murphy
- 344. Syncline: Youngest layer at core. Copyright © 2010 Ryan P. Murphy
- 345. Syncline: Youngest layer at core. Copyright © 2010 Ryan P. Murphy “I’m young and happy… ”
- 346. • What type of face should we draw? Copyright © 2010 Ryan P. Murphy
- 347. • Answer! Syncline. Syncline Copyright © 2010 Ryan P. Murphy
- 348. • What type of face should we draw? Copyright © 2010 Ryan P. Murphy
- 349. • Answer! Anticline. Anticline Copyright © 2010 Ryan P. Murphy
- 350. • Is this a anticline or syncline? Copyright © 2010 Ryan P. Murphy
- 351. • Answer! Syncline. Copyright © 2010 Ryan P. Murphy
- 352. • Answer! Syncline. Copyright © 2010 Ryan P. Murphy Synclines have the youngest rock in its center or core.
- 353. • Answer! Syncline. Copyright © 2010 Ryan P. Murphy
- 354. • What is this a picture of? Copyright © 2010 Ryan P. Murphy
- 355. • Answer! Syncline Fold. Copyright © 2010 Ryan P. Murphy
- 356. • Answer! Syncline Fold. Copyright © 2010 Ryan P. Murphy
- 357. • Answer! Syncline Fold. Copyright © 2010 Ryan P. Murphy
- 358. • What is this a picture of? Copyright © 2010 Ryan P. Murphy
- 359. • Answer! One massive anticline fold. Copyright © 2010 Ryan P. Murphy
- 360. • Answer! One massive anticline fold. Copyright © 2010 Ryan P. Murphy
- 361. • Answer! One massive anticline fold. Copyright © 2010 Ryan P. Murphy Anticlines are folds in which the oldest rock lies in the center or core
- 362. • Answer! One massive anticline fold. Copyright © 2010 Ryan P. Murphy
- 363. Copyright © 2010 Ryan P. Murphy
- 364. Copyright © 2010 Ryan P. Murphy
- 365. Copyright © 2010 Ryan P. Murphy
- 366. Copyright © 2010 Ryan P. Murphy
- 367. Copyright © 2010 Ryan P. Murphy
- 368. Copyright © 2010 Ryan P. Murphy
- 369. Copyright © 2010 Ryan P. Murphy
- 370. Copyright © 2010 Ryan P. Murphy
- 371. Copyright © 2010 Ryan P. Murphy
- 372. Copyright © 2010 Ryan P. Murphy
- 373. Copyright © 2010 Ryan P. Murphy
- 374. Copyright © 2010 Ryan P. Murphy
- 375. Copyright © 2010 Ryan P. Murphy
- 376. Copyright © 2010 Ryan P. Murphy
- 382. Happy hydrologist at syncline Let’s dig a well.
- 383. Happy oil and gas geologist at anticlines. Happy hydrologist at syncline Let’s dig a well.
- 384. Happy oil and gas geologist at anticlines. Happy hydrologist at syncline Let’s dig a well. Let’s drill for gas and oil
- 385. Happy oil and gas geologist at anticlines. Happy hydrologist at syncline Let’s dig a well. Let’s drill for gas and oil
- 386. Happy oil and gas geologist at anticlines. Happy hydrologist at syncline Let’s dig a well. Let’s drill for gas and oil
- 387. Happy oil and gas geologist at anticlines. Happy hydrologist at syncline Let’s dig a well. Let’s drill for gas and oil
- 388. Happy oil and gas geologist at anticlines. Happy hydrologist at syncline Let’s dig a well. Let’s drill for gas and oil Note: These resources are unevenly distributed around the planet.
- 389. • Activity! Making folds. – Flatten out layers of different colored clay and lay them on top of each other. – Compress clay together from either end. – Draw your compression fold in your journal.
- 390. • Activity! Making folds. – Flatten out layers of different colored clay and lay them on top of each other. – Compress clay together from either end. – Draw your compression fold in your journal.
- 391. • Activity! Making folds. – Flatten out layers of different colored clay and lay them on top of each other. – Compress clay together from either end. – Draw your compression fold in your journal. Compression Fold Anticline
- 392. • Activity! Making folds. – Flatten out layers of different colored clay and lay them on top of each other. – Compress clay together from either end. – Draw your compression fold in your journal. Compression Fold Anticline
- 393. • You can now skip ahead a bit to complete this question.
- 394. • You can now skip ahead a bit to complete this question.
- 396. Learn more about faults and folds at… http://www.classzone.com/books /earth_science/terc/content/inve stigations/es1106/es1106page01 .cfm
- 397. • Activity / Demonstration. Deformation Box – Teacher secures sturdy cardboard to inside of clear box-like container. – Teacher fills container with a layer of sugar and smoothes it out, followed by coffee grounds and so on. – Teacher then slowly moves the cardboard forward. – Once movement has caused deformation, secure the cardboard in place by placing an object between the cardboard and the side of the box. – Students sketch and describe findings.
- 398. • Visual of set-up Sugar Object Coffee Grounds
- 401. • Quiz Wiz 1-10. Name that fault or fold. • Normal (Tension), Reverse / Thrust (Compression), Lateral / Strip-strike (Shearing) • Compression Fold – Anticline / Syncline Copyright © 2010 Ryan P. Murphy
- 412. • Bonus Question! “What toy am I”
- 413. • Answers! Quiz Wiz 1-10. Name that fault or fold. Copyright © 2010 Ryan P. Murphy
- 426. “I’m a Syncline!”
- 427. “I’m a Syncline!”
- 446. • Bonus Question! “What toy am I”
- 447. • Answer! Glo Worm.
- 448. • Try and figure out the picture beneath the boxes. Raise your hand when you think you know. – You only get one guess. Copyright © 2010 Ryan P. Murphy
- 460. • You can now complete this question.
- 462. • You can now complete this question.
- 463. • You can now complete this question.
- 465. • Activity! Jell-O Quake Demonstration – Make a tray of Jell-O. (The larger the better) – Place a layer of plastic wrap over the top. – Gently pat surface and watch waves travel from the epicenter in all directions. – Add sugar cube buildings. – Enjoy afterwards?
- 466. New Area of Focus: Earthquakes Copyright © 2010 Ryan P. Murphy
- 467. • Have you ever felt an earthquake? – When, where, how large was it? Copyright © 2010 Ryan P. Murphy
- 468. • Video! Sitting by the pool when an earthquake occurs. – Location: Mexico 7.2 on Easter Sunday 2010 – http://www.youtube.com/watch?v=H3OwziE4anM
- 469. Earthquake: Shaking of the earth’s crust from a sudden release of energy. Copyright © 2010 Ryan P. Murphy
- 470. Earthquake: Shaking of the earth’s crust from a sudden release of energy. Copyright © 2010 Ryan P. Murphy Note: Unlike volcanoes, earthquakes are difficult to predict. Seismologists use prior earthquakes to determine the likelihood and magnitude of a future quake. The time scale could easily have a 50 year window. Learn more at… http://pubs.usgs.gov/gip/earthq1/predict.html
- 471. • In an earthquake, Copyright © 2010 Ryan P. Murphy
- 472. • In an earthquake, body waves Copyright © 2010 Ryan P. Murphy
- 473. • In an earthquake, body waves move through the inner part of the earth, Copyright © 2010 Ryan P. Murphy
- 474. • In an earthquake, body waves move through the inner part of the earth, Copyright © 2010 Ryan P. Murphy
- 475. • In an earthquake, body waves move through the inner part of the earth, while surface waves travel over and near the surface. Copyright © 2010 Ryan P. Murphy
- 476. • Activity! Making Waves with a Slinky • Teacher will demonstrate waves after we learn them. (Eye Wear!) – Draw waves in journal. – Try and identify waves after sketches. Copyright © 2010 Ryan P. Murphy
- 477. • Mechanical Waves are waves which propagate through a material like rock. – They can be Longitudinal and Transverse
- 478. • Mechanical Waves are waves which propagate through a material like rock. – They can be Longitudinal and Transverse
- 479. • Mechanical Waves are waves which propagate through a material like rock. – They can be Longitudinal and Transverse
- 480. • Mechanical Waves are waves which propagate through a material like rock. – They can be Longitudinal and Transverse
- 481. • Longitudinal wave: A wave that is propagated in the same direction as the displacement of the transmitting medium
- 482. • Longitudinal wave: A wave that is propagated in the same direction as the displacement of the transmitting medium – Primary Wave, (P-Wave) Arrives first / Fast
- 483. • Longitudinal wave: A wave that is propagated in the same direction as the displacement of the transmitting medium – Primary Wave, (P-Wave) Arrives first / Fast
- 484. • Transverse Waves: The particle displacement is perpendicular to the direction of wave propagation
- 485. • Transverse Waves: The particle displacement is perpendicular to the direction of wave propagation • Secondary Wave (S-Wave) Slower but powerful.
- 486. • Transverse Waves: The particle displacement is perpendicular to the direction of wave propagation • Secondary Wave (S-Wave) Slower but powerful.
- 487. • Video Link! Longitudinal and Transverse Waves. (Interesting) – https://www.youtube.com/watch?v=aLAB- d8VnZ8
- 488. • Which is a longitudinal wave, and which is a transverse wave?
- 489. • Which is a longitudinal wave, and which is a transverse wave?
- 490. • Which is a longitudinal wave, and which is a transverse wave?
- 491. • Which is a longitudinal wave, and which is a transverse wave?
- 492. • Which is a longitudinal wave, and which is a transverse wave?
- 493. • Which is a longitudinal wave, and which is a transverse wave?
- 494. • Which is a longitudinal wave, and which is a transverse wave?
- 495. • Which is a longitudinal wave, and which is a transverse wave?
- 496. • Which is a longitudinal wave, and which is a transverse wave?
- 497. • Which is a longitudinal wave, and which is a transverse wave?
- 498. • Is this a transverse wave or longitudinal wave?
- 499. • Is this a transverse wave or longitudinal wave?
- 500. P Wave: Primary wave. Moves lateral Copyright © 2010 Ryan P. Murphy
- 501. P Wave: Primary wave. Moves lateral Copyright © 2010 Ryan P. Murphy
- 502. P Wave: Primary wave. Moves lateral Copyright © 2010 Ryan P. Murphy About the speed of sound Typical speeds are 330 m/s in air, 1450 m/s in water and about 5000 m/s in granite
- 503. P Wave: Primary wave. Moves lateral Copyright © 2010 Ryan P. Murphy
- 504. P Wave: Primary wave. Moves lateral Copyright © 2010 Ryan P. Murphy
- 505. P Wave: Primary wave. Moves lateral Copyright © 2010 Ryan P. Murphy
- 506. • Is this a Primary Wave? Explain. Copyright © 2010 Ryan P. Murphy
- 507. • Is this a Primary Wave? Explain. Copyright © 2010 Ryan P. Murphy
- 508. • Answer! This is primary wave because it moves lateral (across) and not up and down. Copyright © 2010 Ryan P. Murphy
- 509. • Answer! This is primary wave because it moves lateral (across) and not up and down. Copyright © 2010 Ryan P. Murphy
- 510. S Wave: Secondary waves. Stronger and moves back and forth. Copyright © 2010 Ryan P. Murphy
- 511. S Wave: Secondary waves. Stronger and moves back and forth. Copyright © 2010 Ryan P. Murphy 60% the speed of P Waves, can only travel in liquid and solid
- 512. S Wave: Secondary waves. Stronger and moves back and forth. Copyright © 2010 Ryan P. Murphy
- 513. S Wave: Secondary waves. Stronger and moves back and forth. Copyright © 2010 Ryan P. Murphy
- 514. S Wave: Secondary waves. Stronger and moves back and forth. Copyright © 2010 Ryan P. Murphy
- 515. S Wave: Secondary waves. Stronger and moves back and forth. Copyright © 2010 Ryan P. Murphy
- 516. S Wave: Secondary waves. Stronger and moves back and forth. Copyright © 2010 Ryan P. Murphy
- 517. • Is this a Primary wave or a secondary wave? Copyright © 2010 Ryan P. Murphy
- 518. • Is this a Primary wave or a secondary wave? Copyright © 2010 Ryan P. Murphy
- 519. • Is this a Primary wave or a secondary wave? Copyright © 2010 Ryan P. Murphy
- 520. • Is this a Primary wave or a secondary wave? Copyright © 2010 Ryan P. Murphy
- 521. • Is this a Primary wave or a secondary wave? Copyright © 2010 Ryan P. Murphy
- 522. • Where do we see this type of wave? Copyright © 2010 Ryan P. Murphy
- 523. • Answer! Ocean / on water. Copyright © 2010 Ryan P. Murphy
- 524. • Answer! Ocean / on water. Copyright © 2010 Ryan P. Murphy
- 525. • Rayleigh waves can also move through the earth in an earthquake. Copyright © 2010 Ryan P. Murphy
- 526. • Rayleigh waves can also move through the earth in an earthquake. Copyright © 2010 Ryan P. Murphy
- 527. • Last type of wave. • Love Wave, side to side and up and down. Copyright © 2010 Ryan P. Murphy
- 528. • Last type of wave. • Love Wave Copyright © 2010 Ryan P. Murphy
- 529. • Last type of wave. • Love Wave, side to side and up and down. Copyright © 2010 Ryan P. Murphy
- 530. • Last type of wave. • Love Wave, side to side and up and down. Copyright © 2010 Ryan P. Murphy
- 531. • Last type of wave. • Love Wave, side to side and up and down. Copyright © 2010 Ryan P. Murphy
- 532. • Last type of wave. • Love Wave, side to side and up and down. Copyright © 2010 Ryan P. Murphy
- 533. • Last type of wave. • Love Wave, side to side and up and down. Copyright © 2010 Ryan P. Murphy
- 534. • Last type of wave. • Love Wave, side to side and up and down. Copyright © 2010 Ryan P. Murphy
- 535. • Which is a Rayleigh Wave, and which is a Love Wave? Copyright © 2010 Ryan P. Murphy
- 536. • Which is a Rayleigh Wave, and which is a Love Wave? Copyright © 2010 Ryan P. Murphy
- 537. • Which is a Rayleigh Wave, and which is a Love Wave? Copyright © 2010 Ryan P. Murphy
- 538. • Which is a Rayleigh Wave, and which is a Love Wave? Copyright © 2010 Ryan P. Murphy
- 539. • Which is a Rayleigh Wave, and which is a Love Wave? Copyright © 2010 Ryan P. Murphy
- 540. • Which is a Rayleigh Wave, and which is a Love Wave? Copyright © 2010 Ryan P. Murphy
- 541. • Which is a Rayleigh Wave, and which is a Love Wave? Copyright © 2010 Ryan P. Murphy
- 542. • Which is a Rayleigh Wave, and which is a Love Wave? Copyright © 2010 Ryan P. Murphy
- 543. • Which is a Rayleigh Wave, and which is a Love Wave? Copyright © 2010 Ryan P. Murphy
- 544. • Which is a Rayleigh Wave, and which is a Love Wave? Copyright © 2010 Ryan P. Murphy
- 545. “Oh-no!” “We are trying it one more time.”
- 546. • What two types of waves can be seen below? Which is which? Copyright © 2010 Ryan P. Murphy
- 547. • What two types of waves can be seen below? Which is which? Copyright © 2010 Ryan P. Murphy
- 548. • What two types of waves can be seen below? Which is which? Copyright © 2010 Ryan P. Murphy
- 549. • What two types of waves can be seen below? Which is which? Copyright © 2010 Ryan P. Murphy
- 550. • What two types of waves can be seen below? Which is which? Copyright © 2010 Ryan P. Murphy
- 551. • What two types of waves can be seen below? Which is which? Copyright © 2010 Ryan P. Murphy
- 552. • What two types of waves can be seen below? Which is which? Copyright © 2010 Ryan P. Murphy
- 553. • What two types of waves can be seen below? Which is which? Copyright © 2010 Ryan P. Murphy
- 554. • What two types of waves can be seen below? Which is which? Copyright © 2010 Ryan P. Murphy
- 555. • What two types of waves can be seen below? Which is which? Copyright © 2010 Ryan P. Murphy
- 556. • What two types of waves can be seen below? Which is which? Copyright © 2010 Ryan P. Murphy
- 557. • What two types of waves can be seen below? Which is which? Copyright © 2010 Ryan P. Murphy
- 558. • What two types of waves can be seen below? Which is which? Copyright © 2010 Ryan P. Murphy
- 559. • What two types of waves can be seen below? Which is which? Copyright © 2010 Ryan P. Murphy
- 560. • What two types of waves can be seen below? Which is which? Copyright © 2010 Ryan P. Murphy
- 561. • What two types of waves can be seen below? Which is which? Copyright © 2010 Ryan P. Murphy
- 562. • What two types of waves can be seen below? Which is which? Copyright © 2010 Ryan P. Murphy
- 563. • What two types of waves can be seen below? Which is which? Copyright © 2010 Ryan P. Murphy
- 564. • Which wave is faster? S or P. • S-Wave P-Wave Copyright © 2010 Ryan P. Murphy
- 565. • Which wave is faster? S or P. • S-Wave P-Wave Copyright © 2010 Ryan P. Murphy
- 566. • Which wave is faster? S or P. • S-Wave P-Wave Copyright © 2010 Ryan P. Murphy
- 567. • Which wave is faster? S or P. • S-Wave P-Wave Copyright © 2010 Ryan P. Murphy
- 568. • Which wave is faster? S or P. • S-Wave P-Wave Copyright © 2010 Ryan P. Murphy
- 569. • Which wave is faster? S or P. • S-Wave P-Wave Copyright © 2010 Ryan P. Murphy
- 570. • Which wave is faster? S or P. • S-Wave P-Wave Copyright © 2010 Ryan P. Murphy
- 571. • Which wave is faster? S or P. • S-Wave P-Wave Copyright © 2010 Ryan P. Murphy
- 572. • Which wave is faster? S or P. • S-Wave P-Wave Copyright © 2010 Ryan P. Murphy
- 573. • Which wave is faster? S or P. • S-Wave P-Wave Copyright © 2010 Ryan P. Murphy
- 574. • Name the wave?
- 575. • Name the wave?
- 576. • Name the wave?
- 577. • Name the wave?
- 578. • Name the wave?
- 579. • Name the wave?
- 580. • Name the wave?
- 581. • Name the wave?
- 582. • Name the wave?
- 583. • Name the wave?
- 584. • Name the wave?
- 585. • Name the wave?
- 586. • Name the wave? Which one is a Longitudinal Wave?
- 587. • Name the wave? Which one is a Longitudinal Wave?
- 588. • Name the wave? Which one is a Longitudinal Wave?
- 589. • Name the wave? Which are Body Waves?
- 590. • Name the wave? Which are Body Waves?
- 591. • Name the wave? Which are Surface Waves?
- 592. • Name the wave? Which are Surface Waves?
- 593. • Name the wave? Which ones are Transverse Waves?
- 594. • Name the wave? Which ones are Transverse Waves?
- 595. • Name the wave? Which ones are Transverse Waves?
- 596. • Which one of the waves below arrives first? Copyright © 2010 Ryan P. Murphy
- 597. • Which one of the waves below arrives first? Copyright © 2010 Ryan P. Murphy
- 598. • Which one of the waves below arrives first? Copyright © 2010 Ryan P. Murphy
- 599. • Which one of the waves below arrives first? Copyright © 2010 Ryan P. Murphy
- 600. • Which one of the waves below arrives first? Copyright © 2010 Ryan P. Murphy
- 601. • Which one of the waves below arrives first? Copyright © 2010 Ryan P. Murphy
- 602. • Which one of the waves below arrives first? Copyright © 2010 Ryan P. Murphy
- 604. • Activity! Releasing our anger in a non- violent way. – Slowly bend a toothpick until it breaks. Copyright © 2010 Ryan P. Murphy
- 605. • Question! – When did the earthquake occur? – What caused the earthquake? Copyright © 2010 Ryan P. Murphy
- 606. • Note: When energy forces (tension) are to high, the crust slips violently and causes earthquakes. Copyright © 2010 Ryan P. Murphy
- 607. • Note: When energy forces (tension) are to high, the crust slips violently and causes earthquakes. Copyright © 2010 Ryan P. Murphy
- 608. • Note: When energy forces (tension) are to high, the crust slips violently and causes earthquakes. Copyright © 2010 Ryan P. Murphy
- 609. • Note: When energy forces (tension) are to high, the crust slips violently and causes earthquakes. Copyright © 2010 Ryan P. Murphy
- 610. • Note: When energy forces (tension) are to high, the crust slips violently and causes earthquakes. Copyright © 2010 Ryan P. Murphy
- 611. • Note: When energy forces (tension) are to high, the crust slips violently and causes earthquakes. Copyright © 2010 Ryan P. Murphy
- 617. • Activity! Jell-O Quake Demonstration – Make a tray of Jell-O. (The larger the better) – Place a layer of plastic wrap over the top. – Gently pat surface and watch waves travel from the epicenter in all directions. – Add sugar cube buildings. – Enjoy afterwards?
- 618. • Earth Quake Drill: “Drop, Cover, and Hold on.” – http://www.youtube.com/watch?v=LP57C0LITrc
- 619. • You can now complete this question.
- 620. • You can now complete this question.
- 622. An earthquake is plate movement that happens very quickly instead of slowly. Copyright © 2010 Ryan P. Murphy
- 623. An earthquake is plate movement that happens very quickly instead of slowly. Copyright © 2010 Ryan P. Murphy
- 624. An earthquake is plate movement that happens very quickly instead of slowly. Copyright © 2010 Ryan P. Murphy
- 642. Earthquakes are…
- 644. • What is this?
- 645. • Recreation ancient Chinese Seismograph from 132 AD. – Copper balls would fall out into a frogs mouth forecasting and reporting an earthquake.
- 646. • The seismograph uses a counterweight system, pen, and moving piece of paper. Copyright © 2010 Ryan P. Murphy
- 647. Seismograph: An instrument used to measure the shaking caused by an earthquake. Copyright © 2010 Ryan P. Murphy
- 648. Seismograph: An instrument used to measure the shaking caused by an earthquake. Copyright © 2010 Ryan P. Murphy Inertia: Counterweight wants to remain at rest.
- 649. Seismograph: An instrument used to measure the shaking caused by an earthquake. Copyright © 2010 Ryan P. Murphy Inertia: But once in motion wants to stay in motion.
- 650. Seismograph: An instrument used to measure the shaking caused by an earthquake. Copyright © 2010 Ryan P. Murphy Inertia: But once in motion wants to stay in motion.
- 651. • Activity Link! Make a seismograph • http://pbskids.org/zoom/activities/sci/seism ometer.html or http://science- mattersblog.blogspot.com/2011/04/earthq uakes-make-seismograph.html
- 652. • iSeismometer for the Ipad – Learn more at… http://www.iseismometer.com/
- 653. • Video Link! Seismographs and Seismomitor – http://www.youtube.com/watch?v=Gbd1FcuLJLQ
- 654. • Activity! Human Seismograph. – Need person in rolling chair. – String. – Weight on end of string. – Pen tied to weight. – Paper that two students move. Copyright © 2010 Ryan P. Murphy
- 658. Seismograph. Learn more at…. http://earthquake.usgs.gov/learn/topics/seismology/keeping_track.php
- 662. • Activity! Creating a mini earthquake. – Patter feet and hands on desk quietly as small vibrations are recorded. – Increase the magnitude of the noise when the magnitude of the lines increase. – Stop at end, repeat one more time. Copyright © 2010 Ryan P. Murphy
- 664. Richter Scale - Scale for measuring earthquake magnitude. Copyright © 2010 Ryan P. Murphy
- 665. Richter Scale - Scale for measuring earthquake magnitude. A magnitude 7.0 earthquake generates 10 times larger amplitude waves than those of a magnitude 6.0. Copyright © 2010 Ryan P. Murphy
- 666. Richter Scale - Scale for measuring earthquake magnitude. A magnitude 7.0 earthquake generates 10 times larger amplitude waves than those of a magnitude 6.0. Copyright © 2010 Ryan P. Murphy 10 times larger
- 667. Richter Scale - Scale for measuring earthquake magnitude. A magnitude 7.0 earthquake generates 10 times larger amplitude waves than those of a magnitude 6.0. Copyright © 2010 Ryan P. Murphy 10 times larger 10 times larger
- 668. Richter Scale - Scale for measuring earthquake magnitude. A magnitude 7.0 earthquake generates 10 times larger amplitude waves than those of a magnitude 6.0. Copyright © 2010 Ryan P. Murphy 10 times larger 10 times larger Richter Scale: Learn More at.. http://earthquake.usgs.gov/learn/topics/richter.php
- 670. • Top 10 Largest earthquakes in the world since 1900. Learn more about the Top Ten Earthquakes at… http://earthquake.usgs.gov/earthquakes/world/10_ largest_world.php
- 671. • #10) 1957 Andreanof Islands, Alaska Magnitude 8.6 Copyright © 2010 Ryan P. Murphy
- 672. • #9) 1950 Assam - Tibet • Magnitude 8.6 Copyright © 2010 Ryan P. Murphy
- 673. • #8) 2005 Northern Sumatra, Indonesia • Magnitude 8.6 Copyright © 2010 Ryan P. Murphy
- 674. • #8) 2005 Northern Sumatra, Indonesia • Magnitude 8.6 Copyright © 2010 Ryan P. Murphy “Hoot” “Hoot” “I sure hope everyone is safe.”
- 675. • #8) 2005 Northern Sumatra, Indonesia • Magnitude 8.6 Copyright © 2010 Ryan P. Murphy “Hoot” “Hoot” “I sure hope everyone is safe.”
- 676. • #7) 1965 Rat Islands, Alaska • Magnitude 8.7 Copyright © 2010 Ryan P. Murphy
- 677. • #6) 1906 Off the Coast of Ecuador • Magnitude 8.8 Copyright © 2010 Ryan P. Murphy
- 678. • #5) 2010 Offshore of Chile • Magnitude 8.8 Copyright © 2010 Ryan P. Murphy
- 679. • #4) 1952 Kamchatka • Magnitude 9.0 Copyright © 2010 Ryan P. Murphy
- 680. • #4) 2011 Japan • Magnitude 9.0 Copyright © 2010 Ryan P. Murphy
- 681. • Japanese earthquake, tsunami, and dangers associated with nuclear power / meltdown occurred.
- 682. • #3) 2004 Off the coast of Northern Sumatra, • Magnitude 9.1 Copyright © 2010 Ryan P. Murphy
- 683. • #2) 1964 Prince William Sound, Alaska • Magnitude 9.2 Copyright © 2010 Ryan P. Murphy
- 684. • #1) Chile 1960 • Magnitude 9.5 Copyright © 2010 Ryan P. Murphy
- 685. • Other notable earthquakes. – New Madrid Missouri Earthquake 1811-1812 – Between 7 and 8 on Richter Scale – Area was sparsely populated in the 1800‟s
- 686. • Other notable earthquakes. – New Madrid Missouri Earthquake 1811-1812 – Between 7 and 8 on Richter Scale – Area was sparsely populated in the 1800‟s
- 687. • The Loma Prieta Earthquake (World Series Earthquake) 1989 – Hit San Francisco Bay Area (6.9)
- 688. • San Francisco Earthquake 1906 – Huge death toll from collapse of buildings and fire storm that emerged as a result. – Magnitude 7.7 – 8.25
- 689. • The Great Kantō earthquake (1923) Mainland Japan. – 7.9 on the Richter Scale (140,000 dead) – Occurred at lunchtime and many fires erupted from stoves that fell over. (Firestorm) – Typhoon also hit the area at the same time.
- 690. • Many more earthquakes have devastated humanity than were presented in this short list.
- 691. • Many more earthquakes have devastated humanity than were presented in this short list.
- 692. • Many more earthquakes have devastated humanity than were presented in this short list.
- 693. • Final Warning. The Cascadia Fault – The US Northwest is struck by a major earthquake every 240 years on average. – It‟s been 311 years since the last major quake.
- 694. • Recent earthquakes over last seven days from around the world and magnitude. – Note how most earthquakes will be on plate boundaries. – http://earthquake.usgs.gov/earthquakes/map/
- 695. • You can now skip ahead a bit to complete this question.
- 696. • You can now skip ahead a bit to complete this question.
- 699. Epicenter: The point on the earth's surface that is directly above the hypocenter or focus. - Copyright © 2010 Ryan P. Murphy
- 700. Epicenter: The point on the earth's surface that is directly above the hypocenter or focus. Just above the earthquake Copyright © 2010 Ryan P. Murphy
- 701. Epicenter: The point on the earth's surface that is directly above the hypocenter or focus. Just above the earthquake / focus Copyright © 2010 Ryan P. Murphy
- 702. Epicenter: The point on the earth's surface that is directly above the hypocenter or focus. Just above the earthquake / focus / hypocenter Copyright © 2010 Ryan P. Murphy
- 703. Epicenter: The point on the earth's surface that is directly above the hypocenter or focus. Just above the earthquake / focus / hypocenter Copyright © 2010 Ryan P. Murphy
- 704. • Activity! Sheet Provided – Locating the Epicenter, Hypocenter, and some basic Origami – Please cut out the box – Color it / label epicenter, hypocenter, fault line. • Color Seismic Waves Red – Fold it correctly and tape it together. – Be ready for quiz on next slide.
- 705. • Activity! Sheet Provided – Locating the Epicenter, Hypocenter, and some basic Origami – Please cut out the box – Color it / label epicenter, hypocenter, fault line. • Color Seismic Waves Red – Fold it correctly and tape it together. – Be ready for quiz on next slide.
- 706. • Activity! Sheet Provided – Locating the Epicenter, Hypocenter, and some basic Origami – Please cut out the box – Color it / label epicenter, hypocenter, fault line. • Color Seismic Waves Red – Fold it correctly and tape it together. – Be ready for quiz on next slide.
- 707. • Activity! Sheet Provided – Locating the Epicenter, Hypocenter, and some basic Origami – Please cut out the box – Color it / label epicenter, hypocenter, fault line. • Color Seismic Waves Red – Fold it correctly and tape it together. – Be ready for quiz on next slide.
- 708. • Activity! Sheet Provided – Locating the Epicenter, Hypocenter, and some basic Origami – Please cut out the box – Color it / label epicenter, hypocenter, fault line. • Color Seismic Waves Red – Fold it correctly and tape it together. – Be ready for quiz on next slide.
- 709. • Activity! Sheet Provided – Locating the Epicenter, Hypocenter, and some basic Origami – Please cut out the box – Color it / label epicenter, hypocenter, fault line. • Color Seismic Waves Red – Fold it correctly and tape it together. – Be ready for quiz on next slide.
- 710. • Activity! Sheet Provided – Locating the Epicenter, Hypocenter, and some basic Origami – Please cut out the box – Color it / label epicenter, hypocenter, fault line. • Color Seismic Waves Red – Fold it correctly and tape it together. – Be ready for quiz on next slide.
- 711. • Activity! Sheet Provided – Locating the Epicenter, Hypocenter, and some basic Origami – Please cut out the box – Color it / label epicenter, hypocenter, fault line. • Color Seismic Waves Red – Fold it correctly and tape it together. – Be ready for quiz on next slide. No directions on folding. Science is learning through experience in its simplest form. Figure it out.
- 715. Hypocenter / Focus
- 716. Hypocenter / Focus
- 717. Hypocenter / Focus Primary Waves Secondary Waves
- 718. Hypocenter / Focus Primary Waves Secondary Waves
- 719. Hypocenter / Focus Primary Waves Secondary Waves Fault Line
- 720. Hypocenter / Focus Primary Waves Secondary Waves Fault Line
- 721. Hypocenter / Focus Epicenter Primary Waves Secondary Waves Fault Line
- 722. Hypocenter / Focus Epicenter Primary Waves Secondary Waves Fault Line
- 723. Hypocenter / Focus Epicenter Primary Waves Secondary Waves Reverse / Thrust Fault Fault Line
- 724. Hypocenter / Focus Epicenter Primary Waves Secondary Waves Reverse / Thrust Fault Fault Line
- 725. Hypocenter / Focus Epicenter Primary Waves Secondary Waves Reverse / Thrust Fault Fault Line
- 726. Hypocenter / Focus Epicenter Primary Waves Secondary Waves Reverse / Thrust Fault Fault Line
- 733. Reverse / Thrust Fault Fault Line
- 734. Reverse / Thrust Fault Fault Line
- 735. Hypocenter / Focus Reverse / Thrust Fault Fault Line
- 736. Hypocenter / Focus Reverse / Thrust Fault Fault Line
- 737. Hypocenter / Focus Primary Waves Secondary Waves Reverse / Thrust Fault Fault Line
- 738. Hypocenter / Focus Primary Waves Secondary Waves Reverse / Thrust Fault Fault Line
- 739. Hypocenter / Focus Epicenter Primary Waves Secondary Waves Reverse / Thrust Fault Fault Line
- 740. Hypocenter / Focus Epicenter Primary Waves Secondary Waves Reverse / Thrust Fault Fault Line
- 741. • An earthquake requires three monitoring stations to determine it‟s location.
- 742. • An earthquake requires three monitoring stations to determine it‟s location. P and S waves travel at known velocities through the earth. S waves are slower than P waves by a known amount.
- 743. • An earthquake requires three monitoring stations to determine it‟s location. P and S waves travel at known velocities through the earth. S waves are slower than P waves by a known amount. Therefore, the farther a seismic recording station is from the earthquake epicenter the greater the difference in time of arrival between the P and S wave.
- 744. • An earthquake requires three monitoring stations to determine it‟s location. P and S waves travel at known velocities through the earth. S waves are slower than P waves by a known amount. Therefore, the farther a seismic recording station is from the earthquake epicenter the greater the difference in time of arrival between the P and S wave.
- 745. • An earthquake requires three monitoring stations to determine it‟s location. P and S waves travel at known velocities through the earth. S waves are slower than P waves by a known amount. Therefore, the farther a seismic recording station is from the earthquake epicenter the greater the difference in time of arrival between the P and S wave.
- 746. • An earthquake requires three monitoring stations to determine it‟s location. P and S waves travel at known velocities through the earth. S waves are slower than P waves by a known amount. Therefore, the farther a seismic recording station is from the earthquake epicenter the greater the difference in time of arrival between the P and S wave.
- 747. • An earthquake requires three monitoring stations to determine it‟s location. P and S waves travel at known velocities through the earth. S waves are slower than P waves by a known amount. Therefore, the farther a seismic recording station is from the earthquake epicenter the greater the difference in time of arrival between the P and S wave.
- 748. • An earthquake requires three monitoring stations to determine it‟s location. P and S waves travel at known velocities through the earth. S waves are slower than P waves by a known amount. Therefore, the farther a seismic recording station is from the earthquake epicenter the greater the difference in time of arrival between the P and S wave.
- 749. • An earthquake requires three monitoring stations to determine it‟s location. P and S waves travel at known velocities through the earth. S waves are slower than P waves by a known amount. Therefore, the farther a seismic recording station is from the earthquake epicenter the greater the difference in time of arrival between the P and S wave.
- 750. • An earthquake requires three monitoring stations to determine it‟s location. P and S waves travel at known velocities through the earth. S waves are slower than P waves by a known amount. Therefore, the farther a seismic recording station is from the earthquake epicenter the greater the difference in time of arrival between the P and S wave.
- 751. • An earthquake requires three monitoring stations to determine it‟s location. P and S waves travel at known velocities through the earth. S waves are slower than P waves by a known amount. Therefore, the farther a seismic recording station is from the earthquake epicenter the greater the difference in time of arrival between the P and S wave.
- 752. • An earthquake requires three monitoring stations to determine it‟s location. P and S waves travel at known velocities through the earth. S waves are slower than P waves by a known amount. Therefore, the farther a seismic recording station is from the earthquake epicenter the greater the difference in time of arrival between the P and S wave.
- 753. • An earthquake requires three monitoring stations to determine it‟s location. P and S waves travel at known velocities through the earth. S waves are slower than P waves by a known amount. Therefore, the farther a seismic recording station is from the earthquake epicenter the greater the difference in time of arrival between the P and S wave.
- 754. • An earthquake requires three monitoring stations to determine it‟s location. P and S waves travel at known velocities through the earth. S waves are slower than P waves by a known amount. Therefore, the farther a seismic recording station is from the earthquake epicenter the greater the difference in time of arrival between the P and S wave.
- 755. • An earthquake requires three monitoring stations to determine it‟s location. P and S waves travel at known velocities through the earth. S waves are slower than P waves by a known amount. Therefore, the farther a seismic recording station is from the earthquake epicenter the greater the difference in time of arrival between the P and S wave.
- 756. • An earthquake requires three monitoring stations to determine it‟s location. P and S waves travel at known velocities through the earth. S waves are slower than P waves by a known amount. Therefore, the farther a seismic recording station is from the earthquake epicenter the greater the difference in time of arrival between the P and S wave.
- 757. • An earthquake requires three monitoring stations to determine it‟s location. P and S waves travel at known velocities through the earth. S waves are slower than P waves by a known amount. Therefore, the farther a seismic recording station is from the earthquake epicenter the greater the difference in time of arrival between the P and S wave.
- 758. • An earthquake requires three monitoring stations to determine it‟s location. P and S waves travel at known velocities through the earth. S waves are slower than P waves by a known amount. Therefore, the farther a seismic recording station is from the earthquake epicenter the greater the difference in time of arrival between the P and S wave.
- 759. • An earthquake requires three monitoring stations to determine it‟s location. P and S waves travel at known velocities through the earth. S waves are slower than P waves by a known amount. Therefore, the farther a seismic recording station is from the earthquake epicenter the greater the difference in time of arrival between the P and S wave.
- 760. S and P interval
- 761. S and P interval
- 762. S and P interval
- 763. S and P interval
- 764. S and P interval
- 765. S and P interval
- 766. S and P interval
- 767. S and P interval
- 768. S and P interval
- 769. S and P interval
- 770. S and P interval
- 771. S and P interval
- 772. S and P interval
- 773. S and P interval
- 774. S and P interval
- 775. S and P interval
- 776. S and P interval
- 777. S and P interval
- 778. S and P interval
- 779. S and P interval
- 780. S and P interval
- 781. S and P interval
- 782. • Activity! S and P Gap. – Have two students line up next to each other against the wall. – Label one as the fast walker (P-wave) and one as the slow walker (S-wave “Side to Side Macho Man”) – Each students begins walking across room at same time and various students (monitoring stations) time the gap between the two students as they walk by. – Start timer when P-wave passes, and end when S-wave arrives. – Have the monitor stations share times.
- 783. • Activity! S and P Gap. P-Wave S-Wave
- 784. • Activity! S and P Gap. P-Wave S-Wave
- 785. • Activity! S and P Gap. P-Wave S-Wave
- 786. • Activity! S and P Gap. P-Wave S-Wave
- 787. • Activity! S and P Gap. P-Wave S-Wave
- 788. • Activity! S and P Gap. P-Wave S-Wave START TIMER
- 789. • Activity! S and P Gap. P-Wave S-Wave START TIMER
- 790. • Activity! S and P Gap. P-Wave S-Wave START TIMER
- 791. • Activity! S and P Gap. P-Wave S-Wave START TIMER
- 792. • Activity! S and P Gap. P-Wave S-Wave END TIMER START TIMER
- 793. • Activity! S and P Gap. P-Wave S-Wave END TIMER START TIMER
- 794. • Activity! S and P Gap. P-Wave S-Wave END TIMER START TIMER START
- 795. • Activity! S and P Gap. P-Wave S-Wave END TIMER START TIMER START
- 796. • Activity! S and P Gap. P-Wave S-Wave END TIMER END TIMER START
- 797. • Activity! S and P Gap. P-Wave S-Wave END TIMER END TIMER START
- 798. • Activity! S and P Gap. P-Wave S-Wave END TIMER END TIMER START
- 799. • Activity! S and P Gap. P-Wave S-Wave END TIMER END TIMER START
- 800. • Activity! S and P Gap. P-Wave S-Wave END TIMER END TIMER END
- 801. • Activity! S and P Gap. P-Wave S-Wave END TIMER END TIMER END
- 802. • Activity! S and P Gap. P-Wave S-Wave END TIMER END TIMER END
- 803. • Activity! S and P Gap. P-Wave S-Wave END TIMER END TIMER END
- 804. • Activity! S and P Gap. P-Wave S-Wave END TIMER END TIMER END Compare times of the gap between the P wave and the S wave (should be close) 0:00 0:00 0:00
- 805. • An earthquake requires three monitoring stations to determine its location. – Where‟s the epicenter of the earthquake below?
- 806. A
- 807. A
- 808. A S and P Wave gap time / distance measured from monitoring station
- 809. B A
- 810. B A
- 811. B A
- 812. B C A
- 813. • Where „s the earthquake below? B C A
- 814. • Where „s the earthquake below? B C A Epicenter
- 816. • Where „s the earthquake epicenter below? B C A D E F G
- 817. • Where „s the earthquake epicenter below? B C A D E F G
- 818. • Where „s the earthquake epicenter below? B C A D E F G
- 819. • Where „s the earthquake epicenter below? B C A D E F G
- 820. • Where „s the earthquake epicenter below? B C A D E F G
- 821. • Where „s the earthquake epicenter below? B C A Epicenter D E F G
- 823. • Where „s the earthquake epicenter below? B C A D E F G
- 824. • Where „s the earthquake epicenter below? B C A D E F G
- 825. • Where „s the earthquake epicenter below? B C A D E F G
- 826. • Where „s the earthquake epicenter below? B C A D E F G
- 827. • Where „s the earthquake epicenter below? B C A D E F G
- 828. • Where „s the earthquake epicenter below? B C A Epicenter D E F G
- 830. • Where „s the earthquake epicenter below? B C A D E F G
- 831. • Where „s the earthquake epicenter below? B C A D E F G
- 832. • Where „s the earthquake epicenter below? B C A D E F G
- 833. • Where „s the earthquake epicenter below? B C A D E F G
- 834. • Where „s the earthquake epicenter below? B C A D E F G
- 835. • Where „s the earthquake epicenter below? B C A D E F G
- 836. • Where „s the earthquake epicenter below? B C A D E F G
- 838. • Quick Activity! Working the process backwards. – Make a right triangle in the middle of your page. – Mark each point (A, B, C) These are seismic activity monitoring stations. – Create and epicenter near the triangle. – Use a compass to create a circle from each monitoring station (center of circle) through the epicenter (perimeter of circle). – Record radius (distance from monitoring station to the epicenter). Visual next slide
- 839. • Quick Activity! Working the process backwards. – Make a right triangle in the middle of your page. – Mark each point (A, B, C) These are seismic activity monitoring stations. – Create and epicenter near the triangle. – Use a compass to create a circle from each monitoring station (center of circle) through the epicenter (perimeter of circle). – Record radius (distance from monitoring station to the epicenter). Visual next slide
- 840. • Quick Activity! Working the process backwards. – Make a right triangle in the middle of your page. – Mark each point (A, B, C) These are seismic activity monitoring stations. – Create a epicenter near the triangle. – Use a compass to create a circle from each monitoring station (center of circle) through the epicenter (perimeter of circle). – Record radius (distance from monitoring station to the epicenter). Visual next slide
- 841. • Quick Activity! Working the process backwards. – Make a right triangle in the middle of your page. – Mark each point (A, B, C) These are seismic activity monitoring stations. – Create a epicenter near the triangle. – Use a compass to create a circle from each monitoring station (center of circle) through the epicenter (perimeter of circle). – Record radius (distance from monitoring station to the epicenter). Visual next slide
- 842. • Quick Activity! Working the process backwards. – Make a right triangle in the middle of your page. – Mark each point (A, B, C) These are seismic activity monitoring stations. – Create a epicenter near the triangle. – Use a compass to create a circle from each monitoring station (center of circle) through the epicenter (perimeter of circle). – Record radius (distance from monitoring station to the epicenter). Visual next slide
- 843. • Quick Activity! Working the process backwards. – Make a right triangle in the middle of your page. – Mark each point (A, B, C) These are seismic activity monitoring stations. – Create a epicenter near the triangle. – Use a compass to create a circle from each monitoring station (center of circle) through the epicenter (perimeter of circle). – Record radius (distance from monitoring station to the epicenter). Visual next slide
- 844. • Quick Activity! Working the process backwards. – Make a right triangle in the middle of your page. – Mark each point (A, B, C) These are seismic activity monitoring stations. – Create a epicenter near the triangle. – Use a compass to create a circle from each monitoring station (center of circle) through the epicenter (perimeter of circle). – Record radius (distance from monitoring station to the epicenter). Visual next slide
- 845. • Quick Activity! Working the process backwards. – Make a right triangle in the middle of your page. – Mark each point (A, B, C) These are seismic activity monitoring stations. – Create a epicenter near the triangle. – Use a compass to create a circle from each monitoring station (center of circle) through the epicenter (perimeter of circle). – Record radius (distance from monitoring station to the epicenter). Visual next slide
- 846. • Quick Activity! Working the process backwards. – Make a right triangle in the middle of your page. – Mark each point (A, B, C) These are seismic activity monitoring stations. – Create a epicenter near the triangle. – Use a compass to create a circle from each monitoring station (center of circle) through the epicenter (perimeter of circle). – Record radius (distance from monitoring station to the epicenter). Visual next slide
- 848. A
- 849. A B
- 850. A B C
- 851. A B C * Epicenter
- 852. A B C * Epicenter
- 853. A B C * Epicenter
- 854. A B C * Epicenter
- 855. A B C * Epicenter
- 856. A B C * Epicenter
- 857. A B C * Epicenter *
- 858. A B C * Epicenter * Measure the distances from each monitoring station to the epicenter.
- 859. A B C * Epicenter * Measure the distances from each monitoring station to the epicenter. Distance to epicenter determined by the gap between the arrival of the first P wave and the first S wave
- 860. • Activity – Finding the Epicenter • http://www.geology.ar.gov/pdf/Locating_an_e picenter_activity.pdf • http://www.oakton.edu/user/4/billtong/eas100 lab/lab10quake.htm • (Advanced) • http://www.geo.mtu.edu/UPSeis/locating.html Copyright © 2010 Ryan P. Murphy Learn more at… http://www.geo.mtu.edu /UPSeis/locating.html
- 861. • Do earthquakes kill people? Copyright © 2010 Ryan P. Murphy
- 862. • Answer! Earthquakes don‟t generally kill people, Copyright © 2010 Ryan P. Murphy
- 863. • Answer! Earthquakes don‟t generally kill people, poorly built buildings do. Copyright © 2010 Ryan P. Murphy
- 864. • The type of soil a building is on, and the design / construction of the building has a lot to do with how well the building will fare in an earthquake. Copyright © 2010 Ryan P. Murphy
- 865. • Liquefaction: A process where sand or landfill will often change from a wet solid into a dense liquid, which further amplifies shaking. Copyright © 2010 Ryan P. Murphy
- 866. • Liquefaction: A process where sand or landfill will often change from a wet solid into a dense liquid, which further amplifies shaking. Copyright © 2010 Ryan P. Murphy Liquefaction Activity / Demo at… http://www.exploratorium.edu/faultline/activezone/liquefactio n.html More activities and info found at… https://media.up.edu/Physics/TOLE/EarthquakeTsunamiHazar ds/LessonPlans/EQHazardMaps_Liquefaction-TOTLE.pdf
- 872. • Activity! – Fill a tray with dry sand several inches or at least 12 cm. – Fill a one liter soda bottle with water and cap and bury into the sand.
- 873. • Activity! – Fill a tray with dry sand several inches or at least 12 cm. – Fill a one liter soda bottle with water and cap and bury into the sand. – Shake tray and observe what happens.
- 874. • Activity! – Fill a tray with dry sand several inches or at least 12 cm. – Fill a one liter soda bottle with water and cap and bury into the sand. – Shake tray and observe what happens.
- 875. • Activity! – Moisten sand but don‟t super saturate. – Shake tray and observe what happens.
- 876. • Activity! – Moisten sand but don‟t super saturate. – Shake tray and observe what happens.
- 877. • Activity! – Fill tray with lots of water so water is visible on the surface.. – Shake tray and observe what happens.
- 878. • Activity! – Fill tray with lots of water so water is visible on the surface.. – Shake tray and observe what happens.
- 879. • Activity! – Fill tray with lots of water so water is visible on the surface.. – Shake tray and observe what happens. – Why?
- 880. • Activity! – Fill tray with lots of water so water is visible on the surface.. – Shake tray and observe what happens. – Why? Liquefaction. The sand (solid) mixed with water (liquid) and acted as a liquid.
- 881. • Activity! – Fill tray with lots of water so water is visible on the surface.. – Shake tray and observe what happens. – Why? Liquefaction. The sand (solid) mixed with water (liquid) and acted as a liquid.
- 882. • Videos (Optional) Liquefaction – http://www.youtube.com/watch?v=rn3oAvmZY8k Japan – http://www.youtube.com/watch?v=tvYKcCS_J7Y Christchurch New Zealand (How it happens) Copyright © 2010 Ryan P. Murphy
- 883. • Building on loose sand and poorly packed fill material increases the intensity of the an earthquake. Copyright © 2010 Ryan P. Murphy
- 884. • Building on loose sand and poorly packed fill material increases the intensity of the an earthquake. – Building on solid bedrock is better. Copyright © 2010 Ryan P. Murphy
- 885. • Many of our major cities have large areas that are built on sand and fill. Copyright © 2010 Ryan P. Murphy
- 886. • Which area experienced liquefaction based on the seismic waves? A B Copyright © 2010 Ryan P. Murphy
- 887. • Answer! Area A because the seismic waves where more severe. A B Copyright © 2010 Ryan P. Murphy
- 888. • What‟s this?
- 889. • Answer! This is a picture of a giant counterweight that help‟s limit the shaking of a large building. Copyright © 2010 Ryan P. Murphy
- 890. • Answer! This is a picture of a giant counterweight that help‟s limit the shaking of a large building. Copyright © 2010 Ryan P. Murphy
- 891. • Earthquake proof buildings can also be built on devices that allow the ground to move without destroying the building. Copyright © 2010 Ryan P. Murphy
- 892. • Earthquake proof buildings can also be built on devices that allow the ground to move without destroying the building. Copyright © 2010 Ryan P. Murphy
- 893. Copyright © 2010 Ryan P. Murphy
- 894. Copyright © 2010 Ryan P. Murphy
- 895. Copyright © 2010 Ryan P. Murphy
- 896. Copyright © 2010 Ryan P. Murphy
- 897. Copyright © 2010 Ryan P. Murphy
- 898. • Which building will most likely not topple if the dark colored block represents the heaviest and most dense section? Why? A B c Copyright © 2010 Ryan P. Murphy
- 899. • Answer! Letter C because the weight / center of gravity is on the bottom. A B c Copyright © 2010 Ryan P. Murphy
- 900. • Is a stiff building better than a loose one in an earthquake – http://www.youtube.com/watch?v=9X- js9gXSME&feature=relmfu
- 901. • Which of the buildings below is good, poor, and really poorly designed to withstand an earthquake? A B C
- 902. • Which of the buildings below is good, poor, and really poorly designed to withstand an earthquake? A B C
- 903. • Which of the buildings below is good, poor, and really poorly designed to withstand an earthquake? A B C
- 904. • Which of the buildings below is good, poor, and really poorly designed to withstand an earthquake? A B C
- 905. • Which of the buildings below is good, poor, and really poorly designed to withstand an earthquake? A B C
- 906. • Which of the buildings below is good, poor, and really poorly designed to withstand an earthquake? A B C
- 907. • Which of the buildings below is good, poor, and really poorly designed to withstand an earthquake? A B C
- 908. • Which of the buildings below is good, poor, and really poorly designed to withstand an earthquake? A B C
- 909. • Which of the buildings below is good, poor, and really poorly designed to withstand an earthquake? A B C
- 910. • Which of the buildings below is good, poor, and really poorly designed to withstand an earthquake? A B CWhen two buildings are split this bad, connection that detach is needed.
- 911. • Rate the buildings below 1-5 for earthquake proof design. (Use fingers) A BB C D E F G H
- 912. • Rate the buildings below 1-5 for earthquake proof design. (Use fingers) A BB C D E F G H
- 913. • Rate the buildings below 1-5 for earthquake proof design. (Use fingers) Teacher Rating = 1 A BB C D E F G H
- 914. • Rate the buildings below 1-5 for earthquake proof design. (Use fingers) A BB C D E F G H
- 915. • Rate the buildings below 1-5 for earthquake proof design. (Use fingers) Teacher Rating = 1 A BB C D E F G H
- 916. • Rate the buildings below 1-5 for earthquake proof design. (Use fingers) A BB C D E F G H
- 917. • Rate the buildings below 1-5 for earthquake proof design. (Use fingers) Teacher Rating = 1 A BB C D E F G H
- 918. • Rate the buildings below 1-5 for earthquake proof design. (Use fingers) A BB C D E F G H
- 919. • Rate the buildings below 1-5 for earthquake proof design. (Use fingers) Teacher Rating = 1 A BB C D E F G H
- 920. • Rate the buildings below 1-5 for earthquake proof design. (Use fingers) A BB C D E F G H
- 921. • Rate the buildings below 1-5 for earthquake proof design. (Use fingers) Teacher Rating = 1 A BB C D E F G H
- 922. • Rate the buildings below 1-5 for earthquake proof design. (Use fingers) A BB C D E F G H
- 923. • Rate the buildings below 1-5 for earthquake proof design. (Use fingers) Teacher Rating = 1 A BB C D E F G H
- 924. • Rate the buildings below 1-5 for earthquake proof design. (Use fingers) A BB C D E F G H
- 925. • Rate the buildings below 1-5 for earthquake proof design. (Use fingers) Teacher Rating = 1 A BB C D E F G H
- 926. • Rate the buildings below 1-5 for earthquake proof design. (Use fingers) A BB C D E F G H
- 927. • Rate the buildings below 1-5 for earthquake proof design. (Use fingers) Teacher Rating = 1 A BB C D E F G H
- 928. • Rate the buildings below 1-5 for earthquake proof design. (Use fingers) A BB C D E F G H
- 929. • Is it a good or bad idea to put two buildings right next to each other?
- 930. • Is it a good or bad idea to put two buildings right next to each other? Pounding
- 931. • Is it a good or bad idea to put two buildings right next to each other? Maybe?
- 932. • Is it a good or bad idea to put two buildings right next to each other? Maybe?
- 934. • Activity! Smart Design. Building a structure that can survive an earthquake. – http://www.discoveryeducation.com/teachers/fr ee-lesson-plans/constructing-earthquake-proof- buildings.cfm Copyright © 2010 Ryan P. Murphy
- 935. • Activity! Smart Design. Building a structure that can survive an earthquake. – Class will create a poorly designed building and place in the earthquake tray and record observations / destruction. – Teams then create a structurally sound building using the blocks, textbooks, strings, elastics, clips, tape, and other materials provided using an understanding of earthquake resistant design. • Dissipate the vibrations or a counterweight system. – Move building to the earthquake tray. – Record what happens in your journal Copyright © 2010 Ryan P. Murphy
- 936. • Some sites that include information about earthquake / design. – http://www.wbdg.org/resources/seismic_desig n.php – http://www.sciencedaily.com/videos/2007/110 6-earthquake_proof_house.htm – http://www.atcouncil.org/pdfs/bp1a.pdf – http://www.popsci.com/scitech/article/2009- 09/new-earthquake-resistant-design-keeps- buildings-standing-during-violent-quakes – http://www.imaginationstationtoledo.org/conte nt/2011/03/can-you-build-an-earthquake- proof-building/
- 937. • Video of some designs from USC Berkley – http://www.youtube.com/watch?v=u0QQHv4P cgw
- 938. • Activity! Smart Design. Building a structure that can survive an earthquake. – Create a structurally sound building using the blocks on a tray. – Place building in the earthquake tray. – Record what happens in your journal. – Recreate building and try again using a devices to dissipate the vibrations or a counterweight system. Copyright © 2010 Ryan P. Murphy Pull bottom tray until it stretches bungee cord and release.
- 939. • Activity! Smart Design. Building a structure that can survive an earthquake. – Create a structurally sound building using the blocks on a tray. – Place building in the earthquake tray. – Record what happens in your journal. – Recreate building and try again using a devices to dissipate the vibrations or a counterweight system. Copyright © 2010 Ryan P. Murphy Pull bottom tray until it stretches bungee cord and release.
- 940. • Activity! Smart Design. Building a structure that can survive an earthquake. – Create a structurally sound building using the blocks on a tray. – Place building in the earthquake tray. – Record what happens in your journal. – Recreate building and try again using a devices to dissipate the vibrations or a counterweight system. Copyright © 2010 Ryan P. Murphy 123 4 5 6 7 8Magnitude of the earthquake
- 941. • Activity! Smart Design. Building a structure that can survive an earthquake. – Create a structurally sound building using the blocks on a tray. – Place building in the earthquake tray. – Record what happens in your journal. – Recreate building and try again using a devices to dissipate the vibrations or a counterweight system. Copyright © 2010 Ryan P. Murphy 123 4 5 6 7 8Magnitude of the earthquake
- 942. • Activity! Smart Design. Building a structure that can survive an earthquake. – Create a structurally sound building using the blocks on a tray. – Place building in the earthquake tray. – Record what happens in your journal. – Recreate building and try again using a devices to dissipate the vibrations or a counterweight system. Copyright © 2010 Ryan P. Murphy 123 4 5 6 7 8Magnitude of the earthquake
- 943. • Questions! – What happened to your building? Explain. – What type of design did you use? Copyright © 2010 Ryan P. Murphy
- 944. • It may be time to think outside of the box.
- 945. • Not a box.
- 946. • Not a box.
- 947. • Not a box.
- 948. • Not a box.
- 949. • Not a box.
- 950. • Not a box.
- 951. • Not a box.
- 952. • Not a box.
- 953. • Not a box.
- 954. • Not a box attached to the ground
- 955. • You can now complete these questions.
- 956. • You can now complete these questions.
- 957. • Could investigate volcanoes for this question as well as earthquakes.
- 960. • Earth Quake Drill: “Drop, Cover, and Hold on.” – http://www.youtube.com/watch?v=LP57C0LITrc
- 961. New Area of Focus: Tsunami’s
- 962. • Tsunami and Earthquakes Copyright © 2010 Ryan P. Murphy
- 963. • Review: How are Tsunami‟s and earthquakes related? Copyright © 2010 Ryan P. Murphy
- 964. Tsunami: An ocean wave generated by a submarine earthquake, volcano or landslide. - Copyright © 2010 Ryan P. Murphy
- 965. Tsunami: An ocean wave generated by a submarine earthquake, volcano or landslide. A tsunami can travel across whole oceans. Copyright © 2010 Ryan P. Murphy
- 966. • Animation showing the 2004 Indonesian Tsunami traveling across the Indian Ocean after an earthquake.
- 967. • Location of the earthquake that caused the Japanese Tsunami of 2011
- 968. • Location of the earthquake that caused the Japanese Tsunami of 2011 Tsunami hit the shoreline in just minutes.
- 970. • Video! Tsunami Footage. – Thousands perished so please be very respectful when viewing. – http://www.youtube.com/watch?v=w3AdFjklR50 – http://www.youtube.com/watch?v=TRDpTEjumdo &feature=relmfu
- 971. • Demonstration! Creating a tsunami by underwater volcanic eruption. •
- 972. • Demonstration! Creating a tsunami by underwater volcanic eruption. • Hold balloon underwater with stick.
- 973. • Demonstration! Creating a tsunami by underwater volcanic eruption. • Hold balloon underwater with stick. Underwater Volcano
- 974. • Demonstration! Creating a tsunami by underwater volcanic eruption. • Pop balloon and make observations.
- 975. • Demonstration! Creating a tsunami by underwater volcanic eruption. • Pop balloon and make observations.
- 976. • Demonstration! Creating a tsunami by underwater volcanic eruption. •
- 977. • Animation of how a volcanic eruption can cause a tsunami.
- 978. • Animation of how a volcanic eruption can cause a tsunami. In the open ocean, the wave goes by quickly with little notice
- 979. • Animation of how a volcanic eruption can cause a tsunami. In the open ocean, the wave goes by quickly with little notice The power of the wave becomes noticeable as the wave approaches shore
- 980. • A tsunami wave is not like an ocean wave. This is a typical ocean wave.
- 981. • A tsunami is a surge moving very fast.
- 982. • Demonstration! Seeing the wave increase in size as it approaches land. Mark the water line before
- 983. Pop balloon and mark how far water travels.
- 985. A boat in the open ocean will feel but not really see a large wave.
- 989. Mark how far water travels.
- 990. Height and distance traveled inland by tsunami
- 991. • Indonesia did not have the alert systems for the devastating tsunami of (2004) that killed more than 256,000 people one morning. Copyright © 2010 Ryan P. Murphy
- 993. • Activity! Video: Indonesian Tsunami Footage. – Why can‟t you just swim through it / tread water to survive? – http://www.youtube.com/watch?v=bblk6hD- l5c&feature=results_main&playnext=1&list=PLC DE1E3BA0A9F00B2 Copyright © 2010 Ryan P. Murphy
- 994. • Answer: The currents collect and move debris which makes swimming incredibly difficult and dangerous.
- 997. After Tsunami
- 1000. After Tsunami
- 1008. • What is wrong with calling a Tsunami a tidal wave?
- 1009. • Answer! A tidal wave is misnamed because it does not have to with tides. Copyright © 2010 Ryan P. Murphy
- 1010. • Answer! A tidal wave is misnamed because it does not have to with tides. Tides are caused by the gravity of the moon and sun, not from tectonic forces. Copyright © 2010 Ryan P. Murphy
- 1012. • An earthquake can cause a slippage in the plates.
- 1013. • An earthquake can cause a slippage in the plates. This displaces enormous quantities of water which can cause a tsunami.
- 1014. • Location of Japan earthquake 2011 at a subduction zone along the Ring of Fire. Epicenter of 9.0 Earthquake
- 1015. • Location of Japan earthquake 2011 at a subduction zone along the Ring of Fire. – The plate moved 8 feet closer to the North American Plate in a few seconds Epicenter of 9.0 Earthquake
- 1017. Beneath Ocean
- 1019. • An underwater landslide can also displace large amounts of water and cause a tsunami. Copyright © 2010 Ryan P. Murphy
- 1020. • LaPalma in the Canary Islands: A possible Tsunami threat to the East Coast of the U.S. (Landslide on Island). Copyright © 2010 Ryan P. Murphy
- 1026. • Warning signs! –Earthquake in area. –Bay recedes. –Warning systems. Copyright © 2010 Ryan P. Murphy
- 1027. • Warning signs! –Earthquake in area. –Bay recedes. –Warning systems. Copyright © 2010 Ryan P. Murphy
- 1028. • Warning signs! –Earthquake in area. –Bay recedes. –Warning systems. Copyright © 2010 Ryan P. Murphy
- 1029. Copyright © 2010 Ryan P. Murphy
- 1033. • Warning signs! –Earthquake in area. –Bay recedes. Then rises suddenly. –Warning systems. Copyright © 2010 Ryan P. Murphy