SlideShare a Scribd company logo
1 of 76
Download to read offline
1. Introduction and Background
• Driver performance can be influenced by surrounding vehicle. “It is well known that
the surrounding roads and traffic environment influences driver’s behaviour; for
example, the road environment (surrounding landscape, road characteristics), traffic
composition (cars and heavy vehicles) affects driver’s desired speed, lane changing
behaviour, lateral positioning, and overtaking behaviour” (Antonson, H., 2009;
Olstam, J. 2009; Moridpour, S et al., 2010).
• There is also substantial research about other influencing factors such as distraction,
fatigue, and personality on driving performance, but could something as simple as the
lane position of another vehicle influence your performance.
1.1. Aims & Objectives
AIM: To investigate the interaction between surrounding driver behaviours and driving
controls.
OBJECTIVES: are to determine:
1. The extent to which a lead driver’s behaviour influences driving performance and
vehicle control of a following driver on (Rural roads)
2. Which lead vehicle type has greater influence on drivers’ performance and vehicle
control? (Car vs HGV)
3. Who is likely to be more affected by lead vehicle aggressive driving behaviour? (Male
driver vs female driver)
4. Research Methodology
Simulator Validity
• Ideally this study will require the simulator validity to be closely related to real
world driving in order to consider the simulator as an adequate tool.
• Selection of simulator is based on trade-off between (validity and controllability)
Participant Sample
• Findings show that young drivers aged 17-25 are particularly prone to have
relatively more accidents than other driver (Clarke, D et al., 2006). The
characteristics of young driver accidents includes: accidents on single carriageway
rural roads; loss of control; excess speeding; accident during darkness (Clarke, D et
al., 2006).
• Male drivers have more accidents compared to their female counterpart (Clarke, D
et al., 2006; Jiménez-Mejías, E et al., 2014).
• 20 young drivers (10 males and 10 females) will be recruited for this study. This
sample size was informed by a similar driving simulator study on the comparison of
driving styles (Pampel, S. M., et al., 2015).
3. Literature Review
The idea behind this study is connected to earlier road safety paradigm and research
carried out between 1950 and 1970 which tried to establish the cause of accidents
as being “Road user, or the vehicle, or the road” (Hagenzieker, M.P et al., 2014).
References
 Antonson, H., Mårdh, S., Wiklund, M., & Blomqvist, G. (2009). Effect of surrounding landscape on driving behaviour: A driving simulator study. Journal of Environmental
Psychology, 29(4), 493-502.
 Bella, F. (2005). Validation of a driving simulator for work zone design. Transportation Research Record: Journal of the Transportation Research Board, 1937(1), 136-144.
 Clarke, D. D., Ward, P., Bartle, C., & Truman, W. (2006). Young driver accidents in the UK: The influence of age, experience, and time of day. Accident Analysis & Prevention,
38(5), 871-878.
 Hagenzieker, M. P., Commandeur, J. J., & Bijleveld, F. D. (2014). The history of road safety research: A quantitative approach. Transportation research part F: traffic
psychology and behaviour, 25, 150-162.
 Jiménez-Mejías, E., Prieto, C. A., Martínez-Ruiz, V., del Castillo, J. D. D. L., Lardelli-Claret, P., & Jimenez-Moleon, J. J. (2014). Gender-related differences in distances travelled,
driving behaviour and traffic accidents among university students. Transportation research part F: traffic psychology and behaviour, 27, 81-89.
 Moridpour, S., Rose, G., & Sarvi, M. (2010). Effect of surrounding traffic characteristics on lane changing behavior. Journal of Transportation Engineering, 136(11), 973-985.
 Olstam, J. (2009). Simulation of surrounding vehicles in driving simulators.
 Pampel, S. M., Jamson, S. L., Hibberd, D. L., & Barnard, Y. (2015). How I reduce fuel consumption: An experimental study on mental models of eco-driving. Transportation
Research Part C: Emerging Technologies.
IS VEHICLE CONTROL AFFECTED BY SURROUNDING VEHICLES? (A DRIVER SAFETY PERSPECTIVE)
Name: Adesina AdelusiName: Adesina Adelusi
MSc (Eng) Transport Planning & Engineering
Email: ts14aoa@leeds. ac.uk
Supervisor: Dr Daryl Hibberd
Road type Lead vehicle type Following vehicle driver
Rural road Car Male
Heavy vehicle Female
2. Experiment Design
• The desktop driving simulator experiment design as described in Table 2 includes a
road type, traffic composition and a series of traffic events being presented to the
participants.
• There are two main scenario where the traffic events will be presented to the
participants . Each scenario should last about 20 minutes including a 5-10 minutes
familiarization time.
• A distraction event is also being considered.
Simulator drive Scenario car vs car Scenario car vs HGV Scenario Events
Participants will drive
on a Rural road
Base line (normal
drive) and
treatment drive
(events drive)
Base line (normal
drive) and treatment
drive (events drive)
Aggressive driving
behaviour and violation
including:
• Speeding & overtaking,
• Weaving (drink & drive)
• Running the stop sign.
*Distraction sub task?
5. Conclusion
• The outcome of this study is expected to follow similar trends as in previous studies
on the effects of driving behaviour on other road users.
• It will be interesting to observe the pattern of the data collected.
• Male drivers are expected to react differently to female drivers while heavy vehicles
are expected to have more effect on participants driving performance.
• Aggressive
behaviour and
• violation
• Rural roads
“accounts for 2/3
of road deaths in
the UK” (RRCGB,
2013)
• Cars
• Heavy Vehicles
• Longitudinal
control
(Headway)
• Lateral Control
(Lane change/
positioning)
Vehicle
Control
Surrounding
Vehicles
Driver
behaviour
Road type
Figure 5, Factors contributing to young drivers accident (RRCGB, 2011). Figure 6, Accident involving young car drivers aged 17-24 in 2012 per million
population (RRCGB, 2012)
Figure 3, Interaction contributing to accident cause (Lai, 2014). Figure 4, Comparison of available experiment methods (Lai, 2014).
Figure 2, Desktop driving simulator and its capabilities
Figure 1, Typical driving situation on a rural road in the UK (Riley, 2014).
Table 1: The fundamental basis for this research
Table 2: Experiment design to be implemented in the driving simulator
Experiment
Design
Participant
Recruitment
Simulator
Data
Collection
Data
Analysis
Understanding Choice of Departure Airport and its Relation to Surface Access
A Case Study of London Gatwick
and London Stansted Airports
Problem:
Currently, airport surface access in
the UK is heavily reliant on trips by
private car, which has resulted in
congestion on local road networks
and raised levels of pollution from
vehicle emissions.
57.2%
42.6%
Mode Share to London Gatwick Airport
Private Transport Public Transport
48.3%51.5%
Mode Share to London Stansted Airport
Private Transport Public Transport
 Both airports are the artery for short haul and
point to point flights across Europe which may
have similar travel pattern.
 Majority of the catchment area of both airports
are from South East of England.
 Both airports have a good score in public
transport mode share!
 To understand what is most important to air
passengers when making their travel decisions.
 To understand how the current surface access to
London Gatwick and London Stansted airports
influence passengers on selecting departure airport.
 To understand the relationship between
demographics of airport passengers and their choice
of departure airport with their preferred mode of
transportation.
 To model the current car parking charges and public
transport fares at both airports and evaluate the
effects on mode shares.
Research Objectives
Methodology
 Structured interviews to be performed on individuals
particularly flown from either two of the survey airports to
collect demographic information such as age, car ownership etc
with their respective transportation mode to airport. Besides
that, comments from respondents to gain insight into the current
issues related to surface access to airport that are not known to
the researchers.
 Data can be collected either in the departure lounge of airport
or in the train (provided with access permission), or from streets
of both airports catchment area if access to the restricted area
is denied. Sampling methods are carefully evaluated to avoid
sampling bias.
 Passengers Survey and Catchment Analysis data from UK Civil
Aviation Authority (CAA) could be used as Revealed Preference
(RP) data to provide deeper understanding regarding the
preference of departure airports.
 Fares information such as airport parking charges and public
transportation fares can also be collected through related
authority and online.London Gatwick and London
Stansted Airports?
Supervisor: Bryan MatthewsVincent Chan
Best P.T. Mode
Share to Airport
in the UK!
What makes you buy a
particular air ticket?
Airports
locations?
Cheapest Ticket
from A to B?
Quickest way? Most
convenient?Airlines?
 Choice of destination and airfare are the most important
drivers of airport choice.
 Access costs and time are the least important.
Key findings from previous research:
References
 Budd, T. et al. 2011. Airport surface access in the UK: A management
perspective. Research in Transportation Business & Management. 1(1),
pp.109-117.
 Johnson, D. et al. 2014. Understanding air travellers' trade-offs between
connecting flights and surface access characteristics. Journal of Air
Transport Management. 34, pp.70-77.
The Impact of High Speed Rail on Tourism
− A Case Study of Shanghai
Figure 1: Long-term trend line of Shanghai domestic tourist volume in the past 14 years
0
5000
10000
15000
20000
25000
30000
1999 2000 2001 2002 2003 2004 2005 2006 2007 2008 2009 2010 2011 2012 2013
Poster: YIFAN WANG (ml13y3w@leeds.ac.uk)
Programme of Study: Msc Transport Planning
Supervisor: BRYAN MATTHEWS
Figure 2: High Speed Rail in Shanghai
Background
Most researches about the impact of High Speed Rail (HSR) on
tourism have focused on Europe (e.g. France and Spain), and the
major direction of these studies explores whether the HSR service
can be a key factor to influence the choice of the destination for
tourism (Francesca et al., 2015; Marie et al., 2014). However, the
study area of the impact of HSR on actual tourist volumes and some
specific tourist travel behaviour is rarely discussed.
HSR is developing rapidly in China, especially in several mega cities,
such as Shanghai, Beijing, etc., however, there are only a few
studies that refer to this topic, and most of them are just based on
theoretical descriptions. Therefore, my research will mainly
concentrate on whether HSR can affect the tourist travel behaviour
and actual tourist volume in the Chinese tourism market, and how
to make the service better to improve the tourist industry with a
case study of Shanghai.
Objectives
1) Discuss the relationship between HSR and tourism based on a
review of literature.
2) Two sub objectives based on the case of Shanghai:
 Examine the travel behaviour of domestic tourists influenced
by HSR through an online survey.
 Examine the impact of HSR on domestic tourist volume in
Shanghai through the Tourism Background Trend Line (TBTL)
model.
3) Put forward some recommendations to make HSR serve the
tourism market better in China.
Methodology
Proposed scope: The data being used in this case will be
domestic data. According to Francesca et al. (2015) and Marie
et al. (2014), the impact of HSR is mainly to influence domestic
tourists, and this effect will be more significant in China
because there is almost no international HSR lines so far. In
addition, the TBTL model is mostly widely used on domestic
tourism (Li, 2009; Liu et al., 2012; Zhang et al., 2013).
1) Online survey
 Targeted group: people who don't live in but have travelled
to Shanghai at least once in the previous 2 years;
 Proposed key data to be collected (relate to questions):
travel purpose, origin, route choice, transport mode choice,
personal information (e.g. age, income, education, etc.),
travel frequency, travel scope and duration time.
2) TBTL Model
This model is most widely used in domestic tourist market
research in China, which was put forward by Gennian Sun in
1998. The key data we need in this case is the number of
domestic tourist travel to Shanghai every year, which can be
accessed from Shanghai Statistical Yearbook (2000-2014).
The Anticipated Result
According to the references, in most cases, HSR does influence the
destination choice of tourism, therefore, the result of this study is
expected that HSR will have an impact on both tourist travel
behaviour and domestic tourist volume in Chinese tourism market to
some extent.
Main References:
Francesca, P. et al. (2015). High Speed Rail and the Tourism Market: Evidence from the Madrid Case
Study. Transport Policy. 37, pp.187-194.
Marie, D. et al. (2014). Can High Speed Rail Foster the Choice of Destination for Tourism Purpose?
Procedia – Social and Behavioral Science. 111. pp. 166-175.
Liu, C., Wang, L. and Yang, A. (2012). Research on Inbound Tourist Market of Liaoning Province Based
on Tourism Background Trend Line. ICICA 2012, Part 1, CCIS 307, pp. 783-788.
Zhang, W. et al. (2013). Study on the Impact of High Speed Railway on Urban Tourism – Taking Nanjing
as an Example. Economic Geography. 33(7), pp.163-168.
Li, Z. (2009). A Research on the Foundation and Application of the Background Trend Line of Domestic
Tourism in China. Statistics and Information Forum. 24(1), pp.62-65.
Research on Capacity Reduced by Taxi
Picking Up on Curb Parking Facilities
Presenter: Yihang Liu   Email: ml13y5l@leeds.ac.uk    Msc (Eng) Transport Planning and Engineering     Supervisor: Dr. Haibo Chen
Background
According to DFT 
(2013), there were 
an estimated 78 
thousand taxis in 
England and Wales 
at end March 2013 
and the grow ing 
rapidly from 1985 
(see figure right). 
In most major cities, the taxi is a more convenient 
mode due to its speediness, door‐to‐door attribute, 
privacy, comfort, long‐time operation and lack of 
parking fees.
The layout of harbor‐shaped taxi stop has negative 
impact on the road capacity, as the limited number of 
parking space leading the other taxis should occurs 
queuing frequently and block one lanes of the urban road 
(see figure), which causes extra delay and the congestion 
on the links. So that, this work is going to model the 
probability of the queue happened and the road capacity 
reduced. Furthermore, calibration of the formula is 
obtained with the survey data, and validation is 
comparison between the micro‐simulation software 
results and the calculated results.
Objective
This work aims to evaluate the harbor‐shaped taxi stop 
impact on the capacity reduction in urban area and 
obtain a formula to express the rule of actual flow.
Data collection
Time: afternoon peak period
Facility:   video camera
Data category:Spot speed, Arrival flow, Arrival taxi flow, 
Taxi stop time, Taxi stop layout
Methodology
Data Analysis &
Expected Results
The Gamma function should suit for the arrival taxi 
rate and service rate to obtain the variable for the 
next queuing theory.
The probability of with and without queuing should 
be stable, acting as the weight for capacity 
derivation.
After derivation process, the results calculated by 
capacity formula should be close to the micro‐
simulation results.
Acomparative study of Transport InvestmentAppraisal Tools and
their implications on project selection
Yvonne M Keinembabazi (MA Transport Economics) | Dr James Laird (Supervisor) | Dr Astrid Gühnemann (2nd Reader)
4. DATA
5. METHODOLOGY
7. Key Reference
0
5
10
15
20
25
30
35
40
45
50
Engineering
Scores
Local
Consult
Scores
Economic
Scores
Composite
Scores
Quantity
Ranking System
Top Ranked Projects Selected with a $5 Billion Funding
Pool
No. of Projects Selected
Aggregate Jobs Added
(000)
Aggregate GDP Added
(Billion Dollars)
Total Wider Benefit
(Billion Dollars)
r = 1 −
6∗ 𝑑2
𝑛 𝑛2−1
To compare the rankings, the sign of the Spearman correlation will determine
the direction of association between the CBA rankings and GRP+B
rankings.(determining whether they are in agreement or not)
Spearman’s rank correlation coefficient
WEISBROD, G. Incorporating economic impact metrics in transportation project
ranking and selection processes. Annual Conference of the Transportation
Research Board, 2011.
To investigate whether there is a significant difference between
project rankings recommended by BCA and GRP/$
 Are projects with a more inclusive and environmental focus likely to
be neglected when GRP/$ prioritization method is the basis of
investment decisions?
 Does GRP/$ prioritization overlook a substantial proportion of
benefits provided by projects?
 Is GRP/$ prioritization equivalent to Benefit-Cost Analysis?
There is a range of techniques to prioritize transport projects..
Cost- Benefit Analysis (CBA) has been the most commonly used
appraisal tool in Europe, Australia and some states in USA (Benefit-
Cost Analysis). Frameworks differ by country.
CBA challenges; Rule of a half does not measure all economy impacts from projects
Alternative appraisal techniques
 Multi-Criteria Analysis
 Composite rating schemes e.g. Kansas (Engineering, Local consult, Economic)
 Cost effectiveness e.g. ranking based on GVA/£ e.g. England City Deals (Fully
devolved local transport funds);Urban Dynamic Model in West Yorkshire
 Each Appraisal tool has different factor weights which may affect project
selection (Weisbrod, 2011)
Overall
Economic
Impact
Change in
Transport
user
benefits
(CS)
Change in
systems
operating
costs
(PS)
Change in
costs of
externalities
Investment
costs
(Including
mitigation
measures)
3. CASE STUDY: KANSAS, USA
6. COMPARING CBA AND GRP+B RANKNGS
Data from Kansas Department of
Transportation
Systems
operating cost
Investment
Costs
Estimation of
externality costs
Estimation of
user benefits
California Life-Cycle Benefit-Cost Analysis Model
Estimation of costs and benefits over
the appraisal period (20 years)
Apply Discount
rate
(CalTrans=4.0)
Calculation of NPV, BCR and IRR
Presentation of CBA rankings
Presentation of rankings based on
economic impact score (Kansas DOT)
Compare CBA rankings and GRP+B
rankings
• Data on 121
highway
expansion
projects provided
by Kansas DOT
Data Set includes;
 Traffic data
 Highway design
(Speed, length, lanes)
 Highway accident
data
 Project costs
1.MOTIVATION
Kansas Composite Rating Scheme
Local Consult
Score
Economic ScoreEngineering
Score
Based on project
impact on traffic flow
Based on feedback
heard at local
consultation meetings
Impact on state-wide
Gross Regional Product
(GRP) plus value of
personal time and safety
benefits
2. OBJECTIVE AND RESEARCH QUESTIONS
VEHICLE HANDLING WITH SHARED HAPTIC CONTROL
Xianshuchang Wu
Supervisor: Hamish Jamson; Andrew Tomlinson
Institute for Transport Studies, University of Leeds, Leeds, U.K.
E-mail: ts14xw@leeds.ac.uk
WHAT IS SHARED HAPTIC CONTROL? WHY SHARED HAPTIC CONTROL?
Task
Automation
Response
Automation
Haptic
Interface
How does it work?
Hpi
From Pedal Feedback to Steering Feedback
Figure 1. A schematic, symmetric representation of SHC
(adapted from Mulder et al., 2012)
Progress towards Haptic Shared Control
MAIN FOCUS OF THIS WORK
Limitation of Previous Work
METHOD / PATHWAY
Hypothesis
Figure 3. Brief illustration for the main experimental process
Mainly Estimated Dependent Measures
Figure 2. University of Leeds Driving Simulator
Incorporating Transport Network Resilience with Building Information Modelling
Background
What is BIM?
Building Information Modeling (BIM) is a digital
representation of physical and functional
characteristics of a facility. A BIM is a shared
knowledge resource for information about a
facility forming a reliable basis for decisions
during its life-cycle; defined as existing from
earliest conception to demolition. In general, it
is a graphic tool to make projects virtualized
though the whole life-cycle. (e.g. Autodesk Civil
3D and Bently)
What is traffic resilience
1. Resilience of system is a measure of the
speed of its return to equilibrium.
2. The perturbation can be absorbed before
the system converges on another
equilibrium state
 Select an appropriate transport project
which is disrupt by nature– for example dual
carriageway destroyed by flood.
 Using the BIM software to simulate the loss
on a infrastructure caused by a perturbation.
 To Analyze not only the cost on the
infrastructure itself but also the direct and
indirect economic cost for road users in the
whole traffic network cased by perturbation.
 Mainly focus on the transport infrastructure
damage caused by nature perturbation without
casualties. And it can be restructured in short
term.
 Existing infrastructure built with BIM software
participated in before.
Proposed Scope
Methodology
Aims and objectives
BIM software
Cost of
rebuild and
the materials
Xian Wu Msc Transport Planning & Engineering Supervisor: Haibo Chen Second Reader: Daryl Hibberd
Transport
Software
Road users
delay and the
detour
distance
Total Impact
 BIM software can provide the materials needed during the restructured then
calculate the cost for this restructured
 After perturbation the traffic network will be influence continuously influenced
until it is totally repaired. All of the impact by perturbation can be simulated by
transport software. Such as the cost of extra time and longer distane on
passengers and some kind of environmental emissions caused by detour
Institute of Transport Study
What can we know about changing
multi-modal travel behaviour?
—Xiaojun Shao, MSc(Eng) Transport Planning and Engineering
Supervisors: Caroline Mullen, Giulio Mattioli
Background
In National Travel Survey (NTS) 2012, an index chart shows that between
1995/97 and 2012 the average distance of car/van driver trips and passenger
trips has fallen by 7% and 12% respectively. This decline in per capita car
travel has attracted people’s attentions. For instance, a roundtable meeting
organised by the New Zealand Ministry of Transport on this topic was
convened in London on 20 May 2014. They believe that the demand for car
travel is reaching its saturation level, any further growth will give little benefits
for travellers (Lyons and Goodwin, 2014). Therefore, a development of other
modes of transport is necessary in supporting the benefits of travellers.
Meanwhile, although there is a saturation in car use, the traffic congestion
problems still exist. One of the solutions transport policy is seeking for is to
encourage the use of alternative modes of transport, such as cycling and
walking (Ogilvie et al, 2004). For example, some policies such as car sharing
and bike sharing are now influencing people’s travel behaviour by
encouraging people to travel on multi-modes.
For its definition, there are different understandings. Nobis (2006) describes
that all persons who within 1 week use at least two different transport modes
are defined to be multimodal; Kuhnimhof (2006) believes that it is a property of
travel demand. No matter how many definitions exist, the importance of
multimodal travel is to make people rely less on private cars. Therefore, it can
be explained as a characteristic that people use modes other than just the car
across their travel patterns.
But what exactly is multimodal travel?
To help governments and local authorities shed lights on multimodal travel, an
understanding of how people are travelling these days and whether they are
using only one mode are necessary.
Furthermore, two key questions need to be answered:
• Does the NTS provide this understanding?
• How can the NTS or other surveys be improved to give a better
understanding?
Objectives
In realistic, multimodal travel may include every available transport mode, but
in this dissertation, only the choices between three groups will be used, they
are driving a car, using public transport (excluding airlines and ferries),
walking and cycling. Because these are the most common modes people use
to travel inside a city.
Scope
Methodology
The primary methods used to investigate the trend of multimodal travel are
literature survey and questionnaire. The scope of literature survey includes
papers that link multimodal travel to congestion management. For
questionnaire method, there are three steps could be taken in order to fulfil
the investigation:
• Identify the gap and limitation of multi-modal travel in the questionnaire
used in National Travel Survey;
• Determine what questions should be included and provide options for
participants to choose;
• Decide the sample size of the survey and provide the questionnaires online
for students and staff in ITS and other departments.
For the sample size, Peter et al. (2011) had a study on European multimodal
journey, they designed a questionnaire contains 18 questions and put it
online for people to participate. In the end, they have 200 responses in total
which provides an effective result. Therefore, a roughly 200 participants are
expected when doing the dissertation.
The analysis will be done with data mainly from National Travel Survey.
Data
Expected Findings
UNIVERSITY OF LEEDS
Institute for Transport Studies
• The NTS is an established series of
household surveys of personal travel and it
has been running continuously since 1988.
This study will mainly use the data between
2002 and 2012 to analyse the trends.
• NTS data is collected via two main sources -
interviews with people in their homes, and a
diary that they keep for a week to record their
travel. It covers travel by all age groups,
including children.
An example of how British
people travelled in 2012
From literature and data analysis, these are the results I expect to see:
• Develop a method to determine whether people are becoming more
multimodal.
• Multimodal travel can relief traffic congestion to some extent.
• The newly designed questionnaire can more capture people’s mode
choice of travel than the travel diary used in NTS.
Night-time Driving and Distraction
Xue Ding. MSC Transport Planning. Supervisor: Georgios Kountouriotis
E-mail Address: ml13x2d@leeds.ac.uk.
 Night – time driving expose to higher risk to
accident than day time. Number of miles driven
decreases substantially at night compared with
daytime, yet more than half of all traffic deaths
occur after dark.
 Is driving distraction contribute to this increase
in accident?
 This research uses driving simulator to collect the
driving performance data and then compare the
influence of different factors to driving
performance.
Prediction
 Comparing with day-time driving, eye-
movements (PRC) of night-time might rise due to
the dark view.
 Steering wheel reversal rate in bend road is easily
affected by distraction than straight road
 Visual distraction produced by in-vehicle
information system has more significant
influence on SDLP than visual distractionn on
road centre.
References
 Plainis, S., Murray, I. J., & Pallikaris, I. G. (2006).
Road traffic casualties: understanding the night-
time death toll. Injury Prevention, 12(2), 125-138.
 Pettitt, M., Burnett, G. E., & Stevens, A. (2005).
Defining driver distraction. In12th World
Congress on Intelligent Transport Systems.
 Stutts, J., Feaganes, J., Reinfurt, D., Rodgman, E.,
Hamlett, C., Gish, K., & Staplin, L. (2005).
Driver's exposure to distractions in their natural
driving environment. Accident Analysis &
Prevention, 37(6), 1093-1101.
 Merat, N., & Jamson, A. H. (2008). The effect of
stimulus modality on signal detection:
Implications for assessing the safety of in-vehicle
technology.Human Factors: The Journal of the
Human Factors and Ergonomics Society,50(1),
145-158.
Time
Road
Task
Day-time
Night-time
Straight road
Bend road
Visual (Center)
Visual (IVIS)
Count back
Baseline (No Task)
Distraction source % of drivers
Outside person, object. events 29.4
Adjusting radio, cassette, CD 11.4
Other occupant in vehicle 10.9
Moving object ahead 4.3
Other device/object brought into vehicle 2.9
Adjusting vehicle/climate control 2.8
Eating or drinking 1.7
Using/dialing mobile phone 1.5
Smoking related 0.9
Other distraction 25.6
Unknown distraction 8.6
Percentage of driver who cited each distraction
source as contributing to crashed
Total number of
participant
20
Age 20-30
Gender 10 male & 10 female
Driving experience Over 2 years
Preparation before
experiment
Provided with written
instructions about the
experiment
Driving time in
experiment
30 minutes
Methods
University of Leeds driving simulator will be employed to mimic
driving with different factors
Fig. 1. The University of Leeds Driving Simulator
Fig.2. night-time view
in driving simulator
(urban & rural)
• Steering wheel reversal rate
• Standard deviation lateral position (SDLP)
• Percentage of road centre (PRC)
• Data analysis tool: SPSS
• Data analysis method: Repeated Measures
ANOVA
Introduction
 Distraction is “attention given to a non-driving-
related activity. Typically to the detriment of
driving performance”
 Driver distraction plays an important role in
crash
Simulate
SATURN
Scenario 3
Adjusted Capacity
Network
2009 Existing Leeds
OD Matrix
Optimal Signal Plan
from LINSIG
Scenario 1
(Base Scenario)
2009 Existing Leeds
Network
2009 Existing Leeds
OD Matrix
2009 Existing Leeds
Signal Plan
Scenario 2
Adjusted Capacity
Network
2009 Existing Leeds
OD Matrix
2009 Existing Leeds
Signal Plan
Find Optimal
Signal Plan
using LINSIG
Simulate
DRACULA
SATPIG SPATULA
Detailed
Public Transport
Modelling of Bus
Frequencies, Bus
Stop Locations etc.
Adjust the Road
Supply
Condition/Capacity
due to Road Work
in Network.dat
Comparative
analysis
of outputs from
Scenario Runs
SATURN LINSIGDRACULA
2. Data
University of Leeds and Leeds City Council provided:
The SATURN model and data files have been constructed according to
WebTAG recommendations and validated against DMRB guidelines).
6. Scope and Data Analysis
Win Thi Ha , MSc (Eng) Transport Planning & Engineering
Supervisor : Dr Chandra Balijepalli
1. Background and Motivations
• Private and Public Transport Road Users suffer from delays, congestion
and unreliable journey times due to regular road closure to maintain and
improve old infrastructures and road system in the UK to meet the
increasing travel demand.
• More frequently digging up the roads by utility companies (Gas, Water)
• Government recently announced 55 major road schemes and local
transport projects with a further 15 billions spending between 2015-16
and 2020-21.
• Part of proposed 14.8km NGT
(Trolley Bus) route - Otley Road
(A660) section from the Ring
Road (A6120) Roundabout to the
junction of North Lane/Wood
Lane in Leeds, West Yorkshire.
A “quasi” dynamic element will be introduced into runs of SATURN by
modelling three successive AM time periods to include the effect of the
departure time choice.
Literature
Review
• Evaluation of Traffic diversion plans
• Traffic modelling softwares
• Monetary cost of congestion and delay due to road works
Implement
different
scenarios
• Link and Convert output route flows to facilitate interface with DRACULA from
SATURN Assignment O-D route flows using SATPIG and SPATULA programs.
• Adjust Road Capacity on planned road work routes according to diversion plan
• Develop LINSIG model to optimise and coordinate signals within study cordon
area.
Simulation
results and
data
analysis
• Comparative analysis of Modelling Scenarios Results on the effects of the road
work on private vehicles and public transport buses primarily at Micro level.
• Analysis of Measure of Effectiveness on worst congested junctions/ links/ nodes
at Macro level across Leeds Network in general.
Evaluating traffic diversion plan due to road works and assessing the
impact on private vehicles and public transport buses
Institute for Transport Studies
Image © Copyright Descry and licensed for reuse under a Creative Commons Attribution-ShareAlike 2.0
Generic (CC BY-SA 2.0)
In Leeds Area alone during 2012-2013:
• 6,279 road works with average of
4.98 days
• 31,269 days of disruption
Source: Mitchell, 2014
(Leeds City Council Report)
• 830 Zones, 3034 Nodes.2009 Leeds Network
• 467,630 Total Flow, Three AM time periods
(7-8 , 8-9 and 9-10 AM).
2009 Leeds Trip Matrix
• Route , Traffic volume count, Speed, Distance.2009 Validation Count
References:
Goodwin, P. 2005. Utilities’ street works and the cost of traffic congestion. Research Report February,p.37. Centre for Transport &
Society, University of the West of England, Bristol.
Mitchell, P. 2014. Leeds Permit Scheme for Road Works and Street Works. Annual Report 2012-13.
Zhou, H. 2008. Evaluation of Route Diversion Strategies Using Computer Simulation. Journal of Transportation Systems Engineering
and Information Technology. 8(1),pp.61–67.
Cordon Network
Number of Zones 34
Number of Nodes 88
Simulation Links 192
Number of Signal Stages 30
Number of Roundabouts 3
Priority Junctions 52
Traffic Signals 9
Total Traffic Flow (Actual) 3357
4. Objectives
• To Minimise the impact and effect on private vehicles and public
transport buses due to road work.
• To Optimise signals of roundabouts and junctions within study
cordon area.
• To Understand positive/negative impacts of optimised signals by
analysing computer traffic simulation softwares outputs
• To Evaluate the traffic diversion plan and the effect on private and
public transport buses at Micro, Meso/Macro Levels.
5. Methodology
• Methodology itself is generic and widely used in local, regional &
national Traffic Management Centers.
• Implementing 3 different scenarios based on 2009 Leeds Network,
Signal Plan and Trip Matrix data.
3. Study Cordon Area
.
Figure 1: Cordoned off Leeds Network (Maps created using ArcGIS® software by Esri)
Email: ts13wth@leeds.ac.uk
In the UK:
• 7 millions days of disruption
• Valued at £1bn – £4.3bn
(Reports & Studies widely quoted)
• 5-10% of total congestion
Source: Goodwin, 2005
Special
events /other
5%
Bottlenecks
40%
Road works
10%
Traffic Incidents
25% Poor traffic
signal
timing
5%
Bad weather
15%
Source: www.ops.fhwa.dot.gov
What Safety Policies Should Accompany the Goal of Achieving More
Sustainable Urban Mobility: An Examination of Problems and
Policies in Europe
Taner Ulug, (MSc) Transport Planning and Engineering
Supervisor: Prof Oliver Carsten
UNIVERSITY OF LEEDS
Background
•European Union plans to achieve an overall
sustainable transport system in order to decrease
pollution and congestion.
•Sustainable urban mobility is a vital part of this
plan.
•About 40% of all road accident fatalities in the EU
occur in urban roads.
•11,000 deaths in 2012 on EU urban roads.
•65% of all urban road fatalities in the EU are
Vulnerable Road User (VRU) fatalities.
•A large proportion of serious road injuries occur
in urban areas and and involve VRUs.
•VRUs: Pedestrians + Pedal Cyclists +
Motorcyclists&Moped Users
•VRU safety needs to be improved in order to
achieve sustainable urban mobility.
United Kingdom‐Urban Source: CARE Database
Objectives
•To determine best performing three EU member
countries in terms of VRU safety on urban roads since
year 2000.
•To determine for which three main VRU modes these
countries have performed beter.
•To discuss the VRU safety policies which have possibly
contributed to the good performance of these
countries.
Data Collection
•Secondary data will be acquired for years since 2000.
•Community Road Accident Database(CARE) will be 
utilized for this purpose.
Methodology
1. Analysis of annual changes in fatalities as reported
by transport mode in EU countries on urban roads,
rural roads, and motorways.
Analysis of annual changes in VRU fatalities by age
groups and gender.
2. Determination of best performing three member
countries in terms of VRU safety with a focus on
urban roads.
3. Determination of how these countries has
performed when other parametres such as age
groups, gender and VRU transport modes are
considered in order to understand the exact issues
these countries have tackled well.
4. Investigation of VRU safety policies implemented
by these countries particularly before the years
when there have been significant achievements
regarding the issues mentioned above.
Expected Outcome
The best performing three EU countries are expected
to be the SUN(Sweden‐United Kingdom‐Netherlands) 
countries, but Denmark may replace the Netherlands.
Successful policies are possibly developed under the
following VRU safety issues;
•Investing in safer urban infrastructure
•Use of modern technology for enhanced urban road
safety
•Traffic rule enforcement and road safety education
Photograph Sources: Road Safety in the European Union, Vademecum_2015
As a consequence of the arid conditions, PM dispersion from the
region is hindered and secondary process such as wind driven
resuspension dominate.
This means that while gas-phase species associate with their primary
sources (e,g. traffic levels), PM does not.
In 2010 air pollution was estimated to
have caused over 400,000 premature
deaths in Europe.
Ambient air pollution was estimated to
cause 3.7 million premature deaths
worldwide in 2012.
2. MECCA
Mecca is a major centre for tourist and
religious pilgrimage in Saudi Arabia.
As in many cities, local air pollution is
affected by multiple inputs, including
emissions from traffic, construction work,
industrial practices, etc.
However, arid conditions make it
especially sensitive to particulate matter
(PM) pollution.
3. PROJECT DATA
In this project Air Quality data (including
CO, NO/NO2, and PM10) and PM
compositional data (anions, cations,
and metals) collected by Professor Turki
Habeebullah and colleagues at Umm
Al-Qura University, Makkah, will be
analysed with the intention of extending
understanding of local air quality in the
region.
4. OBJECTIVES/METHODS
The study will proceed as follows:
i) Use R and R package openair to characterise local air
quality data, and
ii) Use specialist software, including US EPA UNIMIX , to conduct
the first source apportionment of the dataset.
Trophius Kufanga. Msc Transport Planning & the Environment. ts13tk@leeds.ac.uk
References:
5. RESULTS
6. NEXT STEP: SOURCE APPORTIONMENT
0
1
2 w s
3
4
5
6
W
S
N
E
mean
PM10
500
1000
1500
2000
2500
3000
3500
0
1
2 w s
3
4
5
6
W
S
N
E
mean
NO2
10
20
30
40
50
60
Improved Air Quality Management for Makkah Al-Mukarramah (Mecca),
Source Apportionment of Air Quality and Particulate Composition Data
Supervisor: Dr. Karl Ropkins
2nd reader: Dr. Haibo Chen
Some Preliminary Findings:
The Saudi Arabian PM10 standard 340 ug.m-3 daily average,
not to be exceeded more than 24 times a year. In 2012,
this was exceeded 32 times.
However, unlike in UK, where PM10 standards are also regularly
exceeded, this was not associated with NO2 exceedances,
highlighting the different nature of the air quality problems in
Makkah.
0
50
100
150
200
250
Source#1
Cl
SO4
NO3
NO2
PO4
NH4
Br
F
PM
10
Source compositions for run # 2 - Linear Scale.
0
10
20
30
Source#2
Cl
SO4
NO3
NO2
PO4
NH4
Br
F
PM
10
0
0.5
1
1.5
2
Source#1
Source Contributions for run # 2
09/15/2012
09/27/2012
10/09/2012
10/27/2012
11/09/2012
12/03/2012
12/22/2012
01/26/2013
02/07/2013
02/19/2013
03/09/2013
05/20/2013
08/06/2013
0
2
4
6
8
10
Source#2
09/15/2012
09/27/2012
10/09/2012
10/27/2012
11/09/2012
12/03/2012
12/22/2012
01/26/2013
02/07/2013
02/19/2013
03/09/2013
05/20/2013
08/06/2013
UNMIX source
apportionment
of PM
composition
trends, which
are not affected
by resuspension
will help us to
identify PM
sources.
By contrast, PM10 associates
with higher wind speeds, in
particular from the South East
Many gas phase species, like
NO2,associates with low wind
speeds, an indication of local
stagnant air related sources
Hitchcock, G., et al. (2014) Air Quality and Road Transport. Impacts and solutions. RAC
Foundation. London, United Kingdom.
WHO (2014) Ambient (outdoor) air quality & health
High Volume
Systems
(HVS PM Samplers)
Ion Chromatography
Anions and Cations
1. GENERAL BACKGROUND
・Categorize questioners
→social economics
(gender, age and employment state)
→general impression of PTP
(how does PTP make you feel)
→interest for PTP/level of satisfaction of PTP
(how are people satisfied with PTP)
→modal changes
(how do people change into use of public
transport)
→interest for sustainability
(continuous of new travel behavior)
・Using regression analysis
→how is effectiveness of PTP related with
questioners?
→For example, how much effectiveness of PTP is
linked with age or gender? Is there any difference
in the effectiveness between women and men?
・To know who changes travel behavior
・To know how they change travel behavior
・To know why they change travel behavior
・To know how the impact of PTP can be measured
・ Follow up survey to determine the influence of PTP on travel behavior
・10 different cities in the UK from 2009 to 2014
・4786 data of PTP in those areas
・7-15% decrease in car trips can be expected
・12% reduction in the mean distance travelled by car
・increases in walking, cycling and public transport trips of between 14% and 33%
・effectiveness of PTP would last about 3 years
Because of increase in cars…
→environmental problems (increase in CO2)
→health problems (effect on respiratory)
→traffic problems (congestion)
Introduction of PTP
What is PTP ?
・PTP is one of the methods of soft measures
・Through one to one conversation with trained field officers
・Officers encourage and motivate people to change their travel behavior by giving
provision of information on how to travel sustainably
・Useful information and good are given such as time table for each person or free
trial public bus tickets
Who changes travel behavior and why ?
Tomoko Amahori : MSc Transport Planning and the Environment Supervisor: Jeremy Shires
Backgrounds
Effectiveness of PTP
Data of PTP
Objectives
Methodology
Can Development on the Green Belt be Sustainable?
BACKGROUND
Green belt is open space used for forestry and agriculture.
In spite, its importance for environment, some local
authorities change the land use for construction of
residential, industrial and other projects. One of the most
common reason for changing land use is to facilitate the
economic growth of the region and meet increasing
demand for affordable houses among people at the
expense of the Green belt. This study will attempt to
measure Sustainability of the Development on the Green
belt and assess Transport impact. The housing development
of 4020 dwellings on the North of Clifton Moor and A1237
will be considered for assessment. It will be located on 330
of acres of Greenbelt land.
AIM
To investigate whether development on the Green belt can be
Sustainable.
OBJECTIVES
• To assess Sustainability of the Development on the Green
belt
• To assess the Transport Impact Assessment on New
Housing proposal on the North of York on the Green belt.
METHODOLOGY
• Review of the polices, guidelines and planning 
documents related to Transport Assessment and 
Sustainability Assessment.
• Define criteria and alternatives in MCA .
• Define appropriate technique of MCA 
• Multi criteria analysis of Sustainability.
• Analysis of findings from MCA.
• Analysis of existing SATURN road network of York 
City.
• Estimation of new trip projected values for trip rates 
with the use of TRICS, TRIPS and TEMPRo software.   
• Updating SATURN OD matrix and network files.
• Assessment of public transport accessibility.
• Traffic Impact Assessment of the Proposed 
Development with SATURN software.
• Development of recommendations for mitigation 
from impacts. 
EXPECTED RESULTS
• Identification of impact from Transport.
• Sustainability appraisal of the development on the Green
belt.
Supervisor: Dr. Chandra Balijepali                  Student: Talgat Abdrakhmanov      Email: ts14ta@leeds.ac.uk
Preparation of 
Transport 
Assessment
Final 
Transport 
Assessment
Reducing the 
need to travel
Maximizing 
Sustainable 
accessibility
Dealing with 
Residual trips
Mitigation 
measures
References: 1. Multi‐criteria analysis: a manual. DCLG, 2009. 2. Guidance on Transport Assessment. TfL, 2007.
Policy context
Existing Site function
Proposed Development definition
Identification of Impacts and mitigation measures
NATA Assessment
Capacity Assessment
Identify problems
Preliminary design of mitigation measures
Scoping study
Initial appraisal consultation form
Scoping study
Agreement of methodology
Background data
Existing travel patterns by mode
Accident history
Environmental base case
Passenger transport services
Committed development
Committed transport network 
charges
Parking availability
Refinement step 2
Where appropriate
Additional support
Alterations to ITB measures
Refinement 1
(where appropriate)
Seek to reduce residual trips
Review:
Development mix
Scale of development 
phasing
Measures to influence Travel behavior
Parking availability and Management
Improvements to non‐car model
Travel plan initiatives
Capacity Management
Network alterations
Assessment
Trip generation by mode
Accessibility Assessment
Assignment of trips
Source: Transport Assessment Guidance. TfL, 2007.
5. Expected Outcomes4. Preliminary Results
 Global travel demand contributes to the increase of fuel
consumption in airlines.
 U.S. airlines are the main contributors (18 billion gallons).
 No alternate energy, so policy-making to manage the fuel
demand is important.
Decomposition Analysis of Aviation Fuel Demand of U.S. Airlines
Shan-Che Wu | Institute for Transport Studies | Transport Planning and Engineering | Supervisor Zia Wadud
1. Background
Year Passenger (million) Freight (million tons)
1991 461.2 9.0
2013 748.5 12.3
Growth 62% 37%
(Airlines in the U.S.)
2. Objectives
 To find some components linking the travel with fuel
consumption
 To decompose the fuel demand into various components
with decomposition model
 To initiate analyzing the freight-related factors
 To set a freight forecast demand model
Multiplicative decomposition
-
5
10
15
20
25
1991 1994 1997 2000 2003 2006 2009 2012
Fuel(billiongallons)
Fuel consumption of airlines in the U.S.
Total Passenger in Passenger aircraft
Belly freight Freight in freight aircraft
3. Index Decomposition Analysis
 Fuel = Population(POP) × REV.ton.miles per capita ÷ Load factor × Efficiency
𝐹𝑢𝑒𝑙 = 𝑃𝑂𝑃 ×
𝑅𝑇𝑀𝑃 𝑃
𝑃𝑂𝑃
×
𝐴𝑇𝑀𝑃 𝑃
𝑅𝑇𝑀𝑃 𝑃
×
𝐹𝑢𝑒𝑙(𝑃𝑃)
𝐴𝑇𝑀𝑃 𝑃
--- passenger in passenger aircraft
+𝑃𝑂𝑃 ×
𝑅𝑇𝑀𝐹 𝑃
𝑃𝑂𝑃
×
𝐴𝑇𝑀𝐹 𝑃
𝑅𝑇𝑀𝐹 𝑃
×
𝐹𝑢𝑒𝑙 𝐹𝑃
𝐴𝑇𝑀𝐹 𝑃
--- freight in passenger aircraft
+𝑃𝑂𝑃 ×
𝑅𝑇𝑀𝐹(𝐹)
𝑃𝑂𝑃
×
𝐴𝑇𝑀𝐹(𝐹)
𝑅𝑇𝑀𝐹(𝐹)
×
𝐹𝑢𝑒𝑙(𝐹𝐹)
𝐴𝑇𝑀𝐹(𝐹)
--- freight in freight aircraft
 Logarithmic Mean Divisia Index (LMDI) is of better performance
Additive decomposition
and∆𝐹𝑢𝑒𝑙 = 𝐹𝑢𝑒𝑙𝑡 − 𝐹𝑢𝑒𝑙0
𝐹𝑢𝑒𝑙 𝑡
𝐹𝑢𝑒𝑙0
=
𝑃𝑂𝑃𝑡
𝑃𝑂𝑃0
×
𝑅𝐸𝑉. 𝑡𝑜𝑛. 𝑚𝑖𝑙𝑒𝑠 𝑝𝑒𝑟 𝑐𝑎𝑝𝑖𝑡𝑎 𝑡
𝑅𝐸𝑉. 𝑡𝑜𝑛. 𝑚𝑖𝑙𝑒𝑠 𝑝𝑒𝑟 𝑐𝑎𝑝𝑖𝑡𝑎0
÷
𝐿𝑜𝑎𝑑 𝑓𝑎𝑐𝑡𝑜𝑟𝑡
𝐿𝑜𝑎𝑑 𝑓𝑎𝑐𝑡𝑜𝑟0
×
𝐸𝑓𝑓𝑖𝑐𝑖𝑒𝑛𝑐𝑦𝑡
𝐸𝑓𝑓𝑖𝑐𝑖𝑒𝑛𝑐𝑦0
∆𝐹𝑢𝑒𝑙 = ∆𝐹𝑢𝑒𝑙 𝑃𝑂𝑃 + ∆𝐹𝑢𝑒𝑙 𝑅𝐸𝑉.𝑡𝑜𝑛.𝑚𝑖𝑙 𝑝𝑒𝑟 𝑐𝑎𝑝𝑖𝑡𝑎 + ∆𝐹𝑢𝑒𝑙1/𝐿𝑜𝑎𝑑 𝑓𝑎𝑐𝑡𝑜𝑟 + ∆𝐹𝑢𝑒𝑙 𝐸𝑓𝑓𝑖𝑐𝑖𝑒𝑛𝑐𝑦
∆𝐹𝑢𝑒𝑙 𝑝𝑜𝑝 =
𝐹𝑢𝑒𝑙𝑡 − 𝐹𝑢𝑒𝑙0
𝑙𝑛𝐹𝑢𝑒𝑙 𝑡 − 𝑙𝑛𝐹𝑢𝑒𝑙0
× (𝑙𝑛𝑃𝑜𝑝𝑡 − 𝑙𝑛𝑃𝑜𝑝0)
 Revenue ton miles per capita is the most key factor.
 Efficiency has been gradually improved to save fuel
because of management and technology
 Hope to link the aircraft freight demand with
economic factors
 Fare, journey time, and income might be the most
influential parameters in demand model.
Decomposition analysis summary
1. Revenue ton mile per capita always increasing except 2000-2002 (911 terrorist attack) and 2006-2008 (economic recession).
2. Load factor and fuel efficiency slow the growth rate of fuel use.
3. Most of the changes in fuel consumption due to changes in revenue ton mile per capita.
-6
-3
0
3
6
Changeinfuelconsumption(billion
gallons)
POP RTM/POP 1/Load factor Fuel/ATM
Additive and Multiplicative
decomposition in 3-year
band: 1991-2011
0.8
1
1.2
POP
RTM/POP
1/Load factor
Fuel/ATM
1991-1993 1994-1996 1997-1999 2000-2002
2003-2005 2006-2008 2009-2011
Data sources: Bureau of
Transportation Statistics,
Department of
Transportation in U.S.
Evolution of fuel consumption and its components: 1991-2013; 1991=1.0
0.0
0.5
1.0
1.5
2.0
2.5
3.0
1991 1994 1997 2000 2003 2006 2009 2012
Index(1991=1.0baseyear)
POP RTMP(P)/POP RTMF(P)/POP RTMF(F)/POP RTMP(P)/ATMP(P)
RTMF(P)/ATMF(P) RTMF(F)/ATMF(F) Fuel(PP)/ASM(P) Fuel(FP)/ATMF(P) Fuel(FF)/ATMF(F)
Fuel (PP) Fuel (FP) Fuel (FF)
Causative Factors of Accidents on Curve Negotiations: A Case Study of Malaysia
Institute for Transport Studies
Seri Ashikin Binti Sofian, MSc.Eng Transport Planning & Engineering Supervisor: Dr. Samantha Jamson Co-Supervisor: Dr. Frank Lai
• Traffic accidents rank fifth among the leading cause
of deaths in Malaysia.
• It is estimated that, one quarter of all accidents
happen in Malaysia occur while driving around
curves and in most cases contribute to fatal
accidents. Therefore, it is vital to understand the
factors lead to an accident that occurs on a curve.
• IRTAD report 2014, based on willingness-to-pay
estimation, road accident accounted for
approximately 1.6% of Malaysia national GDP.
• The accident rates in road curves are about 1.5 to 4
times higher than in straight roads
(Zegeer, Stewart, F. M. Council, Reinfurt, &
Hamilton, 1992).
• The accident severity of curve related crashes is
higher than those occurring in straight roads
(Glennon, Neuman, & Leisch, 1985).
• Accidents are not uniformly distributed on the road
network, high accident locations are a clear
indication that, besides human factor, there exist
other influencing parameters that are characterized
by the road (Lamm et.al, 2007).
• The curve's location chooses for this study are
identified from the 186 blackspot locations treated
under the ‘Rehabilitation Works Programme’ done
by the Public Works Department of Malaysia
(PWDs) from year 2009 to 2014.
• Seven (7) locations of curve are identified from the
blackspot locations and data collected from this
location are gathered through the POL form obtain
from the Royal Malaysian Police (Traffic
Department).
Background of Study Determine the factors that contribute to the accident
occurrence in a curve
Identify the characteristics to the cause of the
accidents occurrence on a curve
Recommendation for road accident on curve
treatment
Objectives
Research Questions ?
“What are the factors that have influenced
for accidents to happen on a curve”
“Is there a relationship between
demographic and road factors which
contribute to an accident on curve”
Theoretical Framework
Demographic
• Age
• Gender
Road
• Length of
curve
• Radius of
curve
Numbers of
fatal accident
Methodology
Null Hypothesis
• Road factors contribute to an event of an
accident on a curve
• Demographic factors influence the driving
behaviour and the occurrence of the
accidents on the curve
• Both, demographic and road is contributory
factors in an accident on a curve
Alternative Hypothesis
• Road factors does not bring impact to
the occurrence of an accident on a
curve
• Demographic factors do not influence
the driving behaviour
• Both factors fail to demonstrate
relationship their behaviour towards an
event of an accident on the curve
Statistical Analysis
All accidents data obtained from the Public Works Department of Malaysia (PWD Malaysia) and POL Form from
Royal Malaysian Police will be put through a data cleansing to check its validity and reliability. This is also done in
order to find the demographic information such as age and gender of the driver of the vehicle. This analysis will
use the SPSS package in order to look into the relationship between the variables by using the regression
models. The variables of road factors will be studied from seven (7) curve’s location from the blackspot lists,
whereas for the demographic factors, 2 locations from this will be analysed.
Data Cleansing
• To check on the
reliability and
validity of the
data
Information
Analysis
• Seek demographic
information from
the POL form.
• Geometry of the
location (length
and radius)
Factor analysis
• Correlation
between factors
• Linear Regression
(Binary Logistic)
Results
• Significant level
of the hypothesis
testing
Expected Outcome
• It is expected that the demographic and road factors, will be the factor in an accident on
curve negotiation. Other than that, a significant relationship can be seen from both factor and
relate to the accident occurrence on a curve.
• The findings from this study is yet to be used in the future in order to rectify the accident
problem that mostly occurs on a curve. On the other hand, this study can suggest for the
treatment and countermeasure to be taken in the road safety enhancement with a focus on a
curve negotiation.
Kuala Lumpur – Karak Highway
D e v e l o p i n g A c c e l e r a t i o n M o d e l s
C o m b i n i n g M u l t i p l e D a t a
Stavros Papadimitriou (Author); Charisma F. Choudhury (Supervisor); Daryl Hibberd (2nd Reader)
B A C K G R O U N D
I-80 Study Area Schematic
and Camera Coverage
Ø Driver behavior data from an artificial scenario in a controlled
environment may not resemble driver behavior that is displayed
in a comparable real world situation (Carsten et al., 2011)
Ø Calibration and validation in driving simulators generally
performed at a macroscopic level (Sakia & Hoogendoorn, 2008) and
studies mainly generate macroscopic outputs, (Olstam, 2005)
ignoring driver specific information.
1 M E T H O D O L O G Y
d a t a
Driving Simulator
Schematic of Road Section
ü X and Y coordinates every
1/10th sec for acceleration
decisions of drivers;
ü over a stretch of 1/2 km for
an hour (between 16:15­
17:15);
ü similar traffic density
(roughly 1600-2400 vph);
ü 40 subject drivers are
recorded;
m o d e l l i n g a p p r o a c h
E X P E C T E D R E S U L T S
c a s e s t u d y
3.2
3
4
NGSIM Driving Simulator
C r o s s – C l a s s i f i c a t i o n A n a l y s i s
S t a t i s t i c a l A n a l y s i s
Maximum Likelihood Method (MLM)
Models format
Responsen (t)= Sensitivityn (t-Tn) x Stimulusn (t- Tn)
Where,
-  t = time of observation,
-  Tn = reaction time for driver n,
-  Responsen (t) = acceleration applied at time t
STATA
Estimation method
Statistical software
Models performance
& comparison
Tests of statistical significance (e.g. t-statistics)
3.1
Ø Real-life trajectory data are really important so far for calibration
and validation of microscopic models. However, most studies
focus on the investigation of lane changing (Thiemann et al., 2008;
Ahmed, 1999)
2
Simulation Environment
Physically Driving
Two data sources will be used in this research:
(1)  The real-life traffic detailed trajectory data collected
from Interstate 80, CA, US (NGSIM 2005);
(2)  The experimental data collected from the University
of Leeds Driving Simulator (UoLDS).
Microscopic data collected from,
(i)  Real trajectory data from physically driving;
(ii)  Driving simulator data from a simulated
environment using a driving simulator.
•  Leader speed
•  Time headway
•  Type of vehicle
•  Reaction time etc.
•  Leader speed
•  Gender, Age
•  Type of vehicle
•  Reaction time etc.
§  Statistical comparison of the models will indicate significant
differences in common model parameters (e.g. leader speed,
headway, subject vehicle type);
§  The combined model will better replicate the traffic compared to
models developed using single data sources.
The objective of this dissertation is to develop and compare the
performance of the acceleration models using two sources
microscopic data, as well as testing a combined model using both
data sources. Models will take into account network topography and
traffic conditions.
•  Model 1 uses only traffic video data;
•  Model 2 uses only driving simulator data;
•  Model 3 uses both.
1000m1000m
2000m
503m(1650feet)
Study Area
7 video
cameras
O B J E C T I V E S
EMERGENCY TRANSPORT PLANNING FOR MATERNAL HEALTH IN RURAL GHANA
MAHAMA SEINU SEIDU, MSc TRANSPORT PLANNING AND THE ENVIRONMENT          SUPERVISOR: JEFFREY TURNER    2ND READER: FRANCES HODGSON 
BACKGROUND
REFERRAL SYSTEM 
AIM AND OBJECTIVES
METHODOLOGY
EXPECTED OUTCOME
REFERENCES
Thaddeus and Maine,1994
The aim of the study is to assess the impact/effect of Ambulance
services in maternal health
OBJECTIVES:
The study is to focus on understanding and assessing the role of
ambulance services in emergency maternal health in Ghana. This is
intended to be achieved through :
 Assessment of the role and impact of Ambulance services in
maternal health delivery in rural areas .
 Whether or not Ambulance services have any significant
contribution to reduction of maternal mortality.
 How efficient and effective transport can improve emergency
maternal health intervention in rural Ghana
Millennium Development Goal (MDG 5),maternal mortality is
identifies by the United Nations(UN) as a serious concern for the
welfare of women across the world particularly a pandemic in
developing countries and specifically an “unfortunate tragedy in sub
sahara Africa as the region records the highest maternal mortality
ratio” (Ganyaglo & Hill, 2012)
 About 350,000 women die annually from pregnancy related causes
and child birth complications .
 Utilization and access to health facilities for maternal services in
these settings is hindered by several factors including lack of
transport and high cost –(4) .Referral intervention aim to address
these problems and one such intervention is the provision of
emergency ambulance referral transport services.
 In most developing countries such National ambulance services
have not been sustained effectively, providing very limited, or no
service. As a result, many segments of the population, particularly
in rural or peri‐urban areas are not covered and this poses serious
challenges to reach the appropriate health facility in case of an
emergency.
 In Ghana ,the maternal mortality ratio (MMR) is currently 350 in
every 100,000 live births .It is estimated that 75 percent of the
women who die in the course of childbirth do so as a result of
inadequate emergency transport‐(1).
 Transport is critical in the provision of health delivery and access to
services, and in the Overall effectiveness of the referral process.
 As have been identified by Thaddeus and Maine(1994), poor access
and lack of reliable transport also explain why families delay in
seeking care in an emergency situation or arrive too late at health
facilities for effective treatment as well as poor service utilization.
 Emergency transport interventions could save an estimated 75
percent of pregnant women each year, which could further save
nearly 14,500 births if functional referral systems are put in place.
The study will  be  conducted in the  Millennium Village  project 
communities  in the Ashanti Region of Ghana. A literature review 
will be done. Data on ambulance utilisation for maternal 
emergency referral in the health facilities in this communities 
will be accessed. Other case  received without intervention of 
the ambulance services within  the same period will also be 
collected .The response times and cost will be determined as 
well as the outcomes of the different scenarios. Analysis will 
then be done to assess the impacts.      
 Lack of ambulances and absence of other means of transport
in remote areas (Shehu et al. 1997) and high transport costs
represent a major constraint for women and their families
who need to access health facilities for both preventive and
emergency care. A key solution therefore is to improve
transport access in a way that is both affordable and
sustainable for these two levels of care.
 It should be possible to reduce maternal deaths in rural Ghana
by effective and efficient emergency (ambulance) referral
transport planning .
1. Babinard,J. and Roberts,P.,2006  Maternal and Child Mortality Development Goals: 
What Can the Transport Sector Do? The World Bank Group Washington, D.C.  
http://www.worldbank.org/transport/
2. Thaddeus S, Maine D (1994) Too far to walk: maternal mortality in context. Soc Sc
Med 38(8): 1091–1110.
3. Lungu K, Kamfose V, Hussein J, Ashwood‐Smith H (2001) Are bicycle ambulances and 
community transport plans effective in strengthening obstetric referral systems in 
Southern Malawi. Malawi Med J 13: 16–18.
4. Maxwell Ayindenaba Dalaba,et al.,2015 Cost to households in treating maternal 
complications in northern Ghana: a cross sectional study. BMC Health Services 
Research 2015, 15:34  doi:10.1186/s12913‐014‐0659‐1
5. Murray SF, Pearson SC (2006) Maternity referral systems in developing countries: 
current knowledge and future research needs. Soc Sc Med 62: 2205–2215.
6. WHO | Maternal mortality [http://www.who.int/mediacentre/factsheets/fs348/en/]
Without intervention
With intervention
UNIVERSITY OF LEEDS
`
Utilizing Real Time Bus Information Technology
To Encourage Bus Travel
Student: Steven Lightfoot (email: ts12sdl@leeds.ac.uk), Supervisors: Jeremy Toner and Mark Wardman
Background
• Metro Tracker survey 2014, Vector research
• Mishalani, Rabi G., Sungjoon Lee, and Mark R. McCord. 2000. "Evaluating real-time bus arrival information
systems." Transportation Research Record: Journal of the Transportation Research Board 1731.1: 81-87.
• Moss S 2015. The Guardian website. Available from: http://www.theguardian.com/cities/2015/apr/28/end-of-
the-car-age-how-cities-outgrew-the-automobile
• Tang, Lei, and Piyushimita Vonu Thakuriah. 2012 "Ridership effects of real-time bus information system: A
case study in the City of Chicago." Transportation Research Part C: Emerging Technologies 22: 146-161.
• Transportation Research Part A: Policy and Practice, Volume 45, Issue 8. 2011, Pages 839–848
• Transportation Research Part C: Emerging Technologies. Volume 53. 2015, Pages 59–75
• TLP Projects – Monitoring Report 2009 to 2013, Metro 2013
• Traveline. 2015. (online). Available from: http://dashboard.mxdata.co.uk/traveline/Account/login.aspx
Objectives
• New technologies enabling the provision of real time bus information and the
growth in smartphone use have the potential to transform the way people
view bus travel options.
• Utilize real time information to improve the way bus information is presented to the
public.
• Set out best way of displaying real time information to public on stop displays,
computers and mobile phones.
• Maximize public access to, awareness and usage of real time information.
• Set out best practice and future developments that will show how real time
information can be utilized by bus operators and traffic control centers to improve
reliability and speed whilst reducing operating costs.
Data and Scope
• Real time systems and literature from across the world will be reviewed.
• Data sources include: transport press, West Yorkshire bus user survey,
public usage of real time outputs in Yorkshire, real time user groups etc.
• Focus for recommendations will be Yorkshire, however they will be able to
be adapted for other areas.
• Recommendations will aim to retain existing bus users and attract new
users.
• Recommendations will focus on existing bus regulation system in Yorkshire,
but will consider different regulation models.
• Risks include:
• Difficulty accessing commercially sensitive formulas used to generate real time
predictions.
• Lack of regulation meaning there is no central body able to ensure recommendations
are implemented.
Methodology
• Result 1
• Result 2
• Result 3
Initial Findings
References
• Provision of real time bus information can increase bus usage.
• Can reduce both actual wait time and perceived wait time
• ‘Digital information is the fuel of mobility’,
• ‘Information about mobility is 50% of mobility’
• Large increase in real time mobile apps availability and usage facilitated by
open data provision.
• First and Google apps dominate Yorkshire market with 88% market share.
• 290% increase in real time mobile app usage in last 6 months in West Yorkshire.
• More modest increase in internet usage and a fall in text usage.
• Awareness of real time mobile internet and apps still relatively low at 27% in West
Yorkshire.
OBJECTIVE 1 – PRESENTATION
OBJECTIVE 2 – ACCESS AND USAGE
OJECTIVE 3 – SPEED, RELIABILITY AND COST
• Real time bus information utilizes satellites to track bus locations. This
enables accurate arrival times bus to be shown to the travelling public,
instead of just timetable information.
• Real time bus systems have been introduced in major transport areas across the
world.
• Difficulty accessing and using bus information has historically been a significant
barrier to encouraging sustainable travel behaviour.
• Real time information can be shown on mobile phones. Mobile phone usage is
increasing across the world. The proportion of people in West Yorkshire with a mobile
phone has increased from 90.3% in 2012 to 93% in 2014.
• Bus usage is falling in West Yorkshire. The proportion of people using a bus monthly
has fallen from 57.1% in 2011 to 52.4% in 2014.
• Technological advances have improved the practicality and reduced the cost
of real time bus information systems.
• Real time bus technologies present new opportunities for improving bus
reliability through linked technology.
• Including Traffic light bus priority and improved scheduling.
• The output from real time can be used to improve bus services.
• Operators in Yorkshire analyze past performance to improve scheduling. This can
increase reliability and reduce operator costs.
• Link to Yorkshire traffic control centers can give traffic light priority to buses. This can
increase reliability and reduce journey time and operator costs.
• Introduction of bus traffic light priority to 200 junctions in West Yorkshire was shown to
have a Benefit:cost ratio of 8.
Evaluation of the Influence on Driving Behaviour by Music Tempo
Data Collection
• Free driving task
1. Average, maximum, minimum driving speeds
2. Average, maximum lateral deviations
• Overtaking task
1. Maximum speeds
2. Minimum headway distances before and after
overtaking
• Approaching signlised junction task
1. Decision making
2. Violation frequency
3. Passing speeds
• Stopping task
1. Reaction time
Objectives
The study will be approached through driving
simulator. Four questions are aiming to be
answered in this research about lisening slow/fast
tempo music during driving:
1. How much degree of influences on driving
performance under free driving condition?
2. Does the music induce more dangerous driving
in overtaking process?
3. Will the drivers be more aggressive towards a
signalised junction?
4. Is there any deterioration in reaction time for an
emergency stop?
Background
Dibben and Williamson (2007) conducts a survey
and finds that 75% young drivers listen music
during driving. However, the young drivers, who
preferred no music driving environment, are less
involved in road accidents.
The study in Brodsky(2001) selects some fast
tempo music to test the driving performance.
Higher driving speed, and more frequent traffic
violations are shown. Fast-paced music is proved
to deteriorate the driving behaviour.
In most of the previous studies ,drivers are tested
by driving in a city through driving simulator, but
not in some specific critical conditions. In current
study, some specific scenarios will be set up in
order to thoroughly investigate the driving
influence on these conditions, for example,
overtaking, dilemma in signalised junction, and
emergency stop.
Waterhouse et al., (2010) mentions that apart from
tempo, lyrics, melody, loudness and other
particular circumstance can also affect the musical
taste. To reduce the variables, same set of music
tracks, which differed in tempo, are used in this
study.
Tasks in a testExperimental Designs
20 driving licence owners, who age from 20-30
years old, will be invited to parcitipate the
experiment, because they are the most frequent
group of listening music, as well as the highest
risk group of getting involved in accidents.
Experimental flow is below:
Briefing (15mins)
• Introduce about the experiment, including all the
tasks they will meet in the test.
• Explain the manipulation of driving simulator.
• Provide free driving section for familiarisation.
Testing (55mins)
• Without music, fast tempo and slow tempo
scenario tests will be finished by participants
respectively in random order.
Surveying (10mins)
• Complete a self-reflection questionnaire
• Personal information: age, gender, driving
experience, etc.
• Personal perception in slow and fast tempo
music for each individual task
• Any mistake has taken in the test.
Driving Simulator
Overtaking
Approaching
signalised
junction
Stop
immediately
and restart
Overtaking
Start to play
slow/fast tempo
music
Approaching
signalised junction
Stop immediately
and finish
Free Driving
for 10 minutes
at 60mph
Free Driving
for 10 minutes
at 60 mph
2 mins 2 mins
2 mins2 mins
Data Analysis and Expected Results
Three sets of dependent variable data comparisons
will be analysed:
• Without music VS Slow tempo music
• Without music VS Fast tempo music
• Slow tempo music VS Fast tempo music
The results from the fast tempo music are expected
to show:
• higher free driving speeds,
• dangerous overtaking behaviour, with higher
speeds and shorter headway distances
• tending to pass the signalised junction with higher
speed rather than decide to stop in dilemma
situation,
• and a longer reaction time.
Li Shaotang, Alvis Email: ml13l6s@leeds.au.uk Msc (Eng) Transport Planning and Engineering Supervisor: Dr. Daryl Hibberd
Motorcyclists’ Acceptance of Automated
Road Transport Systems in Taiwan
Shu-Cheng, Hsieh (ml13sch@leeds.ac.uk)
MSc (Eng) Transport Planning & Engineering
Supervisor: Dr Natasha Merat, Tyron Louw
 Motorcycles in Taiwan
 Large density and amount of registered motorcycles
 Motorcycles : Other vehicles = 1.8 : 1
 Public Transport in Taiwan
 Projects promoting public transport
by Taiwanese government since 2010
 Involving buying new buses, improving
service quality, providing real-time and
subsiding rural routes
2. Background
Year Car Bus &
Coach
LGV HGV Subtotal Motorcycle
2013 6,236,879 31,960 875,544 162,122 7,367,522 14,195,123
2014 6,405,778 32,928 890,703 163,446 7,554,319 13,735,994
 Road user interactions
 Conflicts between
motorcycles and buses
(Particularly at bus
stops)
Public Transport
 Little changes on usage
 Financial difficulties for
operators
 Lack of drivers
3. Research Problems
 An example: City Mobil2
 An EU project
assessing ARTS
 Deliver ARTS in several
European cities
 Investigate road users acceptance
(focus on pedestrian)
 Aims:
1) Evaluate what ARTS could provide to sustainable
transport
2) Examine and improve interactions between ARTS and
other road users
How about in Taiwanese
transport environment?
4. Research Motivation
 Literature review, technology approach and integration
 Questionnaire
 Sample: Motorcyclists in Taiwan
 Asking acceptance in two sections
 Data Analysis and discussion
5. Methodology
Section 1
• Applying Drive Behaviour Questionnaire
• Initial acceptance by introducing ARTS
Section 2
• Scenario with safety systems on ARTS
• Scenario with road infrastructure for ARTS
 Understand the factors that influence
motorcyclist’s acceptance of ARTS
 Motorcyclist–centred design recommendation
fro ARTS in Taiwan
6. Expected Outcomes
 Public transport systems based on the use of a fleet of
communication-enabled cybercars – road vehicles with
automated driving capabilities.
 Advantages
 Provide “Last-mile connections” for individuals
 Low personnel costs (No drivers)
 Sustainable urban transport
 Existing Cases
1. What is Automated Road Transport
Systems (ARTS)?
ARTS in the West Region of
Lausanne, Switzerland
ARTS in La Rochelle, France
Key References
CityMobil (2015), http://www.citymobil-project.eu/. CityMobil2 (2015), http://www.citymobil2.eu/
Directorate General of Highways, Ministry of Transportation and Communications, Taiwan (R.O.C.) (2014), Annual Report for Motor Vehicle Administration.
Rockall, Wil, 2014, Can driverless car see off cyber attacks? [Online] London, United Kingdom. http://goo.gl/oFQZNg
Reason, Manstead, Stradling, Baxter & Campbell (1990), Errors and violations on the roads: a real distinction? http://goo.gl/ZMzgVX
 Understand motorcyclists’ initial acceptance of ARTS in
Taiwan
 Find out what will increase motorcyclists’ acceptance and
confidence of ARTS when assessing them, in:
 Safety systems on ARTS
 Road infrastructure
5. Objectives
Can ARTS be a solution?
ROLE OF PRIVATE FINANCE IN AIRPORT DEVELOPMENT
NAME: SAMUEL APPIAH ADJEI
EMAIL: ts14saa@leeds.ac.uk INDEX: 200872578
SUPERVISOR: PROF. NIGEL SMITH
BACKGROUND AIM METHODOLOGY
1. The fundamental change in the airport industry
occurred after the 1986 Airports Act which was to
introduce the privatization and commercialization
into the aviation sector
2. There exist different ownership models after
the introduction of Airport Act
3. Most airports in the UK has experienced
different ownership types over the years
4. Some of the ownership types include purely
public airport, public private partnership and
purely private ownership
5. Research would undertake time series analysis
of effects of ownership change on airports
passenger trends
Subhead
• Volor ilit nonsendiate magna ad erciliquip eugiam velent alisl dolor auguerat. Ut
dolore consendrerit verilla cons nosto cons nim quis elisci ex ea commy nis doloreet
ex estie vent ad molesto diat.
• Volor ilit nonsendiate magna ad erciliquip eugiam velent alisl dolor auguerat. Ut
dolore consendrerit verilla cons nosto cons nim quis elisci ex ea commy nis doloreet
ex estie vent ad molesto diat.
•Volor ilit nonsendiate magna ad erciliquip eugiam velent alisl dolor auguerat. Ut
dolore consendrerit verilla cons nosto cons nim quis elisci ex ea commy nis doloreet
ex.
This research primarily examines the impact
of airport ownership type on airport
efficiency
1. Analyse airport passenger trends
between 2000 and 2014
2. Analyse airport freight trends between
2000 and 2014
3.Identify impact of airport ownership type
on passenger trends
4. Identify measures to improving airport
passenger and freight growth
Leeds Bradford Airport
FURTHER WORK
1. Study effects of various airport services
on passenger numbers
2. Evaluate private finance on airport
development
1. The fundamental change in the airport
industry occurred after the 1986 Airports Act
which was to introduce the privatization and
commercialization into the aviation sector
2. There exist different ownership models after
the introduction of Airport Act
3. Most airports in the UK has experienced
different ownership types over the years
4. Some of the ownership types include purely
public airport, public private partnership and
purely private ownership
5. Research would undertake time series analysis
of effects of ownership change on airports
passenger trends
UK AIRPORT UK OWNERSHIP
PRIVATIZED
AIRPORTS
PUBLIC
PRIVATE
PARTNERSHIP
PUBLIC
AIRPORTS
OBJECTIVES
CASE STUDY
TIME SERIES ANALYSIS
PASSENGER TRENDS FREIGHT TRENDS
DATA COLLECTION
AIRPORT ANNUAL REPORT CIVIL AVIATION AUTHORITY
CASE STUDY APPROACH
LEEDS BRADFORD AIRPORT
Public
Airport
2000-2007
Privatized
2007 to
Date
REFERENCES
Butcher L. (2014), Aviation: Regional Airports House of Commons,
House of Commons Library
Oxford Economics (2011) Economic benefits of air transport in the UK
Yin, R. K. (2014) Case Study Research. 5th Edition. California. Sage
Publications Inc.
Traffic flows thresholds for Shared Space in Leeds
Transport Planning and Engineering. Student: Russell Oakes Supervisor: Dr James Tate
Introduction
Shared Space is a concept where streets are re-engineered to reduce the
dominance of motor vehicles (DfT, 2014) Street signage is limited and kerb heights
are reduced or removed completely in some cases.
The focus for this project will be in Headingley, North West Leeds. Pedestrian
desire lines vary due to the mixture of retail and leisure activities this district has to
offer; therefore providing an ideal location to test the theory.
Literature
The dissertation will be educated by various sources of literature, including...
Manual for Streets (1 & 2), Liverpool City Centre Plan (1961), Living Streets
Policy, Local Authority Policy (for example Leeds City Council Supplementary
Planning Documents), University of the West of England Research, Written
interview with the late Hans Monderman and scheme studies.
Objectives
To ascertain the potential for bringing Shared Space to Headingley by:
Understanding previous comparable Shared Space Schemes
Compiling a resource containing pedestrian and vehicular data
Applying the data to a Micro-simulation Package (Aimsun & Legion) with
sensitivity tests
Analysing the Aimsun & Legion outputs
Determining applicability to Headingley and wider Leeds
These objectives will act as milestones throughout the dissertation with the
expectation that each objective will be a development on its predecessor.
Methodology
The project will require site visits to various
contrasting examples, compilation of pedestrian
data from Leeds City Council and a suitable
model simulation running to satisfy the scope of
the project.
Anticipated issues include the inability to
compile pedestrian data for the Headingley
area, therefore flexibility with pilot site locations
may be required.
Two preliminary pilot sites of contrasting traffic
density will be used in order to determine the
relative scales of operation for a Shared Space
scheme. Currently, these sites are North Lane/
Otley Road and St Michaels Road outside the
Church.
Coventry Top: Before. Source: Oakes, R (2010) Bottom: After. Source: Oakes, R (2015)
Preston
De-cluttering of street furniture including
the removal of traffic lights
Narrowing of Fishergate providing wider
pavements
Provision of informal pedestrian crossings
Top: Before. Source: Oakes, R (2013) Bottom: After. Source:
Oakes, R (2015)
UrbanCaseStudies
Top: Before. Source: Oakes, R (2010) Bottom: After. Source:
Oakes, R (2015)
Downgraded routes complimented by
extensive landscaping
Closure of through routes and
implementation of UKs largest 20mph zone
(Coventry City Council, 2010)
Mixture of zebra and informal crossings
Coventry
Top: St Michaels Road. Source: Oakes, R (2015)
Bottom: Otley Road/North Lane. Source: Oakes, R (2015)
Sources used in the dissertation will include:
Early Indications and
Potential Outcomes
No Shared Space scheme is identical, as
demonstrated with the case studies. Therefore, the
site visits will assist in the appreciation of the issues
apparent in Headingley.
An understanding of which environments would
best suit a Shared Space scheme with the potential
to apply the key findings of this project to policy
making within Leeds City Council.
Communities are aware of the Shared Space
concept and have approached Leeds City Council
requesting that this is investigated.
If the timescales fit, efforts will be made to draw
comparisons where relevant to other Shared Space
schemes. This may lead to good practice workings
with other Local Authorities subject to interest.
Sources of Information
The dissertation will call upon quantitative and qualitative sources in order to provide a
robust analysis. This could include:
Quantitative
Leeds City Council Transport Monitoring Database
Primary data collection (where required)
Scheme monitoring reports
(where available)
Qualitative
City and County Borough of Liverpool 1965, Liverpool City Centre Plan,
Liverpool, City and County Borough of Liverpool
Moody, S. and Melia, S. (2014) Shared space: Research, policy and
problems. Proceedings of the Institution of Civil Engineers - Transport, [Online]
Available at: http://www.icevirtuallibrary.com/content/article/10.1680/
tran.12.00047 (Accessed 23rd April 2015)
Meta-analysis of electric vehicles’ range prediction
EU in attempt to invest in innovation in Europe and also to improve the life quality of the
union’s citizens, introduced the programme “HORIZON 2020” for 2014-15; where one of the
main goals is “smart, green and integrated transport”. A key topic of this programme is the
improvement of “green” electric vehicles’ technology and charging infrastructure; in an
attempt to make electric vehicles (EV) prevail in the vehicle market, as a “cleaner” technology,
improving urban air-quality, and also to improve the driving experience of EV drivers.
According to the last, this report aim to investigate the prediction of the driving range of EV;
which is connected with the real-time information (digital support) for EV drivers for better
trip planning and access to charging facilities.
The main objective of this research is to
investigate the parameters that affect the driving
range of EV in real-life driving conditions, in
order to test and evaluate the accuracy of the
existing methods currently used for EV driving
range prediction. This aim to help drivers predict
the residual driving range of their vehicles in
order to improve their driving experience and
better estimate their trips.
(a) a smart grip giving information to the EV driver on when the next charge is required and the near available charging
facilities, through GPS positioning. This could be through a mobile application or on a pre-installed application on the
vehicle. (b) an example of application (“Next Charge”, android app) giving information to the driver about the available near
charging stations. (c) an application (“EV Range”, android app) for route planning by the driver; with inputs origin and
destination, vehicle model and passengers number, and outputs distance, time, consumption (Wh/km), percentage of the
battery capacity left (%), and driving range (km) for all possible routes.
• Develop the framework, the modelling of the motor’s required power based on travel ( i.e. distance, traffic conditions, slope, etc.), vehicle (i.e.
weight) and driver (i.e. aggressiveness, route choice etc.) related parameters and battery’s discharge rate validation based on the battery's
specifications: capacity, state of charge (SOC), current (I), voltage(V), etc.
• Investigate the applied and researched modelling methods (for both the motor and the battery) and related parameters
• Evaluate the validity and transferability of the methods and the findings regarding how the data where collected, by which conditions, the data
sample size, etc.
• Research transferable methodology from other studies that can be examine for EVs i.e. ICE vehicles fuel consumption and emissions factors
• Define the parameters into modelling factors and discuss limitations
• Make the a comparison of the methods and give the proposed method or combination and make proposals for improvements and further
research
M e t h o d o l o g y
Objective
Can driving range be predicted accurately? Which data are required? Is the
use of these models in real-life feasible?
P a r a m e t e r s
One of the most advanced features of an EV, compared to the conventional ICE vehicle is its ability to
regenerate electricity when decelerate through the regenerative braking system (RBS).
Power (KW)/ Acceleration (m/s2) Figure (c) and (d)
• For acceleration between -1.5 and 1.5 m/s2, the power proportionally increases with the increase of the
acceleration.
• For acceleration bellow -1.5 m/s2 or above 1.5 m/s2 the power remains almost the same and doesn’t change with
the acceleration.
• For both urban (in-city) driving and freeway driving, the power lies between -5 kW and 20 kW
• The lower bound is low because EV’s regeneration is limited by the battery pack’s ability to accept charge which is
controlled by the battery management system (BMS).
Power (KW)/ Roadway gradient (%) Figure (e) and (f) (Gradient information was collected from Google Earth)
• As the gradient is increasing the required power is increasing too.
• The change in power is significantly larger when the grade is positive
• For urban (in-city) driving, the change in power is 20 kW (5 - 25 kW) when the grade changes from 0 to 6%; but
when the grade changes from -6 to 0% the power increases only 5 kW (0 - 5 kW)
• For the freeway driving, the needed power changes from 12 to 32 kW (20 kW difference) when the grade changes
from 0 to 6%; but when the grade changes from -6 to 0% the power increases only 7 kW (5- 12 kW).
• For the same gradient the freeway driving requires more power than urban driving probable due to higher speeds.
The huge potential benefits of EVs have already attracted
significant interest and investment in EV technology. Since
2010 more than 20 manufactures introduced EVs.
(a) (b) (c)
Reference: Wu, X., Freese, D., Cabrera, A., & Kitch, W. (2015). Electric vehicles' energy consumption measurement and
estimation. Elsevier, Transport Research Part D, 52-67.
Collection of traffic condition
and road type data
Categorisation of road-
type and congestion level
collect vehicle response to traffic and road
conditions
Simulate vehicle response to
traffic and road conditions
Model development
1. Single vehicle driving
cycle
2. Multiple vehicles driving
cycle
1. Road type
2. Speed
3. Speed/stops-starts
4. Speed/ acceleration-
deceleration
5. LOS
1. Data logger on EV & GPS positioning
(road-information from interactive
maps)
2. Data logger on non-EV vehicle(s)
3. Data logger on non-EV vehicle(s) & GPS
positioning
4. Aggregate average data (pre-developed
driving cycle used)
1. Neural Network
2. Simple statistical analysis
1. Data analysis based algorithms
2. Data analysis based & physic based
approach algorithms
3. Physic based approach algorithms,
static model (use data for
validation)
3. Dynamometer driving
schedule
1. Speed
2. Speed/stops-starts
3. Speed/ acceleration-
deceleration
1. Data logger on EV
2. Data logger non-EV vehicle
3. Aggregate average data (pre-developed
driving cycle used)
1. Statistical analysis 1. Data analysis based algorithms
2. Physic based approach algorithms,
static model (use data for
validation)
4. Derive from traffic model 1. Road type-traffic model 1. Aggregate average data 1. Statistical analysis 1. Data analysis based & physic based
approach algorithms
F r a m e w o r k o f p u b l i s h e d E V r a n g e p r e d i c t i n g m e t h o d s
Who spend what on the High Street? A comparison of the importance of non-car access between city
centre and local shops areas. Institute for Transport Studies, University of Leeds, UK.
RESEARCH QUESTION
(sustrans, 2006)
55% 22% (4'.•"'10% (6cq13% (1 1 %)
Actual mode of customer travel
(Shopkeepers estimates in brackets)
Shoppers' choice of travel modes in Bristol study
rivers limit the range of
compact urban centre, flat
ervice.
One of the best Park and Ride
QUESTIONS & OBJECTIVES
Which are the accessibility patterns in the city centre and
local shops areas?
Have they an implication in shops turnover?
To determinate if retailers perception about their customer mode
of access is accurate, in order to promote a better understanding of
transport and land-use policies.
CITY OF YORK
Advantages for sustainable modes:
geography and good public transport s
Foot street historical and retail centre.
schemes in the UK.
Disadvantages: Historical walls and
interventions.
METHODOLOGY
1) Literature review of economic, planning and transport
approaches to High Streets in U.K. and previous academic and "grey"
studies.
2)Questionnaires designing based on previous studies and
amendments for accuracy to City of York
RISK
Data collection task may take more time than expected.
Get retailers answers while they are working.
Fail in achieving the proposed sample size.
Lack of support from York City Council
CONTEXT
"Local areas should implement free controlled parking schemes..."
"Cars are an intrinsic part of the way many people shop..."
Worths Report,2011,p.5 and p.271
"There is not such thing as "free" parking"
(Tyler et a1,2012,p.651
"The literature on parking and retail divides into two groups: those
suggesting that parking is important for retail activity and those arguing
that retailers have a wrong perception about the modal split of their
customer and usually overestimate car use for shopping"
IMingrado,2012,p1951
3)Data will be collected by different methods with the aim of
accumulating as many answers as possible: face to face, mail drop and
email questionnaires.
4. Analysis: data analysis, interpretations and comparison with other
results from UK and overseas.
1. Conclusion: Findings of the work. Answers to the research questions
and implication for the city of York.
REFERENCES
s,M. (2011). The Portas Review. An independent review into the future of our Highs Streets. [ONLINE].
[Accessed 29 February 2015]. Available from: https://www.gov.uk/government/uploads/system/up-
loadsiattachment_dataifile/6292/2081646.pdf Sustrans. (2006). Real and Perceived travel behaviour in
neighbourhood shopping areas in Bristol. Bristol: Sustrans.
Tyler, S., Semper, G., Guest, P., & Fieldhouse, B. (2012). The relevance of parking in the
success of urban centres, A review for London Councils.
UNIVERSITY OF LEEDS
DATA
Desirable sample size:
Consumers centre(n=200)
Consumer local( n= 100);
Retailers centre(n= 50)
Retailers local(n=25).
QUESTION EXAMPLES
"How often and by which means do
you shop"?
"How often and by which means
do you think your customers
shop?"
Poster Presentation: 01 May 2015. Student: Pedro Scarpinelli . Dissertation Tutor: Professor Greg Marsden. Institute for Transport Studies, University of Leeds
Traffic flows thresholds for Shared Space in Leeds
Transport Planning and Engineering. Student: Russell Oakes Supervisor: Dr James Tate
Introduction
Shared Space is a concept where streets are re-engineered to reduce the
dominance of motor vehicles (DfT, 2014) Street signage is limited and kerb heights
are reduced or removed completely in some cases.
The focus for this project will be in Headingley, North West Leeds. Pedestrian
desire lines vary due to the mixture of retail and leisure activities this district has to
offer; therefore providing an ideal location to test the theory.
Literature
The dissertation will be educated by various sources of literature, including...
Manual for Streets (1 & 2), Liverpool City Centre Plan (1961), Living Streets
Policy, Local Authority Policy (for example Leeds City Council Supplementary
Planning Documents), University of the West of England Research, Written
interview with the late Hans Monderman and scheme studies.
Objectives
To ascertain the potential for bringing Shared Space to Headingley by:
Understanding previous comparable Shared Space Schemes
Compiling a resource containing pedestrian and vehicular data
Applying the data to a Micro-simulation Package (Aimsun & Legion) with
sensitivity tests
Analysing the Aimsun & Legion outputs
Determining applicability to Headingley and wider Leeds
These objectives will act as milestones throughout the dissertation with the
expectation that each objective will be a development on its predecessor.
Methodology
The project will require site visits to various
contrasting examples, compilation of pedestrian
data from Leeds City Council and a suitable
model simulation running to satisfy the scope of
the project.
Anticipated issues include the inability to
compile pedestrian data for the Headingley
area, therefore flexibility with pilot site locations
may be required.
Two preliminary pilot sites of contrasting traffic
density will be used in order to determine the
relative scales of operation for a Shared Space
scheme. Currently, these sites are North Lane/
Otley Road and St Michaels Road outside the
Church.
Coventry Top: Before. Source: Oakes, R (2010) Bottom: After. Source: Oakes, R (2015)
Preston
De-cluttering of street furniture including
the removal of traffic lights
Narrowing of Fishergate providing wider
pavements
Provision of informal pedestrian crossings
Top: Before. Source: Oakes, R (2013) Bottom: After. Source:
Oakes, R (2015)
UrbanCaseStudies
Top: Before. Source: Oakes, R (2010) Bottom: After. Source:
Oakes, R (2015)
Downgraded routes complimented by
extensive landscaping
Closure of through routes and
implementation of UKs largest 20mph zone
(Coventry City Council, 2010)
Mixture of zebra and informal crossings
Coventry
Top: St Michaels Road. Source: Oakes, R (2015)
Bottom: Otley Road/North Lane. Source: Oakes, R (2015)
Sources used in the dissertation will include:
Early Indications and
Potential Outcomes
No Shared Space scheme is identical, as
demonstrated with the case studies. Therefore, the
site visits will assist in the appreciation of the issues
apparent in Headingley.
An understanding of which environments would
best suit a Shared Space scheme with the potential
to apply the key findings of this project to policy
making within Leeds City Council.
Communities are aware of the Shared Space
concept and have approached Leeds City Council
requesting that this is investigated.
If the timescales fit, efforts will be made to draw
comparisons where relevant to other Shared Space
schemes. This may lead to good practice workings
with other Local Authorities subject to interest.
Sources of Information
The dissertation will call upon quantitative and qualitative sources in order to provide a
robust analysis. This could include:
Quantitative
Leeds City Council Transport Monitoring Database
Primary data collection (where required)
Scheme monitoring reports
(where available)
Qualitative
City and County Borough of Liverpool 1965, Liverpool City Centre Plan,
Liverpool, City and County Borough of Liverpool
Moody, S. and Melia, S. (2014) Shared space: Research, policy and
problems. Proceedings of the Institution of Civil Engineers - Transport, [Online]
Available at: http://www.icevirtuallibrary.com/content/article/10.1680/
tran.12.00047 (Accessed 23rd April 2015)
Evaluating the efficiency of Network Aggregation in providing accurate results, using SATURN
software. A case study of the Lendal bridge closure in York City.Panagiotis Anastasiadis
Dr. David Milne (Supervisor), Prof. David Watling (2nd reader)
I. Understand the patterns and unique characteristics of York’s
network
II. Investigate suitable approaches to network simplification
III. Define and describe step by step a network simplification
method, which best represents the effects of the traffic.
IV. Identify the ideal level of simplification to provide adequately
accurate results that help in evaluating transport policies.
3. Case study
Lendal bridge closure trial for cars, lorries and motorbikes (10:30-17:00).
Start date: 27 August 2013
End date: 26 February 2014
5. Methodology (Link extraction proposed methods)
4. Objectives
I)
II)
Masters Dissertation Posters 2015

More Related Content

What's hot

3-Trip Generation-Distribution ( Transportation and Traffic Engineering Dr. S...
3-Trip Generation-Distribution ( Transportation and Traffic Engineering Dr. S...3-Trip Generation-Distribution ( Transportation and Traffic Engineering Dr. S...
3-Trip Generation-Distribution ( Transportation and Traffic Engineering Dr. S...Hossam Shafiq I
 
Importance of GIS and Remote Sensing in Modern Intelligent Transport System
Importance of GIS and Remote Sensing in Modern Intelligent Transport SystemImportance of GIS and Remote Sensing in Modern Intelligent Transport System
Importance of GIS and Remote Sensing in Modern Intelligent Transport SystemKam Raju
 
Driving behavior for ADAS and Autonomous Driving
Driving behavior for ADAS and Autonomous DrivingDriving behavior for ADAS and Autonomous Driving
Driving behavior for ADAS and Autonomous DrivingYu Huang
 
human factor and road safety
human factor and road safetyhuman factor and road safety
human factor and road safetyHABTE DEBISA
 
Public Transport and Sustainable Development
Public Transport and Sustainable DevelopmentPublic Transport and Sustainable Development
Public Transport and Sustainable DevelopmentAndre Dantas
 
PREDICTION OF ROAD ACCIDENT MODELLING FOR INDIAN NATIONAL HIGHWAYS
PREDICTION OF ROAD ACCIDENT MODELLING FOR INDIAN NATIONAL HIGHWAYSPREDICTION OF ROAD ACCIDENT MODELLING FOR INDIAN NATIONAL HIGHWAYS
PREDICTION OF ROAD ACCIDENT MODELLING FOR INDIAN NATIONAL HIGHWAYSIAEME Publication
 
EFFECTS OF STRATEGIC PLANNING DIMENSIONS ON PERFORMANCE OF SMALL AND MEDIUM S...
EFFECTS OF STRATEGIC PLANNING DIMENSIONS ON PERFORMANCE OF SMALL AND MEDIUM S...EFFECTS OF STRATEGIC PLANNING DIMENSIONS ON PERFORMANCE OF SMALL AND MEDIUM S...
EFFECTS OF STRATEGIC PLANNING DIMENSIONS ON PERFORMANCE OF SMALL AND MEDIUM S...Ahmed Aliyu Palladan, PhD
 
Future of autonomous vehicles final report ppt - may 2020
Future of autonomous vehicles   final report ppt - may 2020Future of autonomous vehicles   final report ppt - may 2020
Future of autonomous vehicles final report ppt - may 2020Future Agenda
 
Applications of Artificial Intelligence in Transportation Systems
Applications of Artificial Intelligence in Transportation SystemsApplications of Artificial Intelligence in Transportation Systems
Applications of Artificial Intelligence in Transportation SystemsEITESAL NGO
 
Using Big data Analytics for Improved Public Transport
Using Big data Analytics for Improved Public Transport Using Big data Analytics for Improved Public Transport
Using Big data Analytics for Improved Public Transport UN Global Pulse
 
Qualitative Research
Qualitative ResearchQualitative Research
Qualitative ResearchAhmad Faisal
 
Qualitative research second copy corrected
Qualitative research  second copy correctedQualitative research  second copy corrected
Qualitative research second copy correctedMenaal Kaushal
 
Evaluation of Pedestrian Safety and Road Crossing Behavior at Midblock Crosswalk
Evaluation of Pedestrian Safety and Road Crossing Behavior at Midblock CrosswalkEvaluation of Pedestrian Safety and Road Crossing Behavior at Midblock Crosswalk
Evaluation of Pedestrian Safety and Road Crossing Behavior at Midblock Crosswalkshrikrishna kesharwani
 
Impact of Transportation System on Land Use in CBD area of Pabna Municipality...
Impact of Transportation System on Land Use in CBD area of Pabna Municipality...Impact of Transportation System on Land Use in CBD area of Pabna Municipality...
Impact of Transportation System on Land Use in CBD area of Pabna Municipality...Md. Merazul Islam Abir
 
Black spot analysis with Kernel Density in Budapest
Black spot analysis with Kernel Density in BudapestBlack spot analysis with Kernel Density in Budapest
Black spot analysis with Kernel Density in BudapestDanish Menghwar
 

What's hot (20)

Msc Thesis - Presentation
Msc Thesis - PresentationMsc Thesis - Presentation
Msc Thesis - Presentation
 
3-Trip Generation-Distribution ( Transportation and Traffic Engineering Dr. S...
3-Trip Generation-Distribution ( Transportation and Traffic Engineering Dr. S...3-Trip Generation-Distribution ( Transportation and Traffic Engineering Dr. S...
3-Trip Generation-Distribution ( Transportation and Traffic Engineering Dr. S...
 
Importance of GIS and Remote Sensing in Modern Intelligent Transport System
Importance of GIS and Remote Sensing in Modern Intelligent Transport SystemImportance of GIS and Remote Sensing in Modern Intelligent Transport System
Importance of GIS and Remote Sensing in Modern Intelligent Transport System
 
Driving behavior for ADAS and Autonomous Driving
Driving behavior for ADAS and Autonomous DrivingDriving behavior for ADAS and Autonomous Driving
Driving behavior for ADAS and Autonomous Driving
 
Key Issues to Address Road Safety
Key Issues to Address Road SafetyKey Issues to Address Road Safety
Key Issues to Address Road Safety
 
human factor and road safety
human factor and road safetyhuman factor and road safety
human factor and road safety
 
Public Transport and Sustainable Development
Public Transport and Sustainable DevelopmentPublic Transport and Sustainable Development
Public Transport and Sustainable Development
 
Traffic presentation
Traffic presentationTraffic presentation
Traffic presentation
 
PREDICTION OF ROAD ACCIDENT MODELLING FOR INDIAN NATIONAL HIGHWAYS
PREDICTION OF ROAD ACCIDENT MODELLING FOR INDIAN NATIONAL HIGHWAYSPREDICTION OF ROAD ACCIDENT MODELLING FOR INDIAN NATIONAL HIGHWAYS
PREDICTION OF ROAD ACCIDENT MODELLING FOR INDIAN NATIONAL HIGHWAYS
 
EFFECTS OF STRATEGIC PLANNING DIMENSIONS ON PERFORMANCE OF SMALL AND MEDIUM S...
EFFECTS OF STRATEGIC PLANNING DIMENSIONS ON PERFORMANCE OF SMALL AND MEDIUM S...EFFECTS OF STRATEGIC PLANNING DIMENSIONS ON PERFORMANCE OF SMALL AND MEDIUM S...
EFFECTS OF STRATEGIC PLANNING DIMENSIONS ON PERFORMANCE OF SMALL AND MEDIUM S...
 
Masters Dissertation Posters 2014
Masters Dissertation Posters 2014 Masters Dissertation Posters 2014
Masters Dissertation Posters 2014
 
SUMO ( SIMULATION OF URBAN MOBILITY)
SUMO ( SIMULATION OF URBAN MOBILITY)SUMO ( SIMULATION OF URBAN MOBILITY)
SUMO ( SIMULATION OF URBAN MOBILITY)
 
Future of autonomous vehicles final report ppt - may 2020
Future of autonomous vehicles   final report ppt - may 2020Future of autonomous vehicles   final report ppt - may 2020
Future of autonomous vehicles final report ppt - may 2020
 
Applications of Artificial Intelligence in Transportation Systems
Applications of Artificial Intelligence in Transportation SystemsApplications of Artificial Intelligence in Transportation Systems
Applications of Artificial Intelligence in Transportation Systems
 
Using Big data Analytics for Improved Public Transport
Using Big data Analytics for Improved Public Transport Using Big data Analytics for Improved Public Transport
Using Big data Analytics for Improved Public Transport
 
Qualitative Research
Qualitative ResearchQualitative Research
Qualitative Research
 
Qualitative research second copy corrected
Qualitative research  second copy correctedQualitative research  second copy corrected
Qualitative research second copy corrected
 
Evaluation of Pedestrian Safety and Road Crossing Behavior at Midblock Crosswalk
Evaluation of Pedestrian Safety and Road Crossing Behavior at Midblock CrosswalkEvaluation of Pedestrian Safety and Road Crossing Behavior at Midblock Crosswalk
Evaluation of Pedestrian Safety and Road Crossing Behavior at Midblock Crosswalk
 
Impact of Transportation System on Land Use in CBD area of Pabna Municipality...
Impact of Transportation System on Land Use in CBD area of Pabna Municipality...Impact of Transportation System on Land Use in CBD area of Pabna Municipality...
Impact of Transportation System on Land Use in CBD area of Pabna Municipality...
 
Black spot analysis with Kernel Density in Budapest
Black spot analysis with Kernel Density in BudapestBlack spot analysis with Kernel Density in Budapest
Black spot analysis with Kernel Density in Budapest
 

Viewers also liked

Delivering a quality rapid transit system in a challenging environment
Delivering a quality rapid transit system in a challenging environmentDelivering a quality rapid transit system in a challenging environment
Delivering a quality rapid transit system in a challenging environmentInstitute for Transport Studies (ITS)
 
Transfer of transport planning policies from developed to developing nations
Transfer of transport planning policies from developed to developing nationsTransfer of transport planning policies from developed to developing nations
Transfer of transport planning policies from developed to developing nationsInstitute for Transport Studies (ITS)
 
Building an evidence base (almost) from scratch: what to do when you don't ha...
Building an evidence base (almost) from scratch: what to do when you don't ha...Building an evidence base (almost) from scratch: what to do when you don't ha...
Building an evidence base (almost) from scratch: what to do when you don't ha...Institute for Transport Studies (ITS)
 
Influencing travel behaviour projects - transport consultancy context
Influencing travel behaviour projects - transport consultancy contextInfluencing travel behaviour projects - transport consultancy context
Influencing travel behaviour projects - transport consultancy contextInstitute for Transport Studies (ITS)
 
Assessing the equity impact of the EU emission trading scheme on an African a...
Assessing the equity impact of the EU emission trading scheme on an African a...Assessing the equity impact of the EU emission trading scheme on an African a...
Assessing the equity impact of the EU emission trading scheme on an African a...Institute for Transport Studies (ITS)
 

Viewers also liked (18)

Autonomous vehicles and impact on cities
Autonomous vehicles and impact on citiesAutonomous vehicles and impact on cities
Autonomous vehicles and impact on cities
 
Smartcard and Information Programme (METRO)
Smartcard and Information Programme (METRO)Smartcard and Information Programme (METRO)
Smartcard and Information Programme (METRO)
 
Congestion pricing in Gothenburg
Congestion pricing in GothenburgCongestion pricing in Gothenburg
Congestion pricing in Gothenburg
 
Delivering a quality rapid transit system in a challenging environment
Delivering a quality rapid transit system in a challenging environmentDelivering a quality rapid transit system in a challenging environment
Delivering a quality rapid transit system in a challenging environment
 
Stations as Places - designing & planning rail stations
Stations as Places - designing & planning rail stationsStations as Places - designing & planning rail stations
Stations as Places - designing & planning rail stations
 
Rail Passenger Demand Forecasting - a view from the industry
Rail Passenger Demand Forecasting - a view from the industryRail Passenger Demand Forecasting - a view from the industry
Rail Passenger Demand Forecasting - a view from the industry
 
Associated British Ports - keeping Britain trading
Associated British Ports - keeping Britain tradingAssociated British Ports - keeping Britain trading
Associated British Ports - keeping Britain trading
 
Behaviour Change - Smarter Choices Theory and Practice
Behaviour Change - Smarter Choices Theory and PracticeBehaviour Change - Smarter Choices Theory and Practice
Behaviour Change - Smarter Choices Theory and Practice
 
Transfer of transport planning policies from developed to developing nations
Transfer of transport planning policies from developed to developing nationsTransfer of transport planning policies from developed to developing nations
Transfer of transport planning policies from developed to developing nations
 
Building an evidence base (almost) from scratch: what to do when you don't ha...
Building an evidence base (almost) from scratch: what to do when you don't ha...Building an evidence base (almost) from scratch: what to do when you don't ha...
Building an evidence base (almost) from scratch: what to do when you don't ha...
 
Crossrail 2 - Planning for the Future
Crossrail 2 - Planning for the FutureCrossrail 2 - Planning for the Future
Crossrail 2 - Planning for the Future
 
Designing a new train
Designing a new trainDesigning a new train
Designing a new train
 
Influencing travel behaviour projects - transport consultancy context
Influencing travel behaviour projects - transport consultancy contextInfluencing travel behaviour projects - transport consultancy context
Influencing travel behaviour projects - transport consultancy context
 
Assessing the equity impact of the EU emission trading scheme on an African a...
Assessing the equity impact of the EU emission trading scheme on an African a...Assessing the equity impact of the EU emission trading scheme on an African a...
Assessing the equity impact of the EU emission trading scheme on an African a...
 
Private finance in the roads sector
Private finance in the roads sectorPrivate finance in the roads sector
Private finance in the roads sector
 
Transport Planning Society Manifesto General Election 2015
Transport Planning Society Manifesto General Election 2015Transport Planning Society Manifesto General Election 2015
Transport Planning Society Manifesto General Election 2015
 
The importance of Value of Time studies - a Dutch perspective
The importance of Value of Time studies - a Dutch perspectiveThe importance of Value of Time studies - a Dutch perspective
The importance of Value of Time studies - a Dutch perspective
 
The number 36 bus route - innovation in public transport
The number 36 bus route - innovation in public transportThe number 36 bus route - innovation in public transport
The number 36 bus route - innovation in public transport
 

Similar to Masters Dissertation Posters 2015

A Case Study Of Public Bus Driver Behaviour At Batu Feringghi
A Case Study Of Public Bus Driver Behaviour At Batu FeringghiA Case Study Of Public Bus Driver Behaviour At Batu Feringghi
A Case Study Of Public Bus Driver Behaviour At Batu FeringghiScott Bou
 
Pedestrian Conflict Risk Model at Unsignalized Locations on a Community Street
Pedestrian Conflict Risk Model at Unsignalized Locations on a Community StreetPedestrian Conflict Risk Model at Unsignalized Locations on a Community Street
Pedestrian Conflict Risk Model at Unsignalized Locations on a Community Streetcoreconferences
 
To Find out the Relationship between Errors, Lapses, Violations and Traffic A...
To Find out the Relationship between Errors, Lapses, Violations and Traffic A...To Find out the Relationship between Errors, Lapses, Violations and Traffic A...
To Find out the Relationship between Errors, Lapses, Violations and Traffic A...inventionjournals
 
Behavioural meetup: Prof. Alan Tapp
Behavioural meetup: Prof. Alan TappBehavioural meetup: Prof. Alan Tapp
Behavioural meetup: Prof. Alan TappPrime Decision
 
International Refereed Journal of Engineering and Science (IRJES)
International Refereed Journal of Engineering and Science (IRJES)International Refereed Journal of Engineering and Science (IRJES)
International Refereed Journal of Engineering and Science (IRJES)irjes
 
The Effects of Vehicle Speeds on Accident Frequency within Settlements along ...
The Effects of Vehicle Speeds on Accident Frequency within Settlements along ...The Effects of Vehicle Speeds on Accident Frequency within Settlements along ...
The Effects of Vehicle Speeds on Accident Frequency within Settlements along ...IJMER
 
Awareness on Road Signs and Markings of Drivers and Passengers along Maharlik...
Awareness on Road Signs and Markings of Drivers and Passengers along Maharlik...Awareness on Road Signs and Markings of Drivers and Passengers along Maharlik...
Awareness on Road Signs and Markings of Drivers and Passengers along Maharlik...IJAEMSJORNAL
 
Road User priorities July 2015
Road User priorities July 2015Road User priorities July 2015
Road User priorities July 2015Dr Douglas Dalziel
 
17 hauer web9 lessons learned white paper
17 hauer web9 lessons learned white paper17 hauer web9 lessons learned white paper
17 hauer web9 lessons learned white paperSierra Francisco Justo
 
Las tres e, y la politica de seguridad vial 2013
Las tres e, y la politica de seguridad vial 2013Las tres e, y la politica de seguridad vial 2013
Las tres e, y la politica de seguridad vial 2013Sierra Francisco Justo
 
17 hauer web9 lessons learned white paper
17 hauer web9 lessons learned white paper17 hauer web9 lessons learned white paper
17 hauer web9 lessons learned white paperSierra Francisco Justo
 
Review of optimal speed model
Review of optimal speed modelReview of optimal speed model
Review of optimal speed modelAbdulkadir Isa
 
2006 - ASSESSMENT OF ITS MEASURES FOR SOUTH AFRICA.pdf
2006 - ASSESSMENT OF ITS MEASURES FOR SOUTH AFRICA.pdf2006 - ASSESSMENT OF ITS MEASURES FOR SOUTH AFRICA.pdf
2006 - ASSESSMENT OF ITS MEASURES FOR SOUTH AFRICA.pdfEmmanuel Eliya
 
A Review On The Factors Influencing The Park-And-Ride Traffic Management Method
A Review On The Factors Influencing The Park-And-Ride Traffic Management MethodA Review On The Factors Influencing The Park-And-Ride Traffic Management Method
A Review On The Factors Influencing The Park-And-Ride Traffic Management MethodCrystal Sanchez
 

Similar to Masters Dissertation Posters 2015 (20)

A Case Study Of Public Bus Driver Behaviour At Batu Feringghi
A Case Study Of Public Bus Driver Behaviour At Batu FeringghiA Case Study Of Public Bus Driver Behaviour At Batu Feringghi
A Case Study Of Public Bus Driver Behaviour At Batu Feringghi
 
Session 50 Andereas Tapani
Session 50 Andereas TapaniSession 50 Andereas Tapani
Session 50 Andereas Tapani
 
Pedestrian Conflict Risk Model at Unsignalized Locations on a Community Street
Pedestrian Conflict Risk Model at Unsignalized Locations on a Community StreetPedestrian Conflict Risk Model at Unsignalized Locations on a Community Street
Pedestrian Conflict Risk Model at Unsignalized Locations on a Community Street
 
Human Factor
Human FactorHuman Factor
Human Factor
 
To Find out the Relationship between Errors, Lapses, Violations and Traffic A...
To Find out the Relationship between Errors, Lapses, Violations and Traffic A...To Find out the Relationship between Errors, Lapses, Violations and Traffic A...
To Find out the Relationship between Errors, Lapses, Violations and Traffic A...
 
Behavioural meetup: Prof. Alan Tapp
Behavioural meetup: Prof. Alan TappBehavioural meetup: Prof. Alan Tapp
Behavioural meetup: Prof. Alan Tapp
 
International Refereed Journal of Engineering and Science (IRJES)
International Refereed Journal of Engineering and Science (IRJES)International Refereed Journal of Engineering and Science (IRJES)
International Refereed Journal of Engineering and Science (IRJES)
 
The Effects of Vehicle Speeds on Accident Frequency within Settlements along ...
The Effects of Vehicle Speeds on Accident Frequency within Settlements along ...The Effects of Vehicle Speeds on Accident Frequency within Settlements along ...
The Effects of Vehicle Speeds on Accident Frequency within Settlements along ...
 
A New Generalized Mixed Data Model with Applications to Transport Analysis
A New Generalized Mixed Data Model with Applications to Transport AnalysisA New Generalized Mixed Data Model with Applications to Transport Analysis
A New Generalized Mixed Data Model with Applications to Transport Analysis
 
Sucha
SuchaSucha
Sucha
 
Awareness on Road Signs and Markings of Drivers and Passengers along Maharlik...
Awareness on Road Signs and Markings of Drivers and Passengers along Maharlik...Awareness on Road Signs and Markings of Drivers and Passengers along Maharlik...
Awareness on Road Signs and Markings of Drivers and Passengers along Maharlik...
 
Road User priorities July 2015
Road User priorities July 2015Road User priorities July 2015
Road User priorities July 2015
 
17 hauer web9 lessons learned white paper
17 hauer web9 lessons learned white paper17 hauer web9 lessons learned white paper
17 hauer web9 lessons learned white paper
 
Las tres e, y la politica de seguridad vial 2013
Las tres e, y la politica de seguridad vial 2013Las tres e, y la politica de seguridad vial 2013
Las tres e, y la politica de seguridad vial 2013
 
17 hauer web9 lessons learned white paper
17 hauer web9 lessons learned white paper17 hauer web9 lessons learned white paper
17 hauer web9 lessons learned white paper
 
Review of optimal speed model
Review of optimal speed modelReview of optimal speed model
Review of optimal speed model
 
2006 - ASSESSMENT OF ITS MEASURES FOR SOUTH AFRICA.pdf
2006 - ASSESSMENT OF ITS MEASURES FOR SOUTH AFRICA.pdf2006 - ASSESSMENT OF ITS MEASURES FOR SOUTH AFRICA.pdf
2006 - ASSESSMENT OF ITS MEASURES FOR SOUTH AFRICA.pdf
 
The Street Tree Effect and Driver Safety
The Street Tree Effect and Driver SafetyThe Street Tree Effect and Driver Safety
The Street Tree Effect and Driver Safety
 
Teen Driving final
Teen Driving finalTeen Driving final
Teen Driving final
 
A Review On The Factors Influencing The Park-And-Ride Traffic Management Method
A Review On The Factors Influencing The Park-And-Ride Traffic Management MethodA Review On The Factors Influencing The Park-And-Ride Traffic Management Method
A Review On The Factors Influencing The Park-And-Ride Traffic Management Method
 

More from Institute for Transport Studies (ITS)

Transport Projects Aimed at Fostering Economic Growth – experience in the UK ...
Transport Projects Aimed at Fostering Economic Growth – experience in the UK ...Transport Projects Aimed at Fostering Economic Growth – experience in the UK ...
Transport Projects Aimed at Fostering Economic Growth – experience in the UK ...Institute for Transport Studies (ITS)
 
London's Crossrail Scheme - its evolution, governance, financing and challenges
London's Crossrail Scheme  - its evolution, governance, financing and challengesLondon's Crossrail Scheme  - its evolution, governance, financing and challenges
London's Crossrail Scheme - its evolution, governance, financing and challengesInstitute for Transport Studies (ITS)
 
A clustering method based on repeated trip behaviour to identify road user cl...
A clustering method based on repeated trip behaviour to identify road user cl...A clustering method based on repeated trip behaviour to identify road user cl...
A clustering method based on repeated trip behaviour to identify road user cl...Institute for Transport Studies (ITS)
 
Social networks, activities, and travel - building links to understand behaviour
Social networks, activities, and travel - building links to understand behaviourSocial networks, activities, and travel - building links to understand behaviour
Social networks, activities, and travel - building links to understand behaviourInstitute for Transport Studies (ITS)
 
Agent based car following model for heterogeneities of platoon driving with v...
Agent based car following model for heterogeneities of platoon driving with v...Agent based car following model for heterogeneities of platoon driving with v...
Agent based car following model for heterogeneities of platoon driving with v...Institute for Transport Studies (ITS)
 
Shipping by the crowd - empirical analysis of operations and behavior
Shipping by the crowd - empirical analysis of operations and behaviorShipping by the crowd - empirical analysis of operations and behavior
Shipping by the crowd - empirical analysis of operations and behaviorInstitute for Transport Studies (ITS)
 

More from Institute for Transport Studies (ITS) (20)

Transport Projects Aimed at Fostering Economic Growth – experience in the UK ...
Transport Projects Aimed at Fostering Economic Growth – experience in the UK ...Transport Projects Aimed at Fostering Economic Growth – experience in the UK ...
Transport Projects Aimed at Fostering Economic Growth – experience in the UK ...
 
BA Geography with Transport Studies at the University of Leeds
BA Geography with Transport Studies at the University of LeedsBA Geography with Transport Studies at the University of Leeds
BA Geography with Transport Studies at the University of Leeds
 
Highways Benchmarking - Accelerating Impact
Highways Benchmarking - Accelerating ImpactHighways Benchmarking - Accelerating Impact
Highways Benchmarking - Accelerating Impact
 
Using telematics data to research traffic related air pollution
Using telematics data to research traffic related air pollutionUsing telematics data to research traffic related air pollution
Using telematics data to research traffic related air pollution
 
Institute for Transport Studies - Masters Open Day 2017
Institute for Transport Studies - Masters Open Day 2017Institute for Transport Studies - Masters Open Day 2017
Institute for Transport Studies - Masters Open Day 2017
 
London's Crossrail Scheme - its evolution, governance, financing and challenges
London's Crossrail Scheme  - its evolution, governance, financing and challengesLondon's Crossrail Scheme  - its evolution, governance, financing and challenges
London's Crossrail Scheme - its evolution, governance, financing and challenges
 
Secretary of State Visit
Secretary of State VisitSecretary of State Visit
Secretary of State Visit
 
Business model innovation for electrical vehicle futures
Business model innovation for electrical vehicle futuresBusiness model innovation for electrical vehicle futures
Business model innovation for electrical vehicle futures
 
A clustering method based on repeated trip behaviour to identify road user cl...
A clustering method based on repeated trip behaviour to identify road user cl...A clustering method based on repeated trip behaviour to identify road user cl...
A clustering method based on repeated trip behaviour to identify road user cl...
 
Cars cars everywhere
Cars cars everywhereCars cars everywhere
Cars cars everywhere
 
Annual Review 2015-16 - University of leeds
Annual Review 2015-16 - University of leedsAnnual Review 2015-16 - University of leeds
Annual Review 2015-16 - University of leeds
 
Social networks, activities, and travel - building links to understand behaviour
Social networks, activities, and travel - building links to understand behaviourSocial networks, activities, and travel - building links to understand behaviour
Social networks, activities, and travel - building links to understand behaviour
 
Rail freight in Japan - track access
Rail freight in Japan - track accessRail freight in Japan - track access
Rail freight in Japan - track access
 
Real time traffic management - challenges and solutions
Real time traffic management - challenges and solutionsReal time traffic management - challenges and solutions
Real time traffic management - challenges and solutions
 
Proportionally fair scheduling for traffic light networks
Proportionally fair scheduling for traffic light networksProportionally fair scheduling for traffic light networks
Proportionally fair scheduling for traffic light networks
 
Capacity maximising traffic signal control policies
Capacity maximising traffic signal control policiesCapacity maximising traffic signal control policies
Capacity maximising traffic signal control policies
 
Bayesian risk assessment of autonomous vehicles
Bayesian risk assessment of autonomous vehiclesBayesian risk assessment of autonomous vehicles
Bayesian risk assessment of autonomous vehicles
 
Agent based car following model for heterogeneities of platoon driving with v...
Agent based car following model for heterogeneities of platoon driving with v...Agent based car following model for heterogeneities of platoon driving with v...
Agent based car following model for heterogeneities of platoon driving with v...
 
A new theory of lane selection on highways
A new theory of lane selection on highwaysA new theory of lane selection on highways
A new theory of lane selection on highways
 
Shipping by the crowd - empirical analysis of operations and behavior
Shipping by the crowd - empirical analysis of operations and behaviorShipping by the crowd - empirical analysis of operations and behavior
Shipping by the crowd - empirical analysis of operations and behavior
 

Recently uploaded

USPS® Forced Meter Migration - How to Know if Your Postage Meter Will Soon be...
USPS® Forced Meter Migration - How to Know if Your Postage Meter Will Soon be...USPS® Forced Meter Migration - How to Know if Your Postage Meter Will Soon be...
USPS® Forced Meter Migration - How to Know if Your Postage Meter Will Soon be...Postal Advocate Inc.
 
How to do quick user assign in kanban in Odoo 17 ERP
How to do quick user assign in kanban in Odoo 17 ERPHow to do quick user assign in kanban in Odoo 17 ERP
How to do quick user assign in kanban in Odoo 17 ERPCeline George
 
Judging the Relevance and worth of ideas part 2.pptx
Judging the Relevance  and worth of ideas part 2.pptxJudging the Relevance  and worth of ideas part 2.pptx
Judging the Relevance and worth of ideas part 2.pptxSherlyMaeNeri
 
ENGLISH6-Q4-W3.pptxqurter our high choom
ENGLISH6-Q4-W3.pptxqurter our high choomENGLISH6-Q4-W3.pptxqurter our high choom
ENGLISH6-Q4-W3.pptxqurter our high choomnelietumpap1
 
Field Attribute Index Feature in Odoo 17
Field Attribute Index Feature in Odoo 17Field Attribute Index Feature in Odoo 17
Field Attribute Index Feature in Odoo 17Celine George
 
ISYU TUNGKOL SA SEKSWLADIDA (ISSUE ABOUT SEXUALITY
ISYU TUNGKOL SA SEKSWLADIDA (ISSUE ABOUT SEXUALITYISYU TUNGKOL SA SEKSWLADIDA (ISSUE ABOUT SEXUALITY
ISYU TUNGKOL SA SEKSWLADIDA (ISSUE ABOUT SEXUALITYKayeClaireEstoconing
 
Barangay Council for the Protection of Children (BCPC) Orientation.pptx
Barangay Council for the Protection of Children (BCPC) Orientation.pptxBarangay Council for the Protection of Children (BCPC) Orientation.pptx
Barangay Council for the Protection of Children (BCPC) Orientation.pptxCarlos105
 
DATA STRUCTURE AND ALGORITHM for beginners
DATA STRUCTURE AND ALGORITHM for beginnersDATA STRUCTURE AND ALGORITHM for beginners
DATA STRUCTURE AND ALGORITHM for beginnersSabitha Banu
 
4.18.24 Movement Legacies, Reflection, and Review.pptx
4.18.24 Movement Legacies, Reflection, and Review.pptx4.18.24 Movement Legacies, Reflection, and Review.pptx
4.18.24 Movement Legacies, Reflection, and Review.pptxmary850239
 
Grade 9 Q4-MELC1-Active and Passive Voice.pptx
Grade 9 Q4-MELC1-Active and Passive Voice.pptxGrade 9 Q4-MELC1-Active and Passive Voice.pptx
Grade 9 Q4-MELC1-Active and Passive Voice.pptxChelloAnnAsuncion2
 
AMERICAN LANGUAGE HUB_Level2_Student'sBook_Answerkey.pdf
AMERICAN LANGUAGE HUB_Level2_Student'sBook_Answerkey.pdfAMERICAN LANGUAGE HUB_Level2_Student'sBook_Answerkey.pdf
AMERICAN LANGUAGE HUB_Level2_Student'sBook_Answerkey.pdfphamnguyenenglishnb
 
Like-prefer-love -hate+verb+ing & silent letters & citizenship text.pdf
Like-prefer-love -hate+verb+ing & silent letters & citizenship text.pdfLike-prefer-love -hate+verb+ing & silent letters & citizenship text.pdf
Like-prefer-love -hate+verb+ing & silent letters & citizenship text.pdfMr Bounab Samir
 
Computed Fields and api Depends in the Odoo 17
Computed Fields and api Depends in the Odoo 17Computed Fields and api Depends in the Odoo 17
Computed Fields and api Depends in the Odoo 17Celine George
 
ECONOMIC CONTEXT - PAPER 1 Q3: NEWSPAPERS.pptx
ECONOMIC CONTEXT - PAPER 1 Q3: NEWSPAPERS.pptxECONOMIC CONTEXT - PAPER 1 Q3: NEWSPAPERS.pptx
ECONOMIC CONTEXT - PAPER 1 Q3: NEWSPAPERS.pptxiammrhaywood
 
call girls in Kamla Market (DELHI) 🔝 >༒9953330565🔝 genuine Escort Service 🔝✔️✔️
call girls in Kamla Market (DELHI) 🔝 >༒9953330565🔝 genuine Escort Service 🔝✔️✔️call girls in Kamla Market (DELHI) 🔝 >༒9953330565🔝 genuine Escort Service 🔝✔️✔️
call girls in Kamla Market (DELHI) 🔝 >༒9953330565🔝 genuine Escort Service 🔝✔️✔️9953056974 Low Rate Call Girls In Saket, Delhi NCR
 
ANG SEKTOR NG agrikultura.pptx QUARTER 4
ANG SEKTOR NG agrikultura.pptx QUARTER 4ANG SEKTOR NG agrikultura.pptx QUARTER 4
ANG SEKTOR NG agrikultura.pptx QUARTER 4MiaBumagat1
 
Difference Between Search & Browse Methods in Odoo 17
Difference Between Search & Browse Methods in Odoo 17Difference Between Search & Browse Methods in Odoo 17
Difference Between Search & Browse Methods in Odoo 17Celine George
 
Roles & Responsibilities in Pharmacovigilance
Roles & Responsibilities in PharmacovigilanceRoles & Responsibilities in Pharmacovigilance
Roles & Responsibilities in PharmacovigilanceSamikshaHamane
 

Recently uploaded (20)

USPS® Forced Meter Migration - How to Know if Your Postage Meter Will Soon be...
USPS® Forced Meter Migration - How to Know if Your Postage Meter Will Soon be...USPS® Forced Meter Migration - How to Know if Your Postage Meter Will Soon be...
USPS® Forced Meter Migration - How to Know if Your Postage Meter Will Soon be...
 
How to do quick user assign in kanban in Odoo 17 ERP
How to do quick user assign in kanban in Odoo 17 ERPHow to do quick user assign in kanban in Odoo 17 ERP
How to do quick user assign in kanban in Odoo 17 ERP
 
Judging the Relevance and worth of ideas part 2.pptx
Judging the Relevance  and worth of ideas part 2.pptxJudging the Relevance  and worth of ideas part 2.pptx
Judging the Relevance and worth of ideas part 2.pptx
 
ENGLISH6-Q4-W3.pptxqurter our high choom
ENGLISH6-Q4-W3.pptxqurter our high choomENGLISH6-Q4-W3.pptxqurter our high choom
ENGLISH6-Q4-W3.pptxqurter our high choom
 
Field Attribute Index Feature in Odoo 17
Field Attribute Index Feature in Odoo 17Field Attribute Index Feature in Odoo 17
Field Attribute Index Feature in Odoo 17
 
ISYU TUNGKOL SA SEKSWLADIDA (ISSUE ABOUT SEXUALITY
ISYU TUNGKOL SA SEKSWLADIDA (ISSUE ABOUT SEXUALITYISYU TUNGKOL SA SEKSWLADIDA (ISSUE ABOUT SEXUALITY
ISYU TUNGKOL SA SEKSWLADIDA (ISSUE ABOUT SEXUALITY
 
Barangay Council for the Protection of Children (BCPC) Orientation.pptx
Barangay Council for the Protection of Children (BCPC) Orientation.pptxBarangay Council for the Protection of Children (BCPC) Orientation.pptx
Barangay Council for the Protection of Children (BCPC) Orientation.pptx
 
Model Call Girl in Tilak Nagar Delhi reach out to us at 🔝9953056974🔝
Model Call Girl in Tilak Nagar Delhi reach out to us at 🔝9953056974🔝Model Call Girl in Tilak Nagar Delhi reach out to us at 🔝9953056974🔝
Model Call Girl in Tilak Nagar Delhi reach out to us at 🔝9953056974🔝
 
DATA STRUCTURE AND ALGORITHM for beginners
DATA STRUCTURE AND ALGORITHM for beginnersDATA STRUCTURE AND ALGORITHM for beginners
DATA STRUCTURE AND ALGORITHM for beginners
 
4.18.24 Movement Legacies, Reflection, and Review.pptx
4.18.24 Movement Legacies, Reflection, and Review.pptx4.18.24 Movement Legacies, Reflection, and Review.pptx
4.18.24 Movement Legacies, Reflection, and Review.pptx
 
Grade 9 Q4-MELC1-Active and Passive Voice.pptx
Grade 9 Q4-MELC1-Active and Passive Voice.pptxGrade 9 Q4-MELC1-Active and Passive Voice.pptx
Grade 9 Q4-MELC1-Active and Passive Voice.pptx
 
OS-operating systems- ch04 (Threads) ...
OS-operating systems- ch04 (Threads) ...OS-operating systems- ch04 (Threads) ...
OS-operating systems- ch04 (Threads) ...
 
AMERICAN LANGUAGE HUB_Level2_Student'sBook_Answerkey.pdf
AMERICAN LANGUAGE HUB_Level2_Student'sBook_Answerkey.pdfAMERICAN LANGUAGE HUB_Level2_Student'sBook_Answerkey.pdf
AMERICAN LANGUAGE HUB_Level2_Student'sBook_Answerkey.pdf
 
Like-prefer-love -hate+verb+ing & silent letters & citizenship text.pdf
Like-prefer-love -hate+verb+ing & silent letters & citizenship text.pdfLike-prefer-love -hate+verb+ing & silent letters & citizenship text.pdf
Like-prefer-love -hate+verb+ing & silent letters & citizenship text.pdf
 
Computed Fields and api Depends in the Odoo 17
Computed Fields and api Depends in the Odoo 17Computed Fields and api Depends in the Odoo 17
Computed Fields and api Depends in the Odoo 17
 
ECONOMIC CONTEXT - PAPER 1 Q3: NEWSPAPERS.pptx
ECONOMIC CONTEXT - PAPER 1 Q3: NEWSPAPERS.pptxECONOMIC CONTEXT - PAPER 1 Q3: NEWSPAPERS.pptx
ECONOMIC CONTEXT - PAPER 1 Q3: NEWSPAPERS.pptx
 
call girls in Kamla Market (DELHI) 🔝 >༒9953330565🔝 genuine Escort Service 🔝✔️✔️
call girls in Kamla Market (DELHI) 🔝 >༒9953330565🔝 genuine Escort Service 🔝✔️✔️call girls in Kamla Market (DELHI) 🔝 >༒9953330565🔝 genuine Escort Service 🔝✔️✔️
call girls in Kamla Market (DELHI) 🔝 >༒9953330565🔝 genuine Escort Service 🔝✔️✔️
 
ANG SEKTOR NG agrikultura.pptx QUARTER 4
ANG SEKTOR NG agrikultura.pptx QUARTER 4ANG SEKTOR NG agrikultura.pptx QUARTER 4
ANG SEKTOR NG agrikultura.pptx QUARTER 4
 
Difference Between Search & Browse Methods in Odoo 17
Difference Between Search & Browse Methods in Odoo 17Difference Between Search & Browse Methods in Odoo 17
Difference Between Search & Browse Methods in Odoo 17
 
Roles & Responsibilities in Pharmacovigilance
Roles & Responsibilities in PharmacovigilanceRoles & Responsibilities in Pharmacovigilance
Roles & Responsibilities in Pharmacovigilance
 

Masters Dissertation Posters 2015

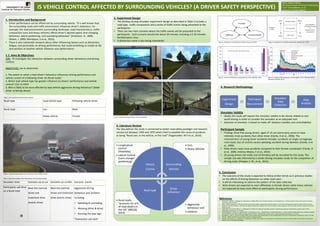
  • 1. 1. Introduction and Background • Driver performance can be influenced by surrounding vehicle. “It is well known that the surrounding roads and traffic environment influences driver’s behaviour; for example, the road environment (surrounding landscape, road characteristics), traffic composition (cars and heavy vehicles) affects driver’s desired speed, lane changing behaviour, lateral positioning, and overtaking behaviour” (Antonson, H., 2009; Olstam, J. 2009; Moridpour, S et al., 2010). • There is also substantial research about other influencing factors such as distraction, fatigue, and personality on driving performance, but could something as simple as the lane position of another vehicle influence your performance. 1.1. Aims & Objectives AIM: To investigate the interaction between surrounding driver behaviours and driving controls. OBJECTIVES: are to determine: 1. The extent to which a lead driver’s behaviour influences driving performance and vehicle control of a following driver on (Rural roads) 2. Which lead vehicle type has greater influence on drivers’ performance and vehicle control? (Car vs HGV) 3. Who is likely to be more affected by lead vehicle aggressive driving behaviour? (Male driver vs female driver) 4. Research Methodology Simulator Validity • Ideally this study will require the simulator validity to be closely related to real world driving in order to consider the simulator as an adequate tool. • Selection of simulator is based on trade-off between (validity and controllability) Participant Sample • Findings show that young drivers aged 17-25 are particularly prone to have relatively more accidents than other driver (Clarke, D et al., 2006). The characteristics of young driver accidents includes: accidents on single carriageway rural roads; loss of control; excess speeding; accident during darkness (Clarke, D et al., 2006). • Male drivers have more accidents compared to their female counterpart (Clarke, D et al., 2006; Jiménez-Mejías, E et al., 2014). • 20 young drivers (10 males and 10 females) will be recruited for this study. This sample size was informed by a similar driving simulator study on the comparison of driving styles (Pampel, S. M., et al., 2015). 3. Literature Review The idea behind this study is connected to earlier road safety paradigm and research carried out between 1950 and 1970 which tried to establish the cause of accidents as being “Road user, or the vehicle, or the road” (Hagenzieker, M.P et al., 2014). References  Antonson, H., Mårdh, S., Wiklund, M., & Blomqvist, G. (2009). Effect of surrounding landscape on driving behaviour: A driving simulator study. Journal of Environmental Psychology, 29(4), 493-502.  Bella, F. (2005). Validation of a driving simulator for work zone design. Transportation Research Record: Journal of the Transportation Research Board, 1937(1), 136-144.  Clarke, D. D., Ward, P., Bartle, C., & Truman, W. (2006). Young driver accidents in the UK: The influence of age, experience, and time of day. Accident Analysis & Prevention, 38(5), 871-878.  Hagenzieker, M. P., Commandeur, J. J., & Bijleveld, F. D. (2014). The history of road safety research: A quantitative approach. Transportation research part F: traffic psychology and behaviour, 25, 150-162.  Jiménez-Mejías, E., Prieto, C. A., Martínez-Ruiz, V., del Castillo, J. D. D. L., Lardelli-Claret, P., & Jimenez-Moleon, J. J. (2014). Gender-related differences in distances travelled, driving behaviour and traffic accidents among university students. Transportation research part F: traffic psychology and behaviour, 27, 81-89.  Moridpour, S., Rose, G., & Sarvi, M. (2010). Effect of surrounding traffic characteristics on lane changing behavior. Journal of Transportation Engineering, 136(11), 973-985.  Olstam, J. (2009). Simulation of surrounding vehicles in driving simulators.  Pampel, S. M., Jamson, S. L., Hibberd, D. L., & Barnard, Y. (2015). How I reduce fuel consumption: An experimental study on mental models of eco-driving. Transportation Research Part C: Emerging Technologies. IS VEHICLE CONTROL AFFECTED BY SURROUNDING VEHICLES? (A DRIVER SAFETY PERSPECTIVE) Name: Adesina AdelusiName: Adesina Adelusi MSc (Eng) Transport Planning & Engineering Email: ts14aoa@leeds. ac.uk Supervisor: Dr Daryl Hibberd Road type Lead vehicle type Following vehicle driver Rural road Car Male Heavy vehicle Female 2. Experiment Design • The desktop driving simulator experiment design as described in Table 2 includes a road type, traffic composition and a series of traffic events being presented to the participants. • There are two main scenario where the traffic events will be presented to the participants . Each scenario should last about 20 minutes including a 5-10 minutes familiarization time. • A distraction event is also being considered. Simulator drive Scenario car vs car Scenario car vs HGV Scenario Events Participants will drive on a Rural road Base line (normal drive) and treatment drive (events drive) Base line (normal drive) and treatment drive (events drive) Aggressive driving behaviour and violation including: • Speeding & overtaking, • Weaving (drink & drive) • Running the stop sign. *Distraction sub task? 5. Conclusion • The outcome of this study is expected to follow similar trends as in previous studies on the effects of driving behaviour on other road users. • It will be interesting to observe the pattern of the data collected. • Male drivers are expected to react differently to female drivers while heavy vehicles are expected to have more effect on participants driving performance. • Aggressive behaviour and • violation • Rural roads “accounts for 2/3 of road deaths in the UK” (RRCGB, 2013) • Cars • Heavy Vehicles • Longitudinal control (Headway) • Lateral Control (Lane change/ positioning) Vehicle Control Surrounding Vehicles Driver behaviour Road type Figure 5, Factors contributing to young drivers accident (RRCGB, 2011). Figure 6, Accident involving young car drivers aged 17-24 in 2012 per million population (RRCGB, 2012) Figure 3, Interaction contributing to accident cause (Lai, 2014). Figure 4, Comparison of available experiment methods (Lai, 2014). Figure 2, Desktop driving simulator and its capabilities Figure 1, Typical driving situation on a rural road in the UK (Riley, 2014). Table 1: The fundamental basis for this research Table 2: Experiment design to be implemented in the driving simulator Experiment Design Participant Recruitment Simulator Data Collection Data Analysis
  • 2. Understanding Choice of Departure Airport and its Relation to Surface Access A Case Study of London Gatwick and London Stansted Airports Problem: Currently, airport surface access in the UK is heavily reliant on trips by private car, which has resulted in congestion on local road networks and raised levels of pollution from vehicle emissions. 57.2% 42.6% Mode Share to London Gatwick Airport Private Transport Public Transport 48.3%51.5% Mode Share to London Stansted Airport Private Transport Public Transport  Both airports are the artery for short haul and point to point flights across Europe which may have similar travel pattern.  Majority of the catchment area of both airports are from South East of England.  Both airports have a good score in public transport mode share!  To understand what is most important to air passengers when making their travel decisions.  To understand how the current surface access to London Gatwick and London Stansted airports influence passengers on selecting departure airport.  To understand the relationship between demographics of airport passengers and their choice of departure airport with their preferred mode of transportation.  To model the current car parking charges and public transport fares at both airports and evaluate the effects on mode shares. Research Objectives Methodology  Structured interviews to be performed on individuals particularly flown from either two of the survey airports to collect demographic information such as age, car ownership etc with their respective transportation mode to airport. Besides that, comments from respondents to gain insight into the current issues related to surface access to airport that are not known to the researchers.  Data can be collected either in the departure lounge of airport or in the train (provided with access permission), or from streets of both airports catchment area if access to the restricted area is denied. Sampling methods are carefully evaluated to avoid sampling bias.  Passengers Survey and Catchment Analysis data from UK Civil Aviation Authority (CAA) could be used as Revealed Preference (RP) data to provide deeper understanding regarding the preference of departure airports.  Fares information such as airport parking charges and public transportation fares can also be collected through related authority and online.London Gatwick and London Stansted Airports? Supervisor: Bryan MatthewsVincent Chan Best P.T. Mode Share to Airport in the UK! What makes you buy a particular air ticket? Airports locations? Cheapest Ticket from A to B? Quickest way? Most convenient?Airlines?  Choice of destination and airfare are the most important drivers of airport choice.  Access costs and time are the least important. Key findings from previous research: References  Budd, T. et al. 2011. Airport surface access in the UK: A management perspective. Research in Transportation Business & Management. 1(1), pp.109-117.  Johnson, D. et al. 2014. Understanding air travellers' trade-offs between connecting flights and surface access characteristics. Journal of Air Transport Management. 34, pp.70-77.
  • 3. The Impact of High Speed Rail on Tourism − A Case Study of Shanghai Figure 1: Long-term trend line of Shanghai domestic tourist volume in the past 14 years 0 5000 10000 15000 20000 25000 30000 1999 2000 2001 2002 2003 2004 2005 2006 2007 2008 2009 2010 2011 2012 2013 Poster: YIFAN WANG (ml13y3w@leeds.ac.uk) Programme of Study: Msc Transport Planning Supervisor: BRYAN MATTHEWS Figure 2: High Speed Rail in Shanghai Background Most researches about the impact of High Speed Rail (HSR) on tourism have focused on Europe (e.g. France and Spain), and the major direction of these studies explores whether the HSR service can be a key factor to influence the choice of the destination for tourism (Francesca et al., 2015; Marie et al., 2014). However, the study area of the impact of HSR on actual tourist volumes and some specific tourist travel behaviour is rarely discussed. HSR is developing rapidly in China, especially in several mega cities, such as Shanghai, Beijing, etc., however, there are only a few studies that refer to this topic, and most of them are just based on theoretical descriptions. Therefore, my research will mainly concentrate on whether HSR can affect the tourist travel behaviour and actual tourist volume in the Chinese tourism market, and how to make the service better to improve the tourist industry with a case study of Shanghai. Objectives 1) Discuss the relationship between HSR and tourism based on a review of literature. 2) Two sub objectives based on the case of Shanghai:  Examine the travel behaviour of domestic tourists influenced by HSR through an online survey.  Examine the impact of HSR on domestic tourist volume in Shanghai through the Tourism Background Trend Line (TBTL) model. 3) Put forward some recommendations to make HSR serve the tourism market better in China. Methodology Proposed scope: The data being used in this case will be domestic data. According to Francesca et al. (2015) and Marie et al. (2014), the impact of HSR is mainly to influence domestic tourists, and this effect will be more significant in China because there is almost no international HSR lines so far. In addition, the TBTL model is mostly widely used on domestic tourism (Li, 2009; Liu et al., 2012; Zhang et al., 2013). 1) Online survey  Targeted group: people who don't live in but have travelled to Shanghai at least once in the previous 2 years;  Proposed key data to be collected (relate to questions): travel purpose, origin, route choice, transport mode choice, personal information (e.g. age, income, education, etc.), travel frequency, travel scope and duration time. 2) TBTL Model This model is most widely used in domestic tourist market research in China, which was put forward by Gennian Sun in 1998. The key data we need in this case is the number of domestic tourist travel to Shanghai every year, which can be accessed from Shanghai Statistical Yearbook (2000-2014). The Anticipated Result According to the references, in most cases, HSR does influence the destination choice of tourism, therefore, the result of this study is expected that HSR will have an impact on both tourist travel behaviour and domestic tourist volume in Chinese tourism market to some extent. Main References: Francesca, P. et al. (2015). High Speed Rail and the Tourism Market: Evidence from the Madrid Case Study. Transport Policy. 37, pp.187-194. Marie, D. et al. (2014). Can High Speed Rail Foster the Choice of Destination for Tourism Purpose? Procedia – Social and Behavioral Science. 111. pp. 166-175. Liu, C., Wang, L. and Yang, A. (2012). Research on Inbound Tourist Market of Liaoning Province Based on Tourism Background Trend Line. ICICA 2012, Part 1, CCIS 307, pp. 783-788. Zhang, W. et al. (2013). Study on the Impact of High Speed Railway on Urban Tourism – Taking Nanjing as an Example. Economic Geography. 33(7), pp.163-168. Li, Z. (2009). A Research on the Foundation and Application of the Background Trend Line of Domestic Tourism in China. Statistics and Information Forum. 24(1), pp.62-65.
  • 4. Research on Capacity Reduced by Taxi Picking Up on Curb Parking Facilities Presenter: Yihang Liu   Email: ml13y5l@leeds.ac.uk    Msc (Eng) Transport Planning and Engineering     Supervisor: Dr. Haibo Chen Background According to DFT  (2013), there were  an estimated 78  thousand taxis in  England and Wales  at end March 2013  and the grow ing  rapidly from 1985  (see figure right).  In most major cities, the taxi is a more convenient  mode due to its speediness, door‐to‐door attribute,  privacy, comfort, long‐time operation and lack of  parking fees. The layout of harbor‐shaped taxi stop has negative  impact on the road capacity, as the limited number of  parking space leading the other taxis should occurs  queuing frequently and block one lanes of the urban road  (see figure), which causes extra delay and the congestion  on the links. So that, this work is going to model the  probability of the queue happened and the road capacity  reduced. Furthermore, calibration of the formula is  obtained with the survey data, and validation is  comparison between the micro‐simulation software  results and the calculated results. Objective This work aims to evaluate the harbor‐shaped taxi stop  impact on the capacity reduction in urban area and  obtain a formula to express the rule of actual flow. Data collection Time: afternoon peak period Facility:   video camera Data category:Spot speed, Arrival flow, Arrival taxi flow,  Taxi stop time, Taxi stop layout Methodology Data Analysis & Expected Results The Gamma function should suit for the arrival taxi  rate and service rate to obtain the variable for the  next queuing theory. The probability of with and without queuing should  be stable, acting as the weight for capacity  derivation. After derivation process, the results calculated by  capacity formula should be close to the micro‐ simulation results.
  • 5. Acomparative study of Transport InvestmentAppraisal Tools and their implications on project selection Yvonne M Keinembabazi (MA Transport Economics) | Dr James Laird (Supervisor) | Dr Astrid Gühnemann (2nd Reader) 4. DATA 5. METHODOLOGY 7. Key Reference 0 5 10 15 20 25 30 35 40 45 50 Engineering Scores Local Consult Scores Economic Scores Composite Scores Quantity Ranking System Top Ranked Projects Selected with a $5 Billion Funding Pool No. of Projects Selected Aggregate Jobs Added (000) Aggregate GDP Added (Billion Dollars) Total Wider Benefit (Billion Dollars) r = 1 − 6∗ 𝑑2 𝑛 𝑛2−1 To compare the rankings, the sign of the Spearman correlation will determine the direction of association between the CBA rankings and GRP+B rankings.(determining whether they are in agreement or not) Spearman’s rank correlation coefficient WEISBROD, G. Incorporating economic impact metrics in transportation project ranking and selection processes. Annual Conference of the Transportation Research Board, 2011. To investigate whether there is a significant difference between project rankings recommended by BCA and GRP/$  Are projects with a more inclusive and environmental focus likely to be neglected when GRP/$ prioritization method is the basis of investment decisions?  Does GRP/$ prioritization overlook a substantial proportion of benefits provided by projects?  Is GRP/$ prioritization equivalent to Benefit-Cost Analysis? There is a range of techniques to prioritize transport projects.. Cost- Benefit Analysis (CBA) has been the most commonly used appraisal tool in Europe, Australia and some states in USA (Benefit- Cost Analysis). Frameworks differ by country. CBA challenges; Rule of a half does not measure all economy impacts from projects Alternative appraisal techniques  Multi-Criteria Analysis  Composite rating schemes e.g. Kansas (Engineering, Local consult, Economic)  Cost effectiveness e.g. ranking based on GVA/£ e.g. England City Deals (Fully devolved local transport funds);Urban Dynamic Model in West Yorkshire  Each Appraisal tool has different factor weights which may affect project selection (Weisbrod, 2011) Overall Economic Impact Change in Transport user benefits (CS) Change in systems operating costs (PS) Change in costs of externalities Investment costs (Including mitigation measures) 3. CASE STUDY: KANSAS, USA 6. COMPARING CBA AND GRP+B RANKNGS Data from Kansas Department of Transportation Systems operating cost Investment Costs Estimation of externality costs Estimation of user benefits California Life-Cycle Benefit-Cost Analysis Model Estimation of costs and benefits over the appraisal period (20 years) Apply Discount rate (CalTrans=4.0) Calculation of NPV, BCR and IRR Presentation of CBA rankings Presentation of rankings based on economic impact score (Kansas DOT) Compare CBA rankings and GRP+B rankings • Data on 121 highway expansion projects provided by Kansas DOT Data Set includes;  Traffic data  Highway design (Speed, length, lanes)  Highway accident data  Project costs 1.MOTIVATION Kansas Composite Rating Scheme Local Consult Score Economic ScoreEngineering Score Based on project impact on traffic flow Based on feedback heard at local consultation meetings Impact on state-wide Gross Regional Product (GRP) plus value of personal time and safety benefits 2. OBJECTIVE AND RESEARCH QUESTIONS
  • 6. VEHICLE HANDLING WITH SHARED HAPTIC CONTROL Xianshuchang Wu Supervisor: Hamish Jamson; Andrew Tomlinson Institute for Transport Studies, University of Leeds, Leeds, U.K. E-mail: ts14xw@leeds.ac.uk WHAT IS SHARED HAPTIC CONTROL? WHY SHARED HAPTIC CONTROL? Task Automation Response Automation Haptic Interface How does it work? Hpi From Pedal Feedback to Steering Feedback Figure 1. A schematic, symmetric representation of SHC (adapted from Mulder et al., 2012) Progress towards Haptic Shared Control MAIN FOCUS OF THIS WORK Limitation of Previous Work METHOD / PATHWAY Hypothesis Figure 3. Brief illustration for the main experimental process Mainly Estimated Dependent Measures Figure 2. University of Leeds Driving Simulator
  • 7. Incorporating Transport Network Resilience with Building Information Modelling Background What is BIM? Building Information Modeling (BIM) is a digital representation of physical and functional characteristics of a facility. A BIM is a shared knowledge resource for information about a facility forming a reliable basis for decisions during its life-cycle; defined as existing from earliest conception to demolition. In general, it is a graphic tool to make projects virtualized though the whole life-cycle. (e.g. Autodesk Civil 3D and Bently) What is traffic resilience 1. Resilience of system is a measure of the speed of its return to equilibrium. 2. The perturbation can be absorbed before the system converges on another equilibrium state  Select an appropriate transport project which is disrupt by nature– for example dual carriageway destroyed by flood.  Using the BIM software to simulate the loss on a infrastructure caused by a perturbation.  To Analyze not only the cost on the infrastructure itself but also the direct and indirect economic cost for road users in the whole traffic network cased by perturbation.  Mainly focus on the transport infrastructure damage caused by nature perturbation without casualties. And it can be restructured in short term.  Existing infrastructure built with BIM software participated in before. Proposed Scope Methodology Aims and objectives BIM software Cost of rebuild and the materials Xian Wu Msc Transport Planning & Engineering Supervisor: Haibo Chen Second Reader: Daryl Hibberd Transport Software Road users delay and the detour distance Total Impact  BIM software can provide the materials needed during the restructured then calculate the cost for this restructured  After perturbation the traffic network will be influence continuously influenced until it is totally repaired. All of the impact by perturbation can be simulated by transport software. Such as the cost of extra time and longer distane on passengers and some kind of environmental emissions caused by detour Institute of Transport Study
  • 8. What can we know about changing multi-modal travel behaviour? —Xiaojun Shao, MSc(Eng) Transport Planning and Engineering Supervisors: Caroline Mullen, Giulio Mattioli Background In National Travel Survey (NTS) 2012, an index chart shows that between 1995/97 and 2012 the average distance of car/van driver trips and passenger trips has fallen by 7% and 12% respectively. This decline in per capita car travel has attracted people’s attentions. For instance, a roundtable meeting organised by the New Zealand Ministry of Transport on this topic was convened in London on 20 May 2014. They believe that the demand for car travel is reaching its saturation level, any further growth will give little benefits for travellers (Lyons and Goodwin, 2014). Therefore, a development of other modes of transport is necessary in supporting the benefits of travellers. Meanwhile, although there is a saturation in car use, the traffic congestion problems still exist. One of the solutions transport policy is seeking for is to encourage the use of alternative modes of transport, such as cycling and walking (Ogilvie et al, 2004). For example, some policies such as car sharing and bike sharing are now influencing people’s travel behaviour by encouraging people to travel on multi-modes. For its definition, there are different understandings. Nobis (2006) describes that all persons who within 1 week use at least two different transport modes are defined to be multimodal; Kuhnimhof (2006) believes that it is a property of travel demand. No matter how many definitions exist, the importance of multimodal travel is to make people rely less on private cars. Therefore, it can be explained as a characteristic that people use modes other than just the car across their travel patterns. But what exactly is multimodal travel? To help governments and local authorities shed lights on multimodal travel, an understanding of how people are travelling these days and whether they are using only one mode are necessary. Furthermore, two key questions need to be answered: • Does the NTS provide this understanding? • How can the NTS or other surveys be improved to give a better understanding? Objectives In realistic, multimodal travel may include every available transport mode, but in this dissertation, only the choices between three groups will be used, they are driving a car, using public transport (excluding airlines and ferries), walking and cycling. Because these are the most common modes people use to travel inside a city. Scope Methodology The primary methods used to investigate the trend of multimodal travel are literature survey and questionnaire. The scope of literature survey includes papers that link multimodal travel to congestion management. For questionnaire method, there are three steps could be taken in order to fulfil the investigation: • Identify the gap and limitation of multi-modal travel in the questionnaire used in National Travel Survey; • Determine what questions should be included and provide options for participants to choose; • Decide the sample size of the survey and provide the questionnaires online for students and staff in ITS and other departments. For the sample size, Peter et al. (2011) had a study on European multimodal journey, they designed a questionnaire contains 18 questions and put it online for people to participate. In the end, they have 200 responses in total which provides an effective result. Therefore, a roughly 200 participants are expected when doing the dissertation. The analysis will be done with data mainly from National Travel Survey. Data Expected Findings UNIVERSITY OF LEEDS Institute for Transport Studies • The NTS is an established series of household surveys of personal travel and it has been running continuously since 1988. This study will mainly use the data between 2002 and 2012 to analyse the trends. • NTS data is collected via two main sources - interviews with people in their homes, and a diary that they keep for a week to record their travel. It covers travel by all age groups, including children. An example of how British people travelled in 2012 From literature and data analysis, these are the results I expect to see: • Develop a method to determine whether people are becoming more multimodal. • Multimodal travel can relief traffic congestion to some extent. • The newly designed questionnaire can more capture people’s mode choice of travel than the travel diary used in NTS.
  • 9. Night-time Driving and Distraction Xue Ding. MSC Transport Planning. Supervisor: Georgios Kountouriotis E-mail Address: ml13x2d@leeds.ac.uk.  Night – time driving expose to higher risk to accident than day time. Number of miles driven decreases substantially at night compared with daytime, yet more than half of all traffic deaths occur after dark.  Is driving distraction contribute to this increase in accident?  This research uses driving simulator to collect the driving performance data and then compare the influence of different factors to driving performance. Prediction  Comparing with day-time driving, eye- movements (PRC) of night-time might rise due to the dark view.  Steering wheel reversal rate in bend road is easily affected by distraction than straight road  Visual distraction produced by in-vehicle information system has more significant influence on SDLP than visual distractionn on road centre. References  Plainis, S., Murray, I. J., & Pallikaris, I. G. (2006). Road traffic casualties: understanding the night- time death toll. Injury Prevention, 12(2), 125-138.  Pettitt, M., Burnett, G. E., & Stevens, A. (2005). Defining driver distraction. In12th World Congress on Intelligent Transport Systems.  Stutts, J., Feaganes, J., Reinfurt, D., Rodgman, E., Hamlett, C., Gish, K., & Staplin, L. (2005). Driver's exposure to distractions in their natural driving environment. Accident Analysis & Prevention, 37(6), 1093-1101.  Merat, N., & Jamson, A. H. (2008). The effect of stimulus modality on signal detection: Implications for assessing the safety of in-vehicle technology.Human Factors: The Journal of the Human Factors and Ergonomics Society,50(1), 145-158. Time Road Task Day-time Night-time Straight road Bend road Visual (Center) Visual (IVIS) Count back Baseline (No Task) Distraction source % of drivers Outside person, object. events 29.4 Adjusting radio, cassette, CD 11.4 Other occupant in vehicle 10.9 Moving object ahead 4.3 Other device/object brought into vehicle 2.9 Adjusting vehicle/climate control 2.8 Eating or drinking 1.7 Using/dialing mobile phone 1.5 Smoking related 0.9 Other distraction 25.6 Unknown distraction 8.6 Percentage of driver who cited each distraction source as contributing to crashed Total number of participant 20 Age 20-30 Gender 10 male & 10 female Driving experience Over 2 years Preparation before experiment Provided with written instructions about the experiment Driving time in experiment 30 minutes Methods University of Leeds driving simulator will be employed to mimic driving with different factors Fig. 1. The University of Leeds Driving Simulator Fig.2. night-time view in driving simulator (urban & rural) • Steering wheel reversal rate • Standard deviation lateral position (SDLP) • Percentage of road centre (PRC) • Data analysis tool: SPSS • Data analysis method: Repeated Measures ANOVA Introduction  Distraction is “attention given to a non-driving- related activity. Typically to the detriment of driving performance”  Driver distraction plays an important role in crash
  • 10. Simulate SATURN Scenario 3 Adjusted Capacity Network 2009 Existing Leeds OD Matrix Optimal Signal Plan from LINSIG Scenario 1 (Base Scenario) 2009 Existing Leeds Network 2009 Existing Leeds OD Matrix 2009 Existing Leeds Signal Plan Scenario 2 Adjusted Capacity Network 2009 Existing Leeds OD Matrix 2009 Existing Leeds Signal Plan Find Optimal Signal Plan using LINSIG Simulate DRACULA SATPIG SPATULA Detailed Public Transport Modelling of Bus Frequencies, Bus Stop Locations etc. Adjust the Road Supply Condition/Capacity due to Road Work in Network.dat Comparative analysis of outputs from Scenario Runs SATURN LINSIGDRACULA 2. Data University of Leeds and Leeds City Council provided: The SATURN model and data files have been constructed according to WebTAG recommendations and validated against DMRB guidelines). 6. Scope and Data Analysis Win Thi Ha , MSc (Eng) Transport Planning & Engineering Supervisor : Dr Chandra Balijepalli 1. Background and Motivations • Private and Public Transport Road Users suffer from delays, congestion and unreliable journey times due to regular road closure to maintain and improve old infrastructures and road system in the UK to meet the increasing travel demand. • More frequently digging up the roads by utility companies (Gas, Water) • Government recently announced 55 major road schemes and local transport projects with a further 15 billions spending between 2015-16 and 2020-21. • Part of proposed 14.8km NGT (Trolley Bus) route - Otley Road (A660) section from the Ring Road (A6120) Roundabout to the junction of North Lane/Wood Lane in Leeds, West Yorkshire. A “quasi” dynamic element will be introduced into runs of SATURN by modelling three successive AM time periods to include the effect of the departure time choice. Literature Review • Evaluation of Traffic diversion plans • Traffic modelling softwares • Monetary cost of congestion and delay due to road works Implement different scenarios • Link and Convert output route flows to facilitate interface with DRACULA from SATURN Assignment O-D route flows using SATPIG and SPATULA programs. • Adjust Road Capacity on planned road work routes according to diversion plan • Develop LINSIG model to optimise and coordinate signals within study cordon area. Simulation results and data analysis • Comparative analysis of Modelling Scenarios Results on the effects of the road work on private vehicles and public transport buses primarily at Micro level. • Analysis of Measure of Effectiveness on worst congested junctions/ links/ nodes at Macro level across Leeds Network in general. Evaluating traffic diversion plan due to road works and assessing the impact on private vehicles and public transport buses Institute for Transport Studies Image © Copyright Descry and licensed for reuse under a Creative Commons Attribution-ShareAlike 2.0 Generic (CC BY-SA 2.0) In Leeds Area alone during 2012-2013: • 6,279 road works with average of 4.98 days • 31,269 days of disruption Source: Mitchell, 2014 (Leeds City Council Report) • 830 Zones, 3034 Nodes.2009 Leeds Network • 467,630 Total Flow, Three AM time periods (7-8 , 8-9 and 9-10 AM). 2009 Leeds Trip Matrix • Route , Traffic volume count, Speed, Distance.2009 Validation Count References: Goodwin, P. 2005. Utilities’ street works and the cost of traffic congestion. Research Report February,p.37. Centre for Transport & Society, University of the West of England, Bristol. Mitchell, P. 2014. Leeds Permit Scheme for Road Works and Street Works. Annual Report 2012-13. Zhou, H. 2008. Evaluation of Route Diversion Strategies Using Computer Simulation. Journal of Transportation Systems Engineering and Information Technology. 8(1),pp.61–67. Cordon Network Number of Zones 34 Number of Nodes 88 Simulation Links 192 Number of Signal Stages 30 Number of Roundabouts 3 Priority Junctions 52 Traffic Signals 9 Total Traffic Flow (Actual) 3357 4. Objectives • To Minimise the impact and effect on private vehicles and public transport buses due to road work. • To Optimise signals of roundabouts and junctions within study cordon area. • To Understand positive/negative impacts of optimised signals by analysing computer traffic simulation softwares outputs • To Evaluate the traffic diversion plan and the effect on private and public transport buses at Micro, Meso/Macro Levels. 5. Methodology • Methodology itself is generic and widely used in local, regional & national Traffic Management Centers. • Implementing 3 different scenarios based on 2009 Leeds Network, Signal Plan and Trip Matrix data. 3. Study Cordon Area . Figure 1: Cordoned off Leeds Network (Maps created using ArcGIS® software by Esri) Email: ts13wth@leeds.ac.uk In the UK: • 7 millions days of disruption • Valued at £1bn – £4.3bn (Reports & Studies widely quoted) • 5-10% of total congestion Source: Goodwin, 2005 Special events /other 5% Bottlenecks 40% Road works 10% Traffic Incidents 25% Poor traffic signal timing 5% Bad weather 15% Source: www.ops.fhwa.dot.gov
  • 11. What Safety Policies Should Accompany the Goal of Achieving More Sustainable Urban Mobility: An Examination of Problems and Policies in Europe Taner Ulug, (MSc) Transport Planning and Engineering Supervisor: Prof Oliver Carsten UNIVERSITY OF LEEDS Background •European Union plans to achieve an overall sustainable transport system in order to decrease pollution and congestion. •Sustainable urban mobility is a vital part of this plan. •About 40% of all road accident fatalities in the EU occur in urban roads. •11,000 deaths in 2012 on EU urban roads. •65% of all urban road fatalities in the EU are Vulnerable Road User (VRU) fatalities. •A large proportion of serious road injuries occur in urban areas and and involve VRUs. •VRUs: Pedestrians + Pedal Cyclists + Motorcyclists&Moped Users •VRU safety needs to be improved in order to achieve sustainable urban mobility. United Kingdom‐Urban Source: CARE Database Objectives •To determine best performing three EU member countries in terms of VRU safety on urban roads since year 2000. •To determine for which three main VRU modes these countries have performed beter. •To discuss the VRU safety policies which have possibly contributed to the good performance of these countries. Data Collection •Secondary data will be acquired for years since 2000. •Community Road Accident Database(CARE) will be  utilized for this purpose. Methodology 1. Analysis of annual changes in fatalities as reported by transport mode in EU countries on urban roads, rural roads, and motorways. Analysis of annual changes in VRU fatalities by age groups and gender. 2. Determination of best performing three member countries in terms of VRU safety with a focus on urban roads. 3. Determination of how these countries has performed when other parametres such as age groups, gender and VRU transport modes are considered in order to understand the exact issues these countries have tackled well. 4. Investigation of VRU safety policies implemented by these countries particularly before the years when there have been significant achievements regarding the issues mentioned above. Expected Outcome The best performing three EU countries are expected to be the SUN(Sweden‐United Kingdom‐Netherlands)  countries, but Denmark may replace the Netherlands. Successful policies are possibly developed under the following VRU safety issues; •Investing in safer urban infrastructure •Use of modern technology for enhanced urban road safety •Traffic rule enforcement and road safety education Photograph Sources: Road Safety in the European Union, Vademecum_2015
  • 12. As a consequence of the arid conditions, PM dispersion from the region is hindered and secondary process such as wind driven resuspension dominate. This means that while gas-phase species associate with their primary sources (e,g. traffic levels), PM does not. In 2010 air pollution was estimated to have caused over 400,000 premature deaths in Europe. Ambient air pollution was estimated to cause 3.7 million premature deaths worldwide in 2012. 2. MECCA Mecca is a major centre for tourist and religious pilgrimage in Saudi Arabia. As in many cities, local air pollution is affected by multiple inputs, including emissions from traffic, construction work, industrial practices, etc. However, arid conditions make it especially sensitive to particulate matter (PM) pollution. 3. PROJECT DATA In this project Air Quality data (including CO, NO/NO2, and PM10) and PM compositional data (anions, cations, and metals) collected by Professor Turki Habeebullah and colleagues at Umm Al-Qura University, Makkah, will be analysed with the intention of extending understanding of local air quality in the region. 4. OBJECTIVES/METHODS The study will proceed as follows: i) Use R and R package openair to characterise local air quality data, and ii) Use specialist software, including US EPA UNIMIX , to conduct the first source apportionment of the dataset. Trophius Kufanga. Msc Transport Planning & the Environment. ts13tk@leeds.ac.uk References: 5. RESULTS 6. NEXT STEP: SOURCE APPORTIONMENT 0 1 2 w s 3 4 5 6 W S N E mean PM10 500 1000 1500 2000 2500 3000 3500 0 1 2 w s 3 4 5 6 W S N E mean NO2 10 20 30 40 50 60 Improved Air Quality Management for Makkah Al-Mukarramah (Mecca), Source Apportionment of Air Quality and Particulate Composition Data Supervisor: Dr. Karl Ropkins 2nd reader: Dr. Haibo Chen Some Preliminary Findings: The Saudi Arabian PM10 standard 340 ug.m-3 daily average, not to be exceeded more than 24 times a year. In 2012, this was exceeded 32 times. However, unlike in UK, where PM10 standards are also regularly exceeded, this was not associated with NO2 exceedances, highlighting the different nature of the air quality problems in Makkah. 0 50 100 150 200 250 Source#1 Cl SO4 NO3 NO2 PO4 NH4 Br F PM 10 Source compositions for run # 2 - Linear Scale. 0 10 20 30 Source#2 Cl SO4 NO3 NO2 PO4 NH4 Br F PM 10 0 0.5 1 1.5 2 Source#1 Source Contributions for run # 2 09/15/2012 09/27/2012 10/09/2012 10/27/2012 11/09/2012 12/03/2012 12/22/2012 01/26/2013 02/07/2013 02/19/2013 03/09/2013 05/20/2013 08/06/2013 0 2 4 6 8 10 Source#2 09/15/2012 09/27/2012 10/09/2012 10/27/2012 11/09/2012 12/03/2012 12/22/2012 01/26/2013 02/07/2013 02/19/2013 03/09/2013 05/20/2013 08/06/2013 UNMIX source apportionment of PM composition trends, which are not affected by resuspension will help us to identify PM sources. By contrast, PM10 associates with higher wind speeds, in particular from the South East Many gas phase species, like NO2,associates with low wind speeds, an indication of local stagnant air related sources Hitchcock, G., et al. (2014) Air Quality and Road Transport. Impacts and solutions. RAC Foundation. London, United Kingdom. WHO (2014) Ambient (outdoor) air quality & health High Volume Systems (HVS PM Samplers) Ion Chromatography Anions and Cations 1. GENERAL BACKGROUND
  • 13. ・Categorize questioners →social economics (gender, age and employment state) →general impression of PTP (how does PTP make you feel) →interest for PTP/level of satisfaction of PTP (how are people satisfied with PTP) →modal changes (how do people change into use of public transport) →interest for sustainability (continuous of new travel behavior) ・Using regression analysis →how is effectiveness of PTP related with questioners? →For example, how much effectiveness of PTP is linked with age or gender? Is there any difference in the effectiveness between women and men? ・To know who changes travel behavior ・To know how they change travel behavior ・To know why they change travel behavior ・To know how the impact of PTP can be measured ・ Follow up survey to determine the influence of PTP on travel behavior ・10 different cities in the UK from 2009 to 2014 ・4786 data of PTP in those areas ・7-15% decrease in car trips can be expected ・12% reduction in the mean distance travelled by car ・increases in walking, cycling and public transport trips of between 14% and 33% ・effectiveness of PTP would last about 3 years Because of increase in cars… →environmental problems (increase in CO2) →health problems (effect on respiratory) →traffic problems (congestion) Introduction of PTP What is PTP ? ・PTP is one of the methods of soft measures ・Through one to one conversation with trained field officers ・Officers encourage and motivate people to change their travel behavior by giving provision of information on how to travel sustainably ・Useful information and good are given such as time table for each person or free trial public bus tickets Who changes travel behavior and why ? Tomoko Amahori : MSc Transport Planning and the Environment Supervisor: Jeremy Shires Backgrounds Effectiveness of PTP Data of PTP Objectives Methodology
  • 14. Can Development on the Green Belt be Sustainable? BACKGROUND Green belt is open space used for forestry and agriculture. In spite, its importance for environment, some local authorities change the land use for construction of residential, industrial and other projects. One of the most common reason for changing land use is to facilitate the economic growth of the region and meet increasing demand for affordable houses among people at the expense of the Green belt. This study will attempt to measure Sustainability of the Development on the Green belt and assess Transport impact. The housing development of 4020 dwellings on the North of Clifton Moor and A1237 will be considered for assessment. It will be located on 330 of acres of Greenbelt land. AIM To investigate whether development on the Green belt can be Sustainable. OBJECTIVES • To assess Sustainability of the Development on the Green belt • To assess the Transport Impact Assessment on New Housing proposal on the North of York on the Green belt. METHODOLOGY • Review of the polices, guidelines and planning  documents related to Transport Assessment and  Sustainability Assessment. • Define criteria and alternatives in MCA . • Define appropriate technique of MCA  • Multi criteria analysis of Sustainability. • Analysis of findings from MCA. • Analysis of existing SATURN road network of York  City. • Estimation of new trip projected values for trip rates  with the use of TRICS, TRIPS and TEMPRo software.    • Updating SATURN OD matrix and network files. • Assessment of public transport accessibility. • Traffic Impact Assessment of the Proposed  Development with SATURN software. • Development of recommendations for mitigation  from impacts.  EXPECTED RESULTS • Identification of impact from Transport. • Sustainability appraisal of the development on the Green belt. Supervisor: Dr. Chandra Balijepali                  Student: Talgat Abdrakhmanov      Email: ts14ta@leeds.ac.uk Preparation of  Transport  Assessment Final  Transport  Assessment Reducing the  need to travel Maximizing  Sustainable  accessibility Dealing with  Residual trips Mitigation  measures References: 1. Multi‐criteria analysis: a manual. DCLG, 2009. 2. Guidance on Transport Assessment. TfL, 2007. Policy context Existing Site function Proposed Development definition Identification of Impacts and mitigation measures NATA Assessment Capacity Assessment Identify problems Preliminary design of mitigation measures Scoping study Initial appraisal consultation form Scoping study Agreement of methodology Background data Existing travel patterns by mode Accident history Environmental base case Passenger transport services Committed development Committed transport network  charges Parking availability Refinement step 2 Where appropriate Additional support Alterations to ITB measures Refinement 1 (where appropriate) Seek to reduce residual trips Review: Development mix Scale of development  phasing Measures to influence Travel behavior Parking availability and Management Improvements to non‐car model Travel plan initiatives Capacity Management Network alterations Assessment Trip generation by mode Accessibility Assessment Assignment of trips Source: Transport Assessment Guidance. TfL, 2007.
  • 15. 5. Expected Outcomes4. Preliminary Results  Global travel demand contributes to the increase of fuel consumption in airlines.  U.S. airlines are the main contributors (18 billion gallons).  No alternate energy, so policy-making to manage the fuel demand is important. Decomposition Analysis of Aviation Fuel Demand of U.S. Airlines Shan-Che Wu | Institute for Transport Studies | Transport Planning and Engineering | Supervisor Zia Wadud 1. Background Year Passenger (million) Freight (million tons) 1991 461.2 9.0 2013 748.5 12.3 Growth 62% 37% (Airlines in the U.S.) 2. Objectives  To find some components linking the travel with fuel consumption  To decompose the fuel demand into various components with decomposition model  To initiate analyzing the freight-related factors  To set a freight forecast demand model Multiplicative decomposition - 5 10 15 20 25 1991 1994 1997 2000 2003 2006 2009 2012 Fuel(billiongallons) Fuel consumption of airlines in the U.S. Total Passenger in Passenger aircraft Belly freight Freight in freight aircraft 3. Index Decomposition Analysis  Fuel = Population(POP) × REV.ton.miles per capita ÷ Load factor × Efficiency 𝐹𝑢𝑒𝑙 = 𝑃𝑂𝑃 × 𝑅𝑇𝑀𝑃 𝑃 𝑃𝑂𝑃 × 𝐴𝑇𝑀𝑃 𝑃 𝑅𝑇𝑀𝑃 𝑃 × 𝐹𝑢𝑒𝑙(𝑃𝑃) 𝐴𝑇𝑀𝑃 𝑃 --- passenger in passenger aircraft +𝑃𝑂𝑃 × 𝑅𝑇𝑀𝐹 𝑃 𝑃𝑂𝑃 × 𝐴𝑇𝑀𝐹 𝑃 𝑅𝑇𝑀𝐹 𝑃 × 𝐹𝑢𝑒𝑙 𝐹𝑃 𝐴𝑇𝑀𝐹 𝑃 --- freight in passenger aircraft +𝑃𝑂𝑃 × 𝑅𝑇𝑀𝐹(𝐹) 𝑃𝑂𝑃 × 𝐴𝑇𝑀𝐹(𝐹) 𝑅𝑇𝑀𝐹(𝐹) × 𝐹𝑢𝑒𝑙(𝐹𝐹) 𝐴𝑇𝑀𝐹(𝐹) --- freight in freight aircraft  Logarithmic Mean Divisia Index (LMDI) is of better performance Additive decomposition and∆𝐹𝑢𝑒𝑙 = 𝐹𝑢𝑒𝑙𝑡 − 𝐹𝑢𝑒𝑙0 𝐹𝑢𝑒𝑙 𝑡 𝐹𝑢𝑒𝑙0 = 𝑃𝑂𝑃𝑡 𝑃𝑂𝑃0 × 𝑅𝐸𝑉. 𝑡𝑜𝑛. 𝑚𝑖𝑙𝑒𝑠 𝑝𝑒𝑟 𝑐𝑎𝑝𝑖𝑡𝑎 𝑡 𝑅𝐸𝑉. 𝑡𝑜𝑛. 𝑚𝑖𝑙𝑒𝑠 𝑝𝑒𝑟 𝑐𝑎𝑝𝑖𝑡𝑎0 ÷ 𝐿𝑜𝑎𝑑 𝑓𝑎𝑐𝑡𝑜𝑟𝑡 𝐿𝑜𝑎𝑑 𝑓𝑎𝑐𝑡𝑜𝑟0 × 𝐸𝑓𝑓𝑖𝑐𝑖𝑒𝑛𝑐𝑦𝑡 𝐸𝑓𝑓𝑖𝑐𝑖𝑒𝑛𝑐𝑦0 ∆𝐹𝑢𝑒𝑙 = ∆𝐹𝑢𝑒𝑙 𝑃𝑂𝑃 + ∆𝐹𝑢𝑒𝑙 𝑅𝐸𝑉.𝑡𝑜𝑛.𝑚𝑖𝑙 𝑝𝑒𝑟 𝑐𝑎𝑝𝑖𝑡𝑎 + ∆𝐹𝑢𝑒𝑙1/𝐿𝑜𝑎𝑑 𝑓𝑎𝑐𝑡𝑜𝑟 + ∆𝐹𝑢𝑒𝑙 𝐸𝑓𝑓𝑖𝑐𝑖𝑒𝑛𝑐𝑦 ∆𝐹𝑢𝑒𝑙 𝑝𝑜𝑝 = 𝐹𝑢𝑒𝑙𝑡 − 𝐹𝑢𝑒𝑙0 𝑙𝑛𝐹𝑢𝑒𝑙 𝑡 − 𝑙𝑛𝐹𝑢𝑒𝑙0 × (𝑙𝑛𝑃𝑜𝑝𝑡 − 𝑙𝑛𝑃𝑜𝑝0)  Revenue ton miles per capita is the most key factor.  Efficiency has been gradually improved to save fuel because of management and technology  Hope to link the aircraft freight demand with economic factors  Fare, journey time, and income might be the most influential parameters in demand model. Decomposition analysis summary 1. Revenue ton mile per capita always increasing except 2000-2002 (911 terrorist attack) and 2006-2008 (economic recession). 2. Load factor and fuel efficiency slow the growth rate of fuel use. 3. Most of the changes in fuel consumption due to changes in revenue ton mile per capita. -6 -3 0 3 6 Changeinfuelconsumption(billion gallons) POP RTM/POP 1/Load factor Fuel/ATM Additive and Multiplicative decomposition in 3-year band: 1991-2011 0.8 1 1.2 POP RTM/POP 1/Load factor Fuel/ATM 1991-1993 1994-1996 1997-1999 2000-2002 2003-2005 2006-2008 2009-2011 Data sources: Bureau of Transportation Statistics, Department of Transportation in U.S. Evolution of fuel consumption and its components: 1991-2013; 1991=1.0 0.0 0.5 1.0 1.5 2.0 2.5 3.0 1991 1994 1997 2000 2003 2006 2009 2012 Index(1991=1.0baseyear) POP RTMP(P)/POP RTMF(P)/POP RTMF(F)/POP RTMP(P)/ATMP(P) RTMF(P)/ATMF(P) RTMF(F)/ATMF(F) Fuel(PP)/ASM(P) Fuel(FP)/ATMF(P) Fuel(FF)/ATMF(F) Fuel (PP) Fuel (FP) Fuel (FF)
  • 16. Causative Factors of Accidents on Curve Negotiations: A Case Study of Malaysia Institute for Transport Studies Seri Ashikin Binti Sofian, MSc.Eng Transport Planning & Engineering Supervisor: Dr. Samantha Jamson Co-Supervisor: Dr. Frank Lai • Traffic accidents rank fifth among the leading cause of deaths in Malaysia. • It is estimated that, one quarter of all accidents happen in Malaysia occur while driving around curves and in most cases contribute to fatal accidents. Therefore, it is vital to understand the factors lead to an accident that occurs on a curve. • IRTAD report 2014, based on willingness-to-pay estimation, road accident accounted for approximately 1.6% of Malaysia national GDP. • The accident rates in road curves are about 1.5 to 4 times higher than in straight roads (Zegeer, Stewart, F. M. Council, Reinfurt, & Hamilton, 1992). • The accident severity of curve related crashes is higher than those occurring in straight roads (Glennon, Neuman, & Leisch, 1985). • Accidents are not uniformly distributed on the road network, high accident locations are a clear indication that, besides human factor, there exist other influencing parameters that are characterized by the road (Lamm et.al, 2007). • The curve's location chooses for this study are identified from the 186 blackspot locations treated under the ‘Rehabilitation Works Programme’ done by the Public Works Department of Malaysia (PWDs) from year 2009 to 2014. • Seven (7) locations of curve are identified from the blackspot locations and data collected from this location are gathered through the POL form obtain from the Royal Malaysian Police (Traffic Department). Background of Study Determine the factors that contribute to the accident occurrence in a curve Identify the characteristics to the cause of the accidents occurrence on a curve Recommendation for road accident on curve treatment Objectives Research Questions ? “What are the factors that have influenced for accidents to happen on a curve” “Is there a relationship between demographic and road factors which contribute to an accident on curve” Theoretical Framework Demographic • Age • Gender Road • Length of curve • Radius of curve Numbers of fatal accident Methodology Null Hypothesis • Road factors contribute to an event of an accident on a curve • Demographic factors influence the driving behaviour and the occurrence of the accidents on the curve • Both, demographic and road is contributory factors in an accident on a curve Alternative Hypothesis • Road factors does not bring impact to the occurrence of an accident on a curve • Demographic factors do not influence the driving behaviour • Both factors fail to demonstrate relationship their behaviour towards an event of an accident on the curve Statistical Analysis All accidents data obtained from the Public Works Department of Malaysia (PWD Malaysia) and POL Form from Royal Malaysian Police will be put through a data cleansing to check its validity and reliability. This is also done in order to find the demographic information such as age and gender of the driver of the vehicle. This analysis will use the SPSS package in order to look into the relationship between the variables by using the regression models. The variables of road factors will be studied from seven (7) curve’s location from the blackspot lists, whereas for the demographic factors, 2 locations from this will be analysed. Data Cleansing • To check on the reliability and validity of the data Information Analysis • Seek demographic information from the POL form. • Geometry of the location (length and radius) Factor analysis • Correlation between factors • Linear Regression (Binary Logistic) Results • Significant level of the hypothesis testing Expected Outcome • It is expected that the demographic and road factors, will be the factor in an accident on curve negotiation. Other than that, a significant relationship can be seen from both factor and relate to the accident occurrence on a curve. • The findings from this study is yet to be used in the future in order to rectify the accident problem that mostly occurs on a curve. On the other hand, this study can suggest for the treatment and countermeasure to be taken in the road safety enhancement with a focus on a curve negotiation. Kuala Lumpur – Karak Highway
  • 17. D e v e l o p i n g A c c e l e r a t i o n M o d e l s C o m b i n i n g M u l t i p l e D a t a Stavros Papadimitriou (Author); Charisma F. Choudhury (Supervisor); Daryl Hibberd (2nd Reader) B A C K G R O U N D I-80 Study Area Schematic and Camera Coverage Ø Driver behavior data from an artificial scenario in a controlled environment may not resemble driver behavior that is displayed in a comparable real world situation (Carsten et al., 2011) Ø Calibration and validation in driving simulators generally performed at a macroscopic level (Sakia & Hoogendoorn, 2008) and studies mainly generate macroscopic outputs, (Olstam, 2005) ignoring driver specific information. 1 M E T H O D O L O G Y d a t a Driving Simulator Schematic of Road Section ü X and Y coordinates every 1/10th sec for acceleration decisions of drivers; ü over a stretch of 1/2 km for an hour (between 16:15­ 17:15); ü similar traffic density (roughly 1600-2400 vph); ü 40 subject drivers are recorded; m o d e l l i n g a p p r o a c h E X P E C T E D R E S U L T S c a s e s t u d y 3.2 3 4 NGSIM Driving Simulator C r o s s – C l a s s i f i c a t i o n A n a l y s i s S t a t i s t i c a l A n a l y s i s Maximum Likelihood Method (MLM) Models format Responsen (t)= Sensitivityn (t-Tn) x Stimulusn (t- Tn) Where, -  t = time of observation, -  Tn = reaction time for driver n, -  Responsen (t) = acceleration applied at time t STATA Estimation method Statistical software Models performance & comparison Tests of statistical significance (e.g. t-statistics) 3.1 Ø Real-life trajectory data are really important so far for calibration and validation of microscopic models. However, most studies focus on the investigation of lane changing (Thiemann et al., 2008; Ahmed, 1999) 2 Simulation Environment Physically Driving Two data sources will be used in this research: (1)  The real-life traffic detailed trajectory data collected from Interstate 80, CA, US (NGSIM 2005); (2)  The experimental data collected from the University of Leeds Driving Simulator (UoLDS). Microscopic data collected from, (i)  Real trajectory data from physically driving; (ii)  Driving simulator data from a simulated environment using a driving simulator. •  Leader speed •  Time headway •  Type of vehicle •  Reaction time etc. •  Leader speed •  Gender, Age •  Type of vehicle •  Reaction time etc. §  Statistical comparison of the models will indicate significant differences in common model parameters (e.g. leader speed, headway, subject vehicle type); §  The combined model will better replicate the traffic compared to models developed using single data sources. The objective of this dissertation is to develop and compare the performance of the acceleration models using two sources microscopic data, as well as testing a combined model using both data sources. Models will take into account network topography and traffic conditions. •  Model 1 uses only traffic video data; •  Model 2 uses only driving simulator data; •  Model 3 uses both. 1000m1000m 2000m 503m(1650feet) Study Area 7 video cameras O B J E C T I V E S
  • 18. EMERGENCY TRANSPORT PLANNING FOR MATERNAL HEALTH IN RURAL GHANA MAHAMA SEINU SEIDU, MSc TRANSPORT PLANNING AND THE ENVIRONMENT          SUPERVISOR: JEFFREY TURNER    2ND READER: FRANCES HODGSON  BACKGROUND REFERRAL SYSTEM  AIM AND OBJECTIVES METHODOLOGY EXPECTED OUTCOME REFERENCES Thaddeus and Maine,1994 The aim of the study is to assess the impact/effect of Ambulance services in maternal health OBJECTIVES: The study is to focus on understanding and assessing the role of ambulance services in emergency maternal health in Ghana. This is intended to be achieved through :  Assessment of the role and impact of Ambulance services in maternal health delivery in rural areas .  Whether or not Ambulance services have any significant contribution to reduction of maternal mortality.  How efficient and effective transport can improve emergency maternal health intervention in rural Ghana Millennium Development Goal (MDG 5),maternal mortality is identifies by the United Nations(UN) as a serious concern for the welfare of women across the world particularly a pandemic in developing countries and specifically an “unfortunate tragedy in sub sahara Africa as the region records the highest maternal mortality ratio” (Ganyaglo & Hill, 2012)  About 350,000 women die annually from pregnancy related causes and child birth complications .  Utilization and access to health facilities for maternal services in these settings is hindered by several factors including lack of transport and high cost –(4) .Referral intervention aim to address these problems and one such intervention is the provision of emergency ambulance referral transport services.  In most developing countries such National ambulance services have not been sustained effectively, providing very limited, or no service. As a result, many segments of the population, particularly in rural or peri‐urban areas are not covered and this poses serious challenges to reach the appropriate health facility in case of an emergency.  In Ghana ,the maternal mortality ratio (MMR) is currently 350 in every 100,000 live births .It is estimated that 75 percent of the women who die in the course of childbirth do so as a result of inadequate emergency transport‐(1).  Transport is critical in the provision of health delivery and access to services, and in the Overall effectiveness of the referral process.  As have been identified by Thaddeus and Maine(1994), poor access and lack of reliable transport also explain why families delay in seeking care in an emergency situation or arrive too late at health facilities for effective treatment as well as poor service utilization.  Emergency transport interventions could save an estimated 75 percent of pregnant women each year, which could further save nearly 14,500 births if functional referral systems are put in place. The study will  be  conducted in the  Millennium Village  project  communities  in the Ashanti Region of Ghana. A literature review  will be done. Data on ambulance utilisation for maternal  emergency referral in the health facilities in this communities  will be accessed. Other case  received without intervention of  the ambulance services within  the same period will also be  collected .The response times and cost will be determined as  well as the outcomes of the different scenarios. Analysis will  then be done to assess the impacts.        Lack of ambulances and absence of other means of transport in remote areas (Shehu et al. 1997) and high transport costs represent a major constraint for women and their families who need to access health facilities for both preventive and emergency care. A key solution therefore is to improve transport access in a way that is both affordable and sustainable for these two levels of care.  It should be possible to reduce maternal deaths in rural Ghana by effective and efficient emergency (ambulance) referral transport planning . 1. Babinard,J. and Roberts,P.,2006  Maternal and Child Mortality Development Goals:  What Can the Transport Sector Do? The World Bank Group Washington, D.C.   http://www.worldbank.org/transport/ 2. Thaddeus S, Maine D (1994) Too far to walk: maternal mortality in context. Soc Sc Med 38(8): 1091–1110. 3. Lungu K, Kamfose V, Hussein J, Ashwood‐Smith H (2001) Are bicycle ambulances and  community transport plans effective in strengthening obstetric referral systems in  Southern Malawi. Malawi Med J 13: 16–18. 4. Maxwell Ayindenaba Dalaba,et al.,2015 Cost to households in treating maternal  complications in northern Ghana: a cross sectional study. BMC Health Services  Research 2015, 15:34  doi:10.1186/s12913‐014‐0659‐1 5. Murray SF, Pearson SC (2006) Maternity referral systems in developing countries:  current knowledge and future research needs. Soc Sc Med 62: 2205–2215. 6. WHO | Maternal mortality [http://www.who.int/mediacentre/factsheets/fs348/en/] Without intervention With intervention UNIVERSITY OF LEEDS
  • 19. ` Utilizing Real Time Bus Information Technology To Encourage Bus Travel Student: Steven Lightfoot (email: ts12sdl@leeds.ac.uk), Supervisors: Jeremy Toner and Mark Wardman Background • Metro Tracker survey 2014, Vector research • Mishalani, Rabi G., Sungjoon Lee, and Mark R. McCord. 2000. "Evaluating real-time bus arrival information systems." Transportation Research Record: Journal of the Transportation Research Board 1731.1: 81-87. • Moss S 2015. The Guardian website. Available from: http://www.theguardian.com/cities/2015/apr/28/end-of- the-car-age-how-cities-outgrew-the-automobile • Tang, Lei, and Piyushimita Vonu Thakuriah. 2012 "Ridership effects of real-time bus information system: A case study in the City of Chicago." Transportation Research Part C: Emerging Technologies 22: 146-161. • Transportation Research Part A: Policy and Practice, Volume 45, Issue 8. 2011, Pages 839–848 • Transportation Research Part C: Emerging Technologies. Volume 53. 2015, Pages 59–75 • TLP Projects – Monitoring Report 2009 to 2013, Metro 2013 • Traveline. 2015. (online). Available from: http://dashboard.mxdata.co.uk/traveline/Account/login.aspx Objectives • New technologies enabling the provision of real time bus information and the growth in smartphone use have the potential to transform the way people view bus travel options. • Utilize real time information to improve the way bus information is presented to the public. • Set out best way of displaying real time information to public on stop displays, computers and mobile phones. • Maximize public access to, awareness and usage of real time information. • Set out best practice and future developments that will show how real time information can be utilized by bus operators and traffic control centers to improve reliability and speed whilst reducing operating costs. Data and Scope • Real time systems and literature from across the world will be reviewed. • Data sources include: transport press, West Yorkshire bus user survey, public usage of real time outputs in Yorkshire, real time user groups etc. • Focus for recommendations will be Yorkshire, however they will be able to be adapted for other areas. • Recommendations will aim to retain existing bus users and attract new users. • Recommendations will focus on existing bus regulation system in Yorkshire, but will consider different regulation models. • Risks include: • Difficulty accessing commercially sensitive formulas used to generate real time predictions. • Lack of regulation meaning there is no central body able to ensure recommendations are implemented. Methodology • Result 1 • Result 2 • Result 3 Initial Findings References • Provision of real time bus information can increase bus usage. • Can reduce both actual wait time and perceived wait time • ‘Digital information is the fuel of mobility’, • ‘Information about mobility is 50% of mobility’ • Large increase in real time mobile apps availability and usage facilitated by open data provision. • First and Google apps dominate Yorkshire market with 88% market share. • 290% increase in real time mobile app usage in last 6 months in West Yorkshire. • More modest increase in internet usage and a fall in text usage. • Awareness of real time mobile internet and apps still relatively low at 27% in West Yorkshire. OBJECTIVE 1 – PRESENTATION OBJECTIVE 2 – ACCESS AND USAGE OJECTIVE 3 – SPEED, RELIABILITY AND COST • Real time bus information utilizes satellites to track bus locations. This enables accurate arrival times bus to be shown to the travelling public, instead of just timetable information. • Real time bus systems have been introduced in major transport areas across the world. • Difficulty accessing and using bus information has historically been a significant barrier to encouraging sustainable travel behaviour. • Real time information can be shown on mobile phones. Mobile phone usage is increasing across the world. The proportion of people in West Yorkshire with a mobile phone has increased from 90.3% in 2012 to 93% in 2014. • Bus usage is falling in West Yorkshire. The proportion of people using a bus monthly has fallen from 57.1% in 2011 to 52.4% in 2014. • Technological advances have improved the practicality and reduced the cost of real time bus information systems. • Real time bus technologies present new opportunities for improving bus reliability through linked technology. • Including Traffic light bus priority and improved scheduling. • The output from real time can be used to improve bus services. • Operators in Yorkshire analyze past performance to improve scheduling. This can increase reliability and reduce operator costs. • Link to Yorkshire traffic control centers can give traffic light priority to buses. This can increase reliability and reduce journey time and operator costs. • Introduction of bus traffic light priority to 200 junctions in West Yorkshire was shown to have a Benefit:cost ratio of 8.
  • 20. Evaluation of the Influence on Driving Behaviour by Music Tempo Data Collection • Free driving task 1. Average, maximum, minimum driving speeds 2. Average, maximum lateral deviations • Overtaking task 1. Maximum speeds 2. Minimum headway distances before and after overtaking • Approaching signlised junction task 1. Decision making 2. Violation frequency 3. Passing speeds • Stopping task 1. Reaction time Objectives The study will be approached through driving simulator. Four questions are aiming to be answered in this research about lisening slow/fast tempo music during driving: 1. How much degree of influences on driving performance under free driving condition? 2. Does the music induce more dangerous driving in overtaking process? 3. Will the drivers be more aggressive towards a signalised junction? 4. Is there any deterioration in reaction time for an emergency stop? Background Dibben and Williamson (2007) conducts a survey and finds that 75% young drivers listen music during driving. However, the young drivers, who preferred no music driving environment, are less involved in road accidents. The study in Brodsky(2001) selects some fast tempo music to test the driving performance. Higher driving speed, and more frequent traffic violations are shown. Fast-paced music is proved to deteriorate the driving behaviour. In most of the previous studies ,drivers are tested by driving in a city through driving simulator, but not in some specific critical conditions. In current study, some specific scenarios will be set up in order to thoroughly investigate the driving influence on these conditions, for example, overtaking, dilemma in signalised junction, and emergency stop. Waterhouse et al., (2010) mentions that apart from tempo, lyrics, melody, loudness and other particular circumstance can also affect the musical taste. To reduce the variables, same set of music tracks, which differed in tempo, are used in this study. Tasks in a testExperimental Designs 20 driving licence owners, who age from 20-30 years old, will be invited to parcitipate the experiment, because they are the most frequent group of listening music, as well as the highest risk group of getting involved in accidents. Experimental flow is below: Briefing (15mins) • Introduce about the experiment, including all the tasks they will meet in the test. • Explain the manipulation of driving simulator. • Provide free driving section for familiarisation. Testing (55mins) • Without music, fast tempo and slow tempo scenario tests will be finished by participants respectively in random order. Surveying (10mins) • Complete a self-reflection questionnaire • Personal information: age, gender, driving experience, etc. • Personal perception in slow and fast tempo music for each individual task • Any mistake has taken in the test. Driving Simulator Overtaking Approaching signalised junction Stop immediately and restart Overtaking Start to play slow/fast tempo music Approaching signalised junction Stop immediately and finish Free Driving for 10 minutes at 60mph Free Driving for 10 minutes at 60 mph 2 mins 2 mins 2 mins2 mins Data Analysis and Expected Results Three sets of dependent variable data comparisons will be analysed: • Without music VS Slow tempo music • Without music VS Fast tempo music • Slow tempo music VS Fast tempo music The results from the fast tempo music are expected to show: • higher free driving speeds, • dangerous overtaking behaviour, with higher speeds and shorter headway distances • tending to pass the signalised junction with higher speed rather than decide to stop in dilemma situation, • and a longer reaction time. Li Shaotang, Alvis Email: ml13l6s@leeds.au.uk Msc (Eng) Transport Planning and Engineering Supervisor: Dr. Daryl Hibberd
  • 21. Motorcyclists’ Acceptance of Automated Road Transport Systems in Taiwan Shu-Cheng, Hsieh (ml13sch@leeds.ac.uk) MSc (Eng) Transport Planning & Engineering Supervisor: Dr Natasha Merat, Tyron Louw  Motorcycles in Taiwan  Large density and amount of registered motorcycles  Motorcycles : Other vehicles = 1.8 : 1  Public Transport in Taiwan  Projects promoting public transport by Taiwanese government since 2010  Involving buying new buses, improving service quality, providing real-time and subsiding rural routes 2. Background Year Car Bus & Coach LGV HGV Subtotal Motorcycle 2013 6,236,879 31,960 875,544 162,122 7,367,522 14,195,123 2014 6,405,778 32,928 890,703 163,446 7,554,319 13,735,994  Road user interactions  Conflicts between motorcycles and buses (Particularly at bus stops) Public Transport  Little changes on usage  Financial difficulties for operators  Lack of drivers 3. Research Problems  An example: City Mobil2  An EU project assessing ARTS  Deliver ARTS in several European cities  Investigate road users acceptance (focus on pedestrian)  Aims: 1) Evaluate what ARTS could provide to sustainable transport 2) Examine and improve interactions between ARTS and other road users How about in Taiwanese transport environment? 4. Research Motivation  Literature review, technology approach and integration  Questionnaire  Sample: Motorcyclists in Taiwan  Asking acceptance in two sections  Data Analysis and discussion 5. Methodology Section 1 • Applying Drive Behaviour Questionnaire • Initial acceptance by introducing ARTS Section 2 • Scenario with safety systems on ARTS • Scenario with road infrastructure for ARTS  Understand the factors that influence motorcyclist’s acceptance of ARTS  Motorcyclist–centred design recommendation fro ARTS in Taiwan 6. Expected Outcomes  Public transport systems based on the use of a fleet of communication-enabled cybercars – road vehicles with automated driving capabilities.  Advantages  Provide “Last-mile connections” for individuals  Low personnel costs (No drivers)  Sustainable urban transport  Existing Cases 1. What is Automated Road Transport Systems (ARTS)? ARTS in the West Region of Lausanne, Switzerland ARTS in La Rochelle, France Key References CityMobil (2015), http://www.citymobil-project.eu/. CityMobil2 (2015), http://www.citymobil2.eu/ Directorate General of Highways, Ministry of Transportation and Communications, Taiwan (R.O.C.) (2014), Annual Report for Motor Vehicle Administration. Rockall, Wil, 2014, Can driverless car see off cyber attacks? [Online] London, United Kingdom. http://goo.gl/oFQZNg Reason, Manstead, Stradling, Baxter & Campbell (1990), Errors and violations on the roads: a real distinction? http://goo.gl/ZMzgVX  Understand motorcyclists’ initial acceptance of ARTS in Taiwan  Find out what will increase motorcyclists’ acceptance and confidence of ARTS when assessing them, in:  Safety systems on ARTS  Road infrastructure 5. Objectives Can ARTS be a solution?
  • 22. ROLE OF PRIVATE FINANCE IN AIRPORT DEVELOPMENT NAME: SAMUEL APPIAH ADJEI EMAIL: ts14saa@leeds.ac.uk INDEX: 200872578 SUPERVISOR: PROF. NIGEL SMITH BACKGROUND AIM METHODOLOGY 1. The fundamental change in the airport industry occurred after the 1986 Airports Act which was to introduce the privatization and commercialization into the aviation sector 2. There exist different ownership models after the introduction of Airport Act 3. Most airports in the UK has experienced different ownership types over the years 4. Some of the ownership types include purely public airport, public private partnership and purely private ownership 5. Research would undertake time series analysis of effects of ownership change on airports passenger trends Subhead • Volor ilit nonsendiate magna ad erciliquip eugiam velent alisl dolor auguerat. Ut dolore consendrerit verilla cons nosto cons nim quis elisci ex ea commy nis doloreet ex estie vent ad molesto diat. • Volor ilit nonsendiate magna ad erciliquip eugiam velent alisl dolor auguerat. Ut dolore consendrerit verilla cons nosto cons nim quis elisci ex ea commy nis doloreet ex estie vent ad molesto diat. •Volor ilit nonsendiate magna ad erciliquip eugiam velent alisl dolor auguerat. Ut dolore consendrerit verilla cons nosto cons nim quis elisci ex ea commy nis doloreet ex. This research primarily examines the impact of airport ownership type on airport efficiency 1. Analyse airport passenger trends between 2000 and 2014 2. Analyse airport freight trends between 2000 and 2014 3.Identify impact of airport ownership type on passenger trends 4. Identify measures to improving airport passenger and freight growth Leeds Bradford Airport FURTHER WORK 1. Study effects of various airport services on passenger numbers 2. Evaluate private finance on airport development 1. The fundamental change in the airport industry occurred after the 1986 Airports Act which was to introduce the privatization and commercialization into the aviation sector 2. There exist different ownership models after the introduction of Airport Act 3. Most airports in the UK has experienced different ownership types over the years 4. Some of the ownership types include purely public airport, public private partnership and purely private ownership 5. Research would undertake time series analysis of effects of ownership change on airports passenger trends UK AIRPORT UK OWNERSHIP PRIVATIZED AIRPORTS PUBLIC PRIVATE PARTNERSHIP PUBLIC AIRPORTS OBJECTIVES CASE STUDY TIME SERIES ANALYSIS PASSENGER TRENDS FREIGHT TRENDS DATA COLLECTION AIRPORT ANNUAL REPORT CIVIL AVIATION AUTHORITY CASE STUDY APPROACH LEEDS BRADFORD AIRPORT Public Airport 2000-2007 Privatized 2007 to Date REFERENCES Butcher L. (2014), Aviation: Regional Airports House of Commons, House of Commons Library Oxford Economics (2011) Economic benefits of air transport in the UK Yin, R. K. (2014) Case Study Research. 5th Edition. California. Sage Publications Inc.
  • 23. Traffic flows thresholds for Shared Space in Leeds Transport Planning and Engineering. Student: Russell Oakes Supervisor: Dr James Tate Introduction Shared Space is a concept where streets are re-engineered to reduce the dominance of motor vehicles (DfT, 2014) Street signage is limited and kerb heights are reduced or removed completely in some cases. The focus for this project will be in Headingley, North West Leeds. Pedestrian desire lines vary due to the mixture of retail and leisure activities this district has to offer; therefore providing an ideal location to test the theory. Literature The dissertation will be educated by various sources of literature, including... Manual for Streets (1 & 2), Liverpool City Centre Plan (1961), Living Streets Policy, Local Authority Policy (for example Leeds City Council Supplementary Planning Documents), University of the West of England Research, Written interview with the late Hans Monderman and scheme studies. Objectives To ascertain the potential for bringing Shared Space to Headingley by: Understanding previous comparable Shared Space Schemes Compiling a resource containing pedestrian and vehicular data Applying the data to a Micro-simulation Package (Aimsun & Legion) with sensitivity tests Analysing the Aimsun & Legion outputs Determining applicability to Headingley and wider Leeds These objectives will act as milestones throughout the dissertation with the expectation that each objective will be a development on its predecessor. Methodology The project will require site visits to various contrasting examples, compilation of pedestrian data from Leeds City Council and a suitable model simulation running to satisfy the scope of the project. Anticipated issues include the inability to compile pedestrian data for the Headingley area, therefore flexibility with pilot site locations may be required. Two preliminary pilot sites of contrasting traffic density will be used in order to determine the relative scales of operation for a Shared Space scheme. Currently, these sites are North Lane/ Otley Road and St Michaels Road outside the Church. Coventry Top: Before. Source: Oakes, R (2010) Bottom: After. Source: Oakes, R (2015) Preston De-cluttering of street furniture including the removal of traffic lights Narrowing of Fishergate providing wider pavements Provision of informal pedestrian crossings Top: Before. Source: Oakes, R (2013) Bottom: After. Source: Oakes, R (2015) UrbanCaseStudies Top: Before. Source: Oakes, R (2010) Bottom: After. Source: Oakes, R (2015) Downgraded routes complimented by extensive landscaping Closure of through routes and implementation of UKs largest 20mph zone (Coventry City Council, 2010) Mixture of zebra and informal crossings Coventry Top: St Michaels Road. Source: Oakes, R (2015) Bottom: Otley Road/North Lane. Source: Oakes, R (2015) Sources used in the dissertation will include: Early Indications and Potential Outcomes No Shared Space scheme is identical, as demonstrated with the case studies. Therefore, the site visits will assist in the appreciation of the issues apparent in Headingley. An understanding of which environments would best suit a Shared Space scheme with the potential to apply the key findings of this project to policy making within Leeds City Council. Communities are aware of the Shared Space concept and have approached Leeds City Council requesting that this is investigated. If the timescales fit, efforts will be made to draw comparisons where relevant to other Shared Space schemes. This may lead to good practice workings with other Local Authorities subject to interest. Sources of Information The dissertation will call upon quantitative and qualitative sources in order to provide a robust analysis. This could include: Quantitative Leeds City Council Transport Monitoring Database Primary data collection (where required) Scheme monitoring reports (where available) Qualitative City and County Borough of Liverpool 1965, Liverpool City Centre Plan, Liverpool, City and County Borough of Liverpool Moody, S. and Melia, S. (2014) Shared space: Research, policy and problems. Proceedings of the Institution of Civil Engineers - Transport, [Online] Available at: http://www.icevirtuallibrary.com/content/article/10.1680/ tran.12.00047 (Accessed 23rd April 2015)
  • 24.
  • 25. Meta-analysis of electric vehicles’ range prediction EU in attempt to invest in innovation in Europe and also to improve the life quality of the union’s citizens, introduced the programme “HORIZON 2020” for 2014-15; where one of the main goals is “smart, green and integrated transport”. A key topic of this programme is the improvement of “green” electric vehicles’ technology and charging infrastructure; in an attempt to make electric vehicles (EV) prevail in the vehicle market, as a “cleaner” technology, improving urban air-quality, and also to improve the driving experience of EV drivers. According to the last, this report aim to investigate the prediction of the driving range of EV; which is connected with the real-time information (digital support) for EV drivers for better trip planning and access to charging facilities. The main objective of this research is to investigate the parameters that affect the driving range of EV in real-life driving conditions, in order to test and evaluate the accuracy of the existing methods currently used for EV driving range prediction. This aim to help drivers predict the residual driving range of their vehicles in order to improve their driving experience and better estimate their trips. (a) a smart grip giving information to the EV driver on when the next charge is required and the near available charging facilities, through GPS positioning. This could be through a mobile application or on a pre-installed application on the vehicle. (b) an example of application (“Next Charge”, android app) giving information to the driver about the available near charging stations. (c) an application (“EV Range”, android app) for route planning by the driver; with inputs origin and destination, vehicle model and passengers number, and outputs distance, time, consumption (Wh/km), percentage of the battery capacity left (%), and driving range (km) for all possible routes. • Develop the framework, the modelling of the motor’s required power based on travel ( i.e. distance, traffic conditions, slope, etc.), vehicle (i.e. weight) and driver (i.e. aggressiveness, route choice etc.) related parameters and battery’s discharge rate validation based on the battery's specifications: capacity, state of charge (SOC), current (I), voltage(V), etc. • Investigate the applied and researched modelling methods (for both the motor and the battery) and related parameters • Evaluate the validity and transferability of the methods and the findings regarding how the data where collected, by which conditions, the data sample size, etc. • Research transferable methodology from other studies that can be examine for EVs i.e. ICE vehicles fuel consumption and emissions factors • Define the parameters into modelling factors and discuss limitations • Make the a comparison of the methods and give the proposed method or combination and make proposals for improvements and further research M e t h o d o l o g y Objective Can driving range be predicted accurately? Which data are required? Is the use of these models in real-life feasible? P a r a m e t e r s One of the most advanced features of an EV, compared to the conventional ICE vehicle is its ability to regenerate electricity when decelerate through the regenerative braking system (RBS). Power (KW)/ Acceleration (m/s2) Figure (c) and (d) • For acceleration between -1.5 and 1.5 m/s2, the power proportionally increases with the increase of the acceleration. • For acceleration bellow -1.5 m/s2 or above 1.5 m/s2 the power remains almost the same and doesn’t change with the acceleration. • For both urban (in-city) driving and freeway driving, the power lies between -5 kW and 20 kW • The lower bound is low because EV’s regeneration is limited by the battery pack’s ability to accept charge which is controlled by the battery management system (BMS). Power (KW)/ Roadway gradient (%) Figure (e) and (f) (Gradient information was collected from Google Earth) • As the gradient is increasing the required power is increasing too. • The change in power is significantly larger when the grade is positive • For urban (in-city) driving, the change in power is 20 kW (5 - 25 kW) when the grade changes from 0 to 6%; but when the grade changes from -6 to 0% the power increases only 5 kW (0 - 5 kW) • For the freeway driving, the needed power changes from 12 to 32 kW (20 kW difference) when the grade changes from 0 to 6%; but when the grade changes from -6 to 0% the power increases only 7 kW (5- 12 kW). • For the same gradient the freeway driving requires more power than urban driving probable due to higher speeds. The huge potential benefits of EVs have already attracted significant interest and investment in EV technology. Since 2010 more than 20 manufactures introduced EVs. (a) (b) (c) Reference: Wu, X., Freese, D., Cabrera, A., & Kitch, W. (2015). Electric vehicles' energy consumption measurement and estimation. Elsevier, Transport Research Part D, 52-67. Collection of traffic condition and road type data Categorisation of road- type and congestion level collect vehicle response to traffic and road conditions Simulate vehicle response to traffic and road conditions Model development 1. Single vehicle driving cycle 2. Multiple vehicles driving cycle 1. Road type 2. Speed 3. Speed/stops-starts 4. Speed/ acceleration- deceleration 5. LOS 1. Data logger on EV & GPS positioning (road-information from interactive maps) 2. Data logger on non-EV vehicle(s) 3. Data logger on non-EV vehicle(s) & GPS positioning 4. Aggregate average data (pre-developed driving cycle used) 1. Neural Network 2. Simple statistical analysis 1. Data analysis based algorithms 2. Data analysis based & physic based approach algorithms 3. Physic based approach algorithms, static model (use data for validation) 3. Dynamometer driving schedule 1. Speed 2. Speed/stops-starts 3. Speed/ acceleration- deceleration 1. Data logger on EV 2. Data logger non-EV vehicle 3. Aggregate average data (pre-developed driving cycle used) 1. Statistical analysis 1. Data analysis based algorithms 2. Physic based approach algorithms, static model (use data for validation) 4. Derive from traffic model 1. Road type-traffic model 1. Aggregate average data 1. Statistical analysis 1. Data analysis based & physic based approach algorithms F r a m e w o r k o f p u b l i s h e d E V r a n g e p r e d i c t i n g m e t h o d s
  • 26. Who spend what on the High Street? A comparison of the importance of non-car access between city centre and local shops areas. Institute for Transport Studies, University of Leeds, UK. RESEARCH QUESTION (sustrans, 2006) 55% 22% (4'.•"'10% (6cq13% (1 1 %) Actual mode of customer travel (Shopkeepers estimates in brackets) Shoppers' choice of travel modes in Bristol study rivers limit the range of compact urban centre, flat ervice. One of the best Park and Ride QUESTIONS & OBJECTIVES Which are the accessibility patterns in the city centre and local shops areas? Have they an implication in shops turnover? To determinate if retailers perception about their customer mode of access is accurate, in order to promote a better understanding of transport and land-use policies. CITY OF YORK Advantages for sustainable modes: geography and good public transport s Foot street historical and retail centre. schemes in the UK. Disadvantages: Historical walls and interventions. METHODOLOGY 1) Literature review of economic, planning and transport approaches to High Streets in U.K. and previous academic and "grey" studies. 2)Questionnaires designing based on previous studies and amendments for accuracy to City of York RISK Data collection task may take more time than expected. Get retailers answers while they are working. Fail in achieving the proposed sample size. Lack of support from York City Council CONTEXT "Local areas should implement free controlled parking schemes..." "Cars are an intrinsic part of the way many people shop..." Worths Report,2011,p.5 and p.271 "There is not such thing as "free" parking" (Tyler et a1,2012,p.651 "The literature on parking and retail divides into two groups: those suggesting that parking is important for retail activity and those arguing that retailers have a wrong perception about the modal split of their customer and usually overestimate car use for shopping" IMingrado,2012,p1951 3)Data will be collected by different methods with the aim of accumulating as many answers as possible: face to face, mail drop and email questionnaires. 4. Analysis: data analysis, interpretations and comparison with other results from UK and overseas. 1. Conclusion: Findings of the work. Answers to the research questions and implication for the city of York. REFERENCES s,M. (2011). The Portas Review. An independent review into the future of our Highs Streets. [ONLINE]. [Accessed 29 February 2015]. Available from: https://www.gov.uk/government/uploads/system/up- loadsiattachment_dataifile/6292/2081646.pdf Sustrans. (2006). Real and Perceived travel behaviour in neighbourhood shopping areas in Bristol. Bristol: Sustrans. Tyler, S., Semper, G., Guest, P., & Fieldhouse, B. (2012). The relevance of parking in the success of urban centres, A review for London Councils. UNIVERSITY OF LEEDS DATA Desirable sample size: Consumers centre(n=200) Consumer local( n= 100); Retailers centre(n= 50) Retailers local(n=25). QUESTION EXAMPLES "How often and by which means do you shop"? "How often and by which means do you think your customers shop?" Poster Presentation: 01 May 2015. Student: Pedro Scarpinelli . Dissertation Tutor: Professor Greg Marsden. Institute for Transport Studies, University of Leeds
  • 27. Traffic flows thresholds for Shared Space in Leeds Transport Planning and Engineering. Student: Russell Oakes Supervisor: Dr James Tate Introduction Shared Space is a concept where streets are re-engineered to reduce the dominance of motor vehicles (DfT, 2014) Street signage is limited and kerb heights are reduced or removed completely in some cases. The focus for this project will be in Headingley, North West Leeds. Pedestrian desire lines vary due to the mixture of retail and leisure activities this district has to offer; therefore providing an ideal location to test the theory. Literature The dissertation will be educated by various sources of literature, including... Manual for Streets (1 & 2), Liverpool City Centre Plan (1961), Living Streets Policy, Local Authority Policy (for example Leeds City Council Supplementary Planning Documents), University of the West of England Research, Written interview with the late Hans Monderman and scheme studies. Objectives To ascertain the potential for bringing Shared Space to Headingley by: Understanding previous comparable Shared Space Schemes Compiling a resource containing pedestrian and vehicular data Applying the data to a Micro-simulation Package (Aimsun & Legion) with sensitivity tests Analysing the Aimsun & Legion outputs Determining applicability to Headingley and wider Leeds These objectives will act as milestones throughout the dissertation with the expectation that each objective will be a development on its predecessor. Methodology The project will require site visits to various contrasting examples, compilation of pedestrian data from Leeds City Council and a suitable model simulation running to satisfy the scope of the project. Anticipated issues include the inability to compile pedestrian data for the Headingley area, therefore flexibility with pilot site locations may be required. Two preliminary pilot sites of contrasting traffic density will be used in order to determine the relative scales of operation for a Shared Space scheme. Currently, these sites are North Lane/ Otley Road and St Michaels Road outside the Church. Coventry Top: Before. Source: Oakes, R (2010) Bottom: After. Source: Oakes, R (2015) Preston De-cluttering of street furniture including the removal of traffic lights Narrowing of Fishergate providing wider pavements Provision of informal pedestrian crossings Top: Before. Source: Oakes, R (2013) Bottom: After. Source: Oakes, R (2015) UrbanCaseStudies Top: Before. Source: Oakes, R (2010) Bottom: After. Source: Oakes, R (2015) Downgraded routes complimented by extensive landscaping Closure of through routes and implementation of UKs largest 20mph zone (Coventry City Council, 2010) Mixture of zebra and informal crossings Coventry Top: St Michaels Road. Source: Oakes, R (2015) Bottom: Otley Road/North Lane. Source: Oakes, R (2015) Sources used in the dissertation will include: Early Indications and Potential Outcomes No Shared Space scheme is identical, as demonstrated with the case studies. Therefore, the site visits will assist in the appreciation of the issues apparent in Headingley. An understanding of which environments would best suit a Shared Space scheme with the potential to apply the key findings of this project to policy making within Leeds City Council. Communities are aware of the Shared Space concept and have approached Leeds City Council requesting that this is investigated. If the timescales fit, efforts will be made to draw comparisons where relevant to other Shared Space schemes. This may lead to good practice workings with other Local Authorities subject to interest. Sources of Information The dissertation will call upon quantitative and qualitative sources in order to provide a robust analysis. This could include: Quantitative Leeds City Council Transport Monitoring Database Primary data collection (where required) Scheme monitoring reports (where available) Qualitative City and County Borough of Liverpool 1965, Liverpool City Centre Plan, Liverpool, City and County Borough of Liverpool Moody, S. and Melia, S. (2014) Shared space: Research, policy and problems. Proceedings of the Institution of Civil Engineers - Transport, [Online] Available at: http://www.icevirtuallibrary.com/content/article/10.1680/ tran.12.00047 (Accessed 23rd April 2015)
  • 28. Evaluating the efficiency of Network Aggregation in providing accurate results, using SATURN software. A case study of the Lendal bridge closure in York City.Panagiotis Anastasiadis Dr. David Milne (Supervisor), Prof. David Watling (2nd reader) I. Understand the patterns and unique characteristics of York’s network II. Investigate suitable approaches to network simplification III. Define and describe step by step a network simplification method, which best represents the effects of the traffic. IV. Identify the ideal level of simplification to provide adequately accurate results that help in evaluating transport policies. 3. Case study Lendal bridge closure trial for cars, lorries and motorbikes (10:30-17:00). Start date: 27 August 2013 End date: 26 February 2014 5. Methodology (Link extraction proposed methods) 4. Objectives I) II)