
Recommended
More Related Content
What's hot
Viewers also liked
Similar to Cob 20091008 1
More from macavity_d_katt
More from macavity_d_katt (20)
Recently uploaded
Recently uploaded (20)
Cob 20091008 1
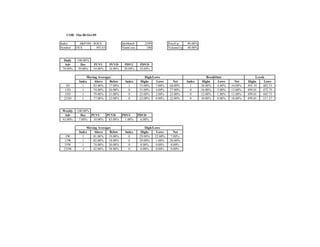
- 1. COB: Thu 08-Oct-09 Index S&P100 - $OEX IdxMatch 2249 PriceUp 40.00% Symbol OEX 492.63 NumCons 100 VolumeUp 48.00% Daily 100.00% Adv Dec PUVU PUVD PDVU PDVD 70.00% 30.00% 54.00% 16.00% 20.00% 10.00% Moving Averages High/Lows BreakOuts Levels Index Above Below Index Highs Lows Net Index Highs Lows Net Highs Lows 3D 1 83.00% 17.00% 1 75.00% 7.00% 68.00% 1 38.00% 4.00% 34.00% 495.19 482.53 13D 1 74.00% 26.00% 0 31.00% 4.00% 27.00% 0 16.00% 3.00% 13.00% 499.01 472.75 55D 1 79.00% 21.00% 0 25.00% 2.00% 23.00% 0 12.00% 1.00% 11.00% 499.01 445.73 233D 1 77.00% 23.00% 0 22.00% 0.00% 22.00% 0 10.00% 0.00% 10.00% 499.01 317.37 Weekly 100.00% Adv Dec PUVU PUVD PDVU PDVD 93.00% 7.00% 10.00% 83.00% 1.00% 6.00% Moving Averages High/Lows Index Above Below Index Highs Lows Net 3W 1 81.00% 19.00% 0 29.00% 22.00% 7.00% 13W 1 82.00% 18.00% 0 29.00% 1.00% 28.00% 55W 1 74.00% 26.00% 0 8.00% 0.00% 8.00% 233W -1 42.00% 58.00% 0 0.00% 0.00% 0.00%
- 2. COB: Thu 08-Oct-09 Index Nasdaq100 - $NDX IdxMatch 2137 PriceUp 36.00% Symbol NDX--X 1717.79 NumCons 100 VolumeUp 62.00% Daily 100.00% Adv Dec PUVU PUVD PDVU PDVD 68.00% 32.00% 56.00% 12.00% 25.00% 7.00% Moving Averages High/Lows BreakOuts Levels Index Above Below Index Highs Lows Net Index Highs Lows Net Highs Lows 3D 1 78.00% 22.00% 1 65.00% 9.00% 56.00% 1 36.00% 5.00% 31.00% 1732.11 1684.08 13D 1 67.00% 33.00% 0 26.00% 6.00% 20.00% 0 13.00% 4.00% 9.00% 1754.54 1656.57 55D 1 82.00% 18.00% 0 19.00% 3.00% 16.00% 0 8.00% 3.00% 5.00% 1754.54 1561.54 233D 1 88.00% 12.00% 0 16.00% 0.00% 16.00% 0 8.00% 0.00% 8.00% 1754.54 1018.86 Weekly 100.00% Adv Dec PUVU PUVD PDVU PDVD 91.00% 9.00% 16.00% 75.00% 3.00% 6.00% Moving Averages High/Lows Index Above Below Index Highs Lows Net 3W 1 75.00% 25.00% 0 25.00% 24.00% 1.00% 13W 1 86.00% 14.00% 0 21.00% 2.00% 19.00% 55W 1 85.00% 15.00% 0 12.00% 0.00% 12.00% 233W 1 55.00% 45.00% 0 3.00% 0.00% 3.00%
- 3. COB: Thu 08-Oct-09 Index S&P500 - $SPX IdxMatch 2772 PriceUp 52.40% Symbol SP-500 1065.48 NumCons 500 VolumeUp 45.20% Daily 99.20% Adv Dec PUVU PUVD PDVU PDVD 75.80% 23.40% 54.80% 21.00% 17.40% 6.00% Moving Averages High/Lows BreakOuts Levels Index Above Below Index Highs Lows Net Index Highs Lows Net Highs Lows 3D 1 82.20% 17.80% 1 71.60% 4.20% 67.40% 1 44.80% 2.00% 42.80% 1070.67 1042.02 13D 1 73.20% 26.80% 0 24.80% 2.80% 22.00% 0 15.00% 1.60% 13.40% 1080.15 1019.95 55D 1 82.80% 17.20% 0 18.20% 1.20% 17.00% 0 10.20% 0.80% 9.40% 1080.15 953.27 233D 1 81.00% 19.00% 0 16.20% 0.00% 16.20% 0 9.00% 0.00% 9.00% 1080.15 666.79 Weekly 99.80% Adv Dec PUVU PUVD PDVU PDVD 93.20% 6.60% 9.60% 83.60% 2.00% 4.60% Moving Averages High/Lows Index Above Below Index Highs Lows Net 3W 1 82.80% 17.20% 0 22.40% 17.80% 4.60% 13W 1 86.60% 13.40% 0 20.60% 1.40% 19.20% 55W 1 78.00% 22.00% 0 5.60% 0.00% 5.60% 233W -1 39.40% 60.60% 0 0.40% 0.00% 0.40%
- 4. COB: Thu 08-Oct-09 Index Russell1000 - $RUI IdxMatch 2614 PriceUp 57.39% Symbol RUI-X 584.70 NumCons 967 VolumeUp 50.78% Daily 99.17% Adv Dec PUVU PUVD PDVU PDVD 78.28% 20.89% 58.84% 19.44% 16.13% 4.76% Moving Averages High/Lows BreakOuts Levels Index Above Below Index Highs Lows Net Index Highs Lows Net Highs Lows 3D 1 82.63% 17.37% 1 71.56% 4.45% 67.11% 1 46.74% 2.38% 44.36% 587.43 570.57 13D 1 74.46% 25.54% 0 26.06% 2.79% 23.27% 0 16.55% 1.76% 14.79% 592.69 559.07 55D 1 83.45% 16.55% 0 18.92% 0.83% 18.10% 0 11.48% 0.52% 10.96% 592.69 521.14 233D 1 82.52% 17.48% 0 16.34% 0.00% 16.34% 0 9.82% 0.00% 9.82% 592.69 362.27 Weekly 99.69% Adv Dec PUVU PUVD PDVU PDVD 93.07% 6.62% 12.51% 80.56% 2.28% 4.34% Moving Averages High/Lows Index Above Below Index Highs Lows Net 3W 1 83.04% 16.96% 0 23.47% 16.03% 7.45% 13W 1 86.14% 13.86% 0 21.51% 1.24% 20.27% 55W 1 78.80% 21.20% 0 6.51% 0.00% 6.51% 233W -1 43.85% 56.15% 0 1.34% 0.00% 1.34%
- 5. COB: Thu 08-Oct-09 Index Russell2000 - $RUT IdxMatch 2616 PriceUp 20.91% Symbol RUT-X 607.75 NumCons 1999 VolumeUp 51.13% Daily 97.15% Adv Dec PUVU PUVD PDVU PDVD 59.08% 38.07% 46.87% 12.06% 27.16% 10.86% Moving Averages High/Lows BreakOuts Levels Index Above Below Index Highs Lows Net Index Highs Lows Net Highs Lows 3D 1 67.53% 32.47% 1 57.38% 6.05% 51.33% 1 26.91% 3.95% 22.96% 612.24 593.53 13D 1 59.88% 40.12% 0 19.11% 3.30% 15.81% 0 9.30% 1.95% 7.35% 625.31 576.40 55D 1 68.83% 31.17% 0 12.31% 1.25% 11.06% 0 5.95% 0.85% 5.10% 625.31 528.11 233D 1 69.78% 30.22% 0 8.05% 0.15% 7.90% 0 4.10% 0.05% 4.05% 625.31 342.59 Weekly 98.70% Adv Dec PUVU PUVD PDVU PDVD 85.69% 13.01% 16.71% 68.98% 3.40% 9.60% Moving Averages High/Lows Index Above Below Index Highs Lows Net 3W 1 69.38% 30.62% 0 21.31% 16.96% 4.35% 13W 1 71.59% 28.41% 0 15.31% 4.15% 11.16% 55W 1 65.73% 34.27% 0 5.35% 0.45% 4.90% 233W -1 35.87% 64.13% 0 1.20% 0.40% 0.80%
- 6. COB: Thu 08-Oct-09 Index Russell3000 - $RUA IdxMatch 2613 PriceUp 32.83% Symbol RUA-X 624.81 NumCons 2967 VolumeUp 51.03% Daily 97.81% Adv Dec PUVU PUVD PDVU PDVD 65.35% 32.46% 50.79% 14.46% 23.56% 8.86% Moving Averages High/Lows BreakOuts Levels Index Above Below Index Highs Lows Net Index Highs Lows Net Highs Lows 3D 1 72.46% 27.54% 1 62.02% 5.53% 56.49% 1 33.40% 3.44% 29.96% 627.86 609.55 13D 1 64.61% 35.39% 0 21.37% 3.13% 18.23% 0 11.66% 1.89% 9.77% 634.09 597.13 55D 1 73.54% 26.46% 0 14.46% 1.11% 13.35% 0 7.75% 0.74% 7.01% 634.09 555.81 233D 1 73.91% 26.09% 0 10.75% 0.10% 10.65% 0 5.97% 0.03% 5.93% 634.09 384.41 Weekly 99.06% Adv Dec PUVU PUVD PDVU PDVD 88.10% 10.95% 15.34% 72.77% 3.03% 7.92% Moving Averages High/Lows Index Above Below Index Highs Lows Net 3W 1 73.81% 26.19% 0 22.01% 16.65% 5.36% 13W 1 76.31% 23.69% 0 17.32% 3.20% 14.12% 55W 1 69.97% 30.03% 0 5.73% 0.30% 5.43% 233W -1 38.49% 61.51% 0 1.25% 0.27% 0.98%
- 7. COB: Thu 08-Oct-09 Index S&P400 - $MID IdxMatch 2017 PriceUp 61.50% Symbol MID--X 697.12 NumCons 400 VolumeUp 64.00% Daily 99.00% Adv Dec PUVU PUVD PDVU PDVD 80.25% 18.75% 66.25% 14.00% 15.25% 3.50% Moving Averages High/Lows BreakOuts Levels Index Above Below Index Highs Lows Net Index Highs Lows Net Highs Lows 3D 1 83.75% 16.25% 1 72.00% 3.75% 68.25% 1 47.25% 2.50% 44.75% 699.94 677.44 13D 1 74.25% 25.75% 0 23.50% 2.50% 21.00% 0 15.00% 2.00% 13.00% 706.98 661.57 55D 1 83.00% 17.00% 0 16.00% 0.25% 15.75% 0 10.50% 0.25% 10.25% 710.20 600.41 233D 1 83.75% 16.25% 0 12.25% 0.00% 12.25% 0 7.75% 0.00% 7.75% 710.20 397.97 Weekly 99.50% Adv Dec PUVU PUVD PDVU PDVD 93.50% 6.00% 15.75% 77.75% 3.00% 3.00% Moving Averages High/Lows Index Above Below Index Highs Lows Net 3W 1 82.75% 17.25% 0 20.50% 17.25% 3.25% 13W 1 85.75% 14.25% 0 19.00% 1.75% 17.25% 55W 1 79.00% 21.00% 0 6.50% 0.00% 6.50% 233W 1 45.50% 54.50% 0 2.00% 0.00% 2.00%
- 8. COB: Thu 08-Oct-09 Index S&P600 - $SML IdxMatch 2735 PriceUp 31.17% Symbol SML--X 319.50 NumCons 600 VolumeUp 64.83% Daily 98.00% Adv Dec PUVU PUVD PDVU PDVD 64.67% 33.33% 55.00% 9.50% 26.33% 7.00% Moving Averages High/Lows BreakOuts Levels Index Above Below Index Highs Lows Net Index Highs Lows Net Highs Lows 3D 1 70.67% 29.33% 1 62.67% 6.17% 56.50% 1 32.50% 3.67% 28.83% 321.63 311.62 13D 1 60.50% 39.50% 0 21.67% 4.17% 17.50% 0 12.33% 2.50% 9.83% 327.11 304.07 55D 1 72.17% 27.83% 0 14.67% 1.33% 13.33% 0 7.17% 1.00% 6.17% 327.11 280.35 233D 1 74.33% 25.67% 0 10.17% 0.00% 10.17% 0 5.50% 0.00% 5.50% 327.11 181.32 Weekly 98.83% Adv Dec PUVU PUVD PDVU PDVD 87.00% 11.83% 18.17% 68.83% 3.83% 8.00% Moving Averages High/Lows Index Above Below Index Highs Lows Net 3W 1 69.83% 30.17% 0 22.00% 19.00% 3.00% 13W 1 74.50% 25.50% 0 17.50% 3.33% 14.17% 55W 1 70.17% 29.83% 0 5.17% 0.17% 5.00% 233W -1 39.67% 60.33% 0 1.83% 0.17% 1.67%