Download as PDF, PPTX


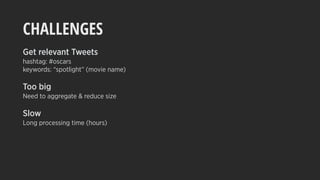


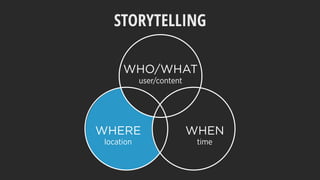


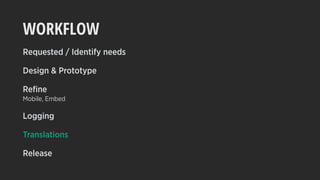


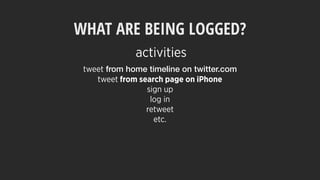

![LOG EVENT A.K.A. “CLIENT EVENT”
[Lee et al. 2012]](https://image.slidesharecdn.com/whattoexpectwhenyouarevisualizing-160412060948/85/What-to-expect-when-you-are-visualizing-107-320.jpg)
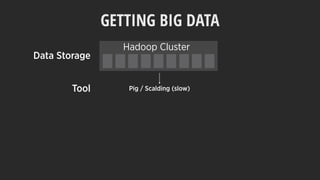
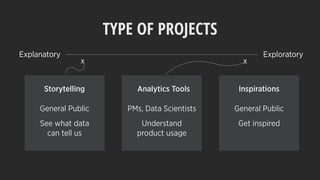
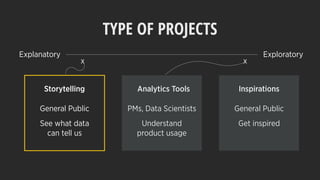
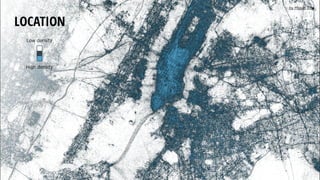
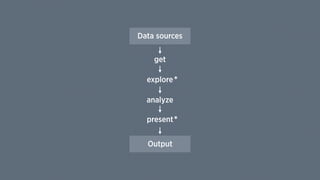
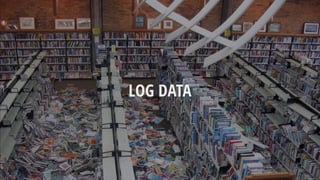
![LOG EVENT A.K.A. “CLIENT EVENT”
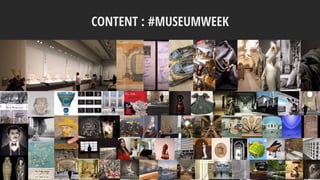
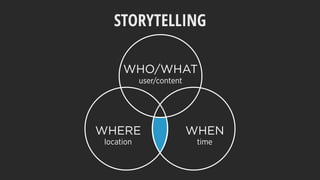
client : page : section : component : element : action
web : home : timeline : tweet_box : button : tweet
1) User ID
2) Timestamp
3) Event name
4) Event detail
[Lee et al. 2012]](https://image.slidesharecdn.com/whattoexpectwhenyouarevisualizing-160412060948/85/What-to-expect-when-you-are-visualizing-108-320.jpg)


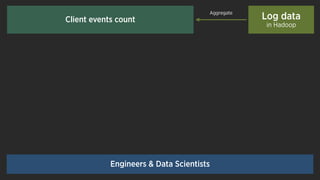


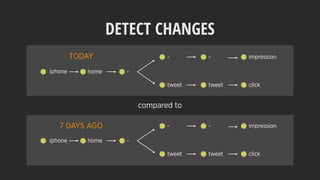

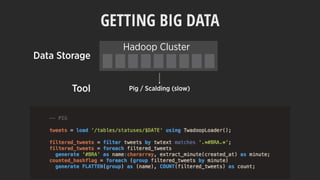
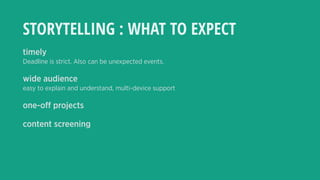
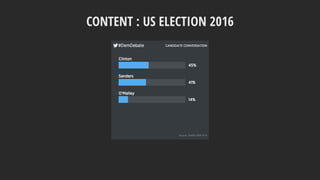
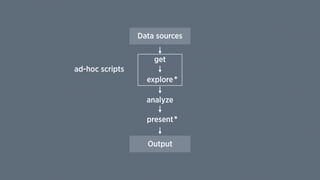
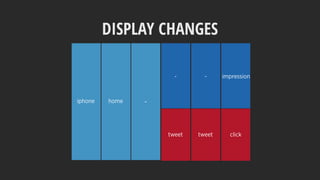
![DISPLAY CHANGES
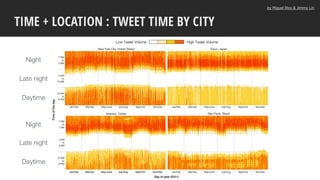
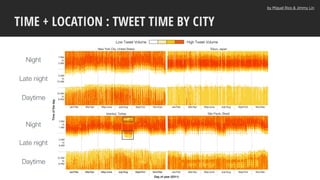
iphone home -
- - impression
tweet tweet click
Map of the Market [Wattenberg 1999], StemView [Guerra-Gomez et al. 2013]](https://image.slidesharecdn.com/whattoexpectwhenyouarevisualizing-160412060948/85/What-to-expect-when-you-are-visualizing-141-320.jpg)


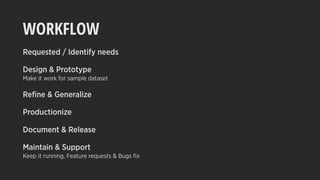


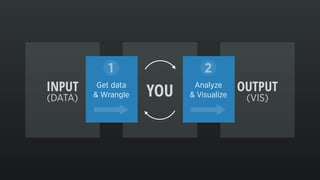
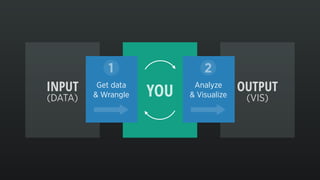


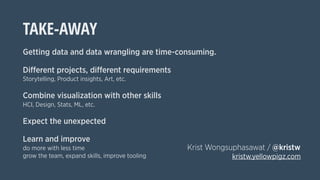


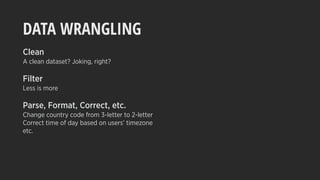
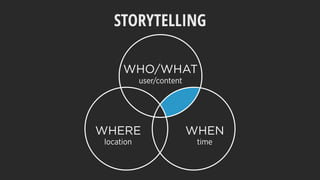
The document outlines the process and expectations in data visualization, particularly in the context of working with large datasets and varied client requirements. It emphasizes the importance of data wrangling, the time-consuming nature of data cleaning, and the need for effective communication and documentation throughout the project lifecycle. It also highlights different types of projects and the necessity to adapt visualization strategies based on audience and purpose, while expecting unexpected challenges and revisions.


