Downloaded 450 times


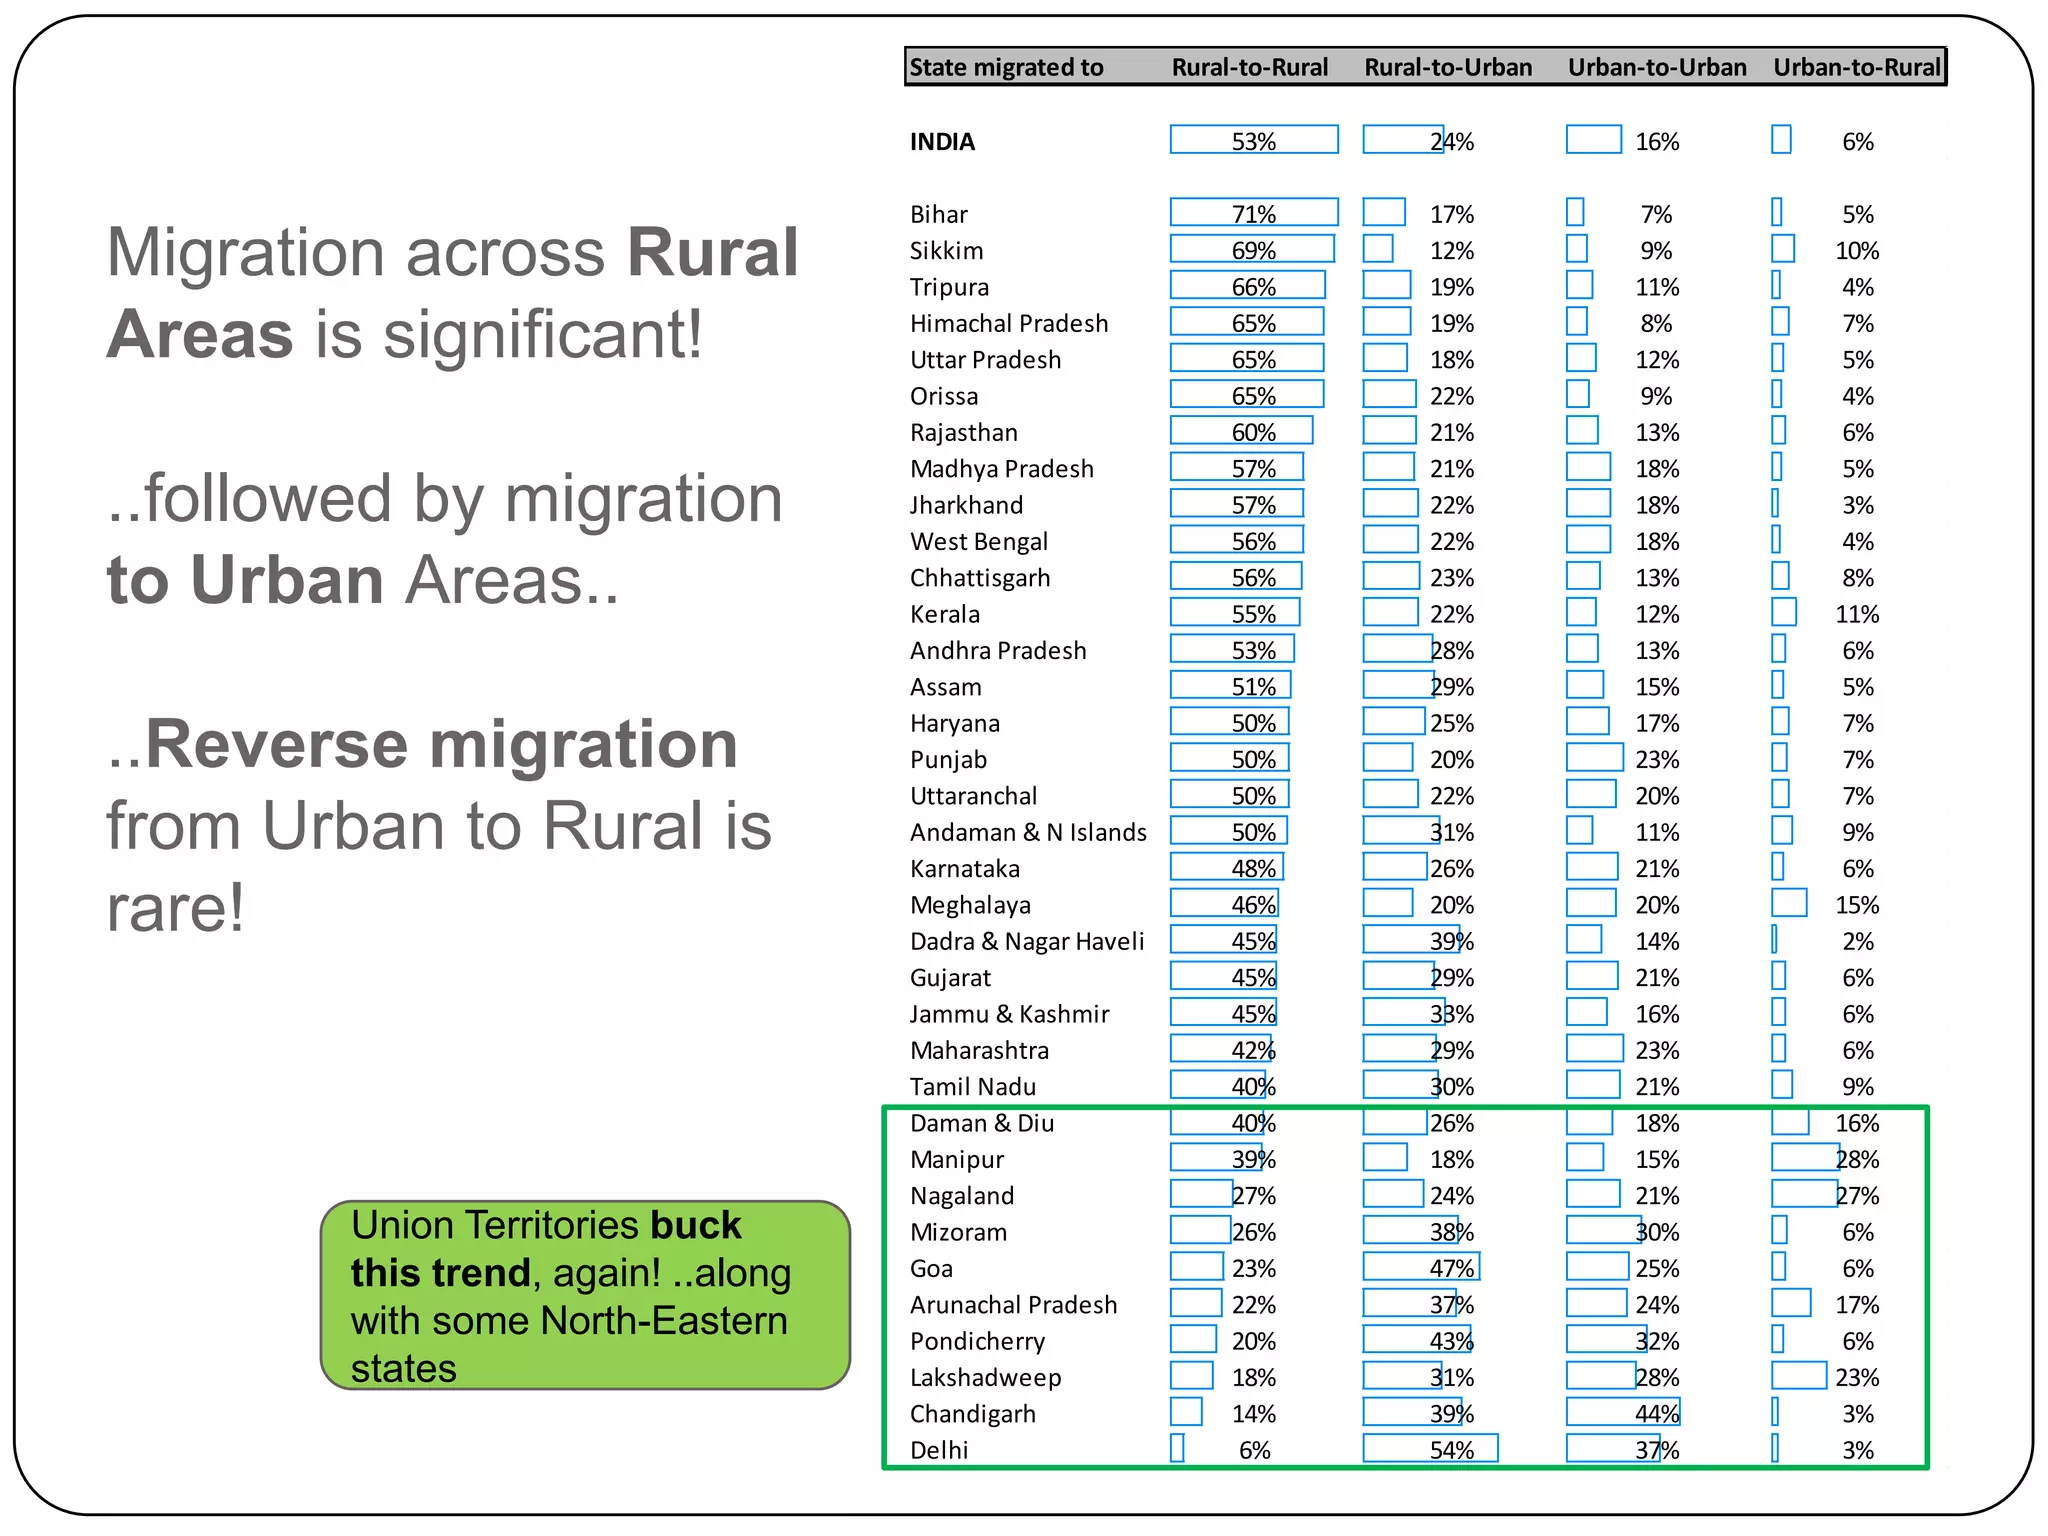


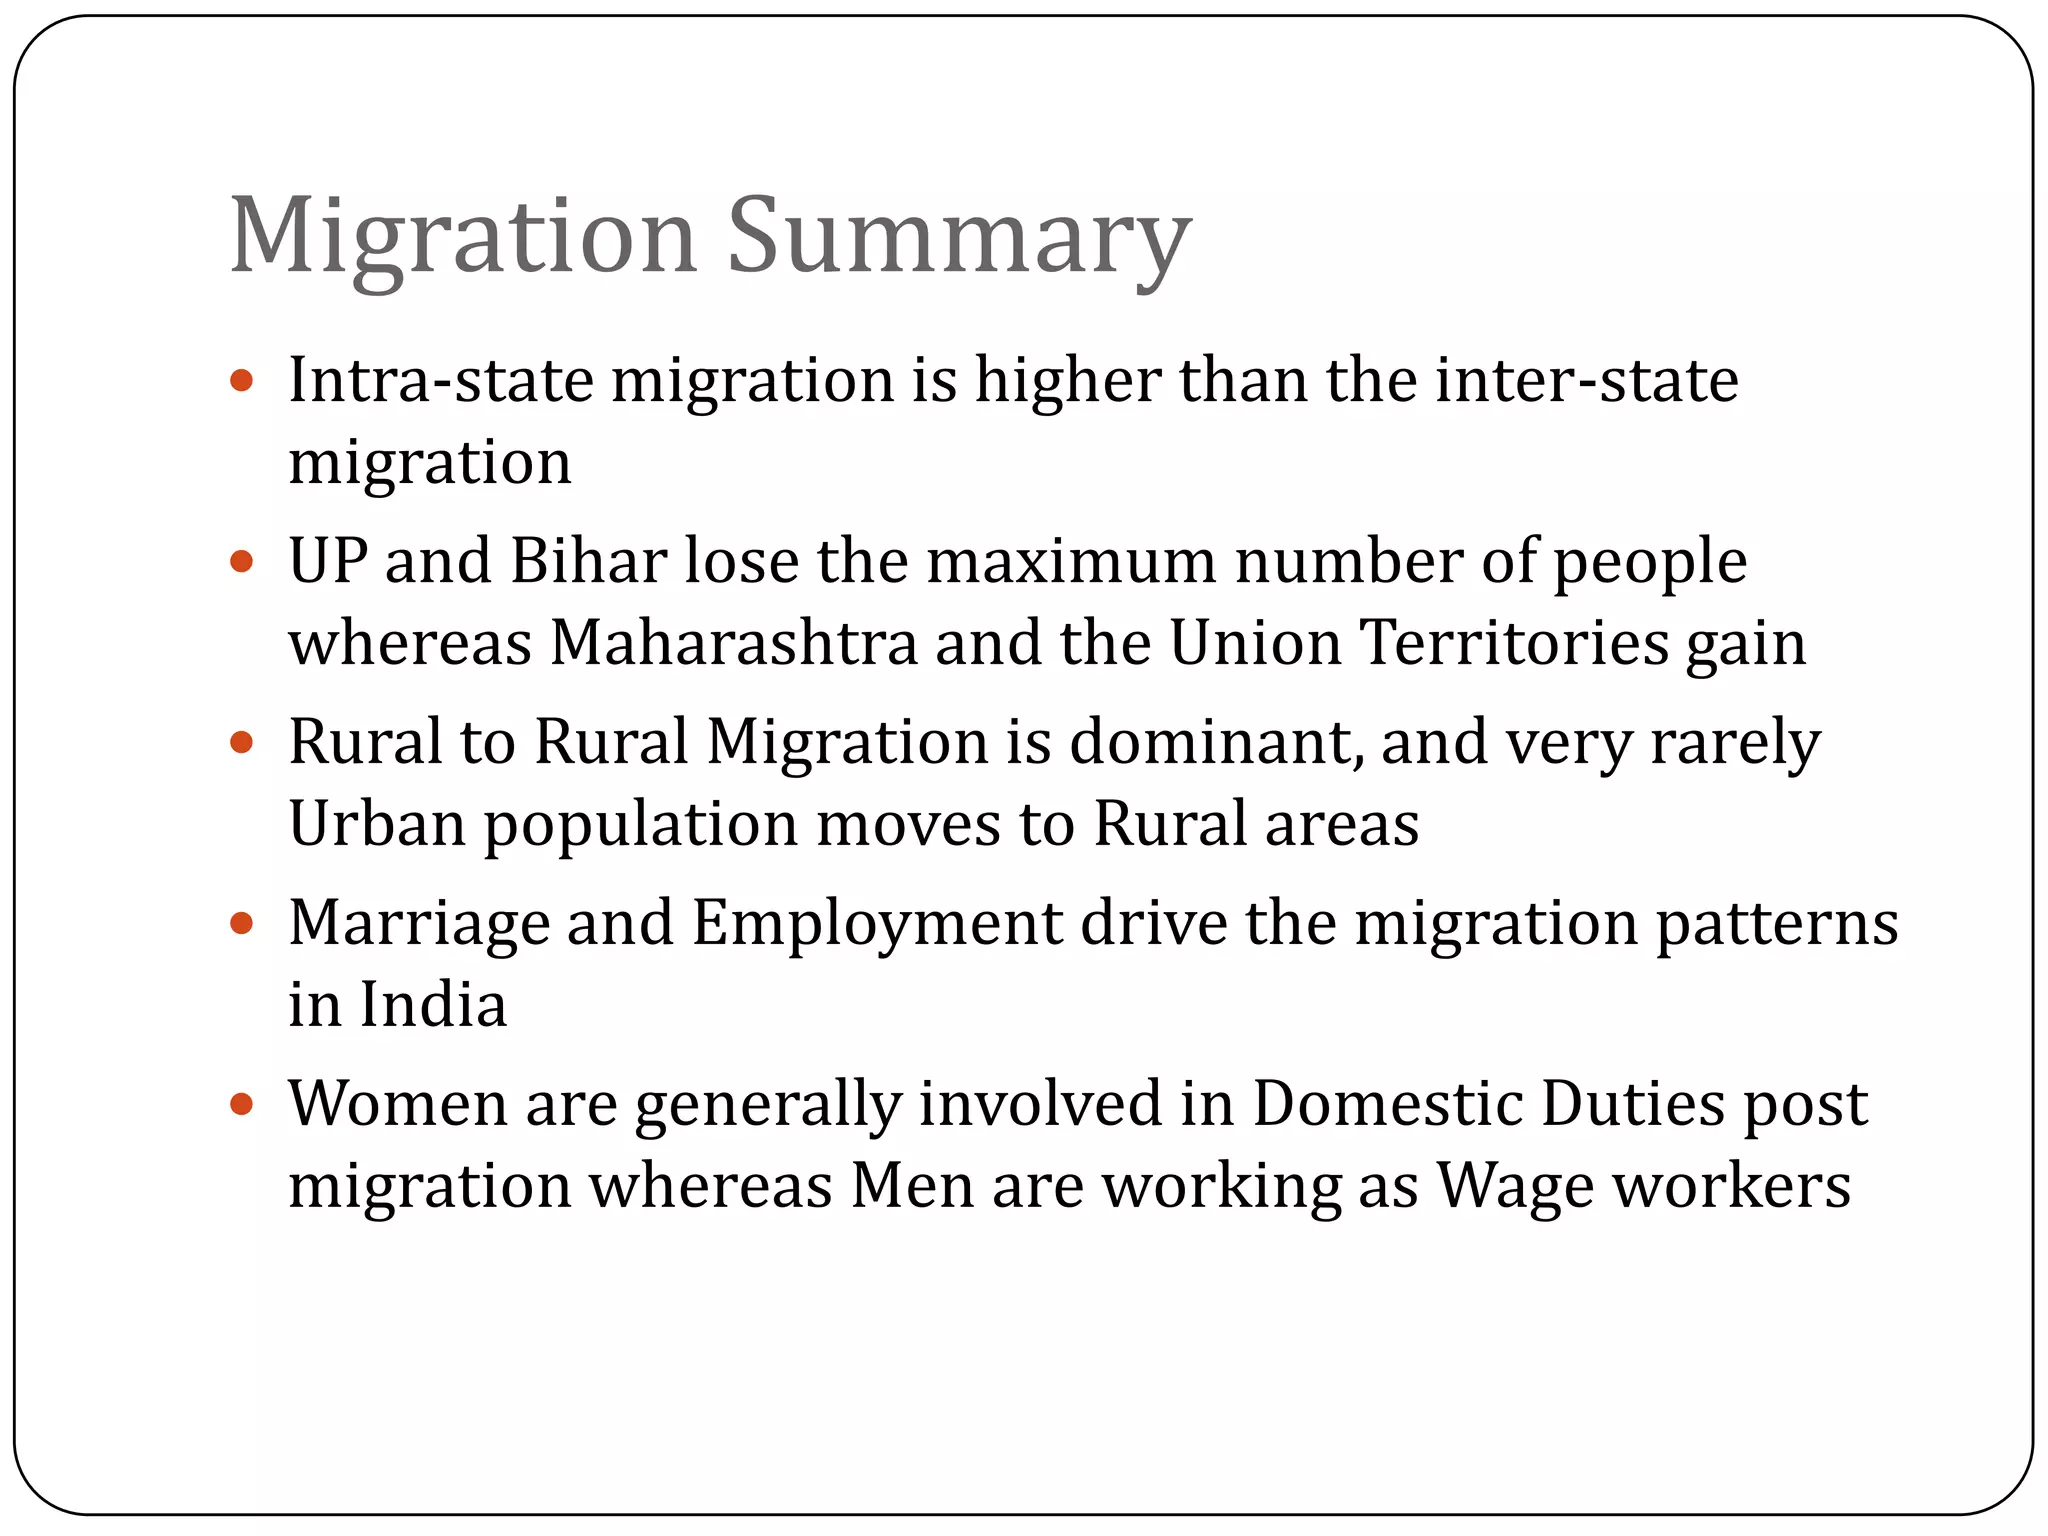


The document discusses migration patterns in India using data from the National Sample Survey. Some key findings include: 1) 85% of migration was intra-state, within states, while 15% was inter-state, across state boundaries. 2) States with the highest numbers of intra-state migrants included Uttar Pradesh, Bihar, and Rajasthan. 3) States that experienced the highest net inflows of inter-state migrants included Delhi, Maharashtra, and the union territories of Chandigarh and Daman & Diu. 4) Over half of all migration was from rural to rural areas, while rural to urban and urban to rural migration were also significant.


