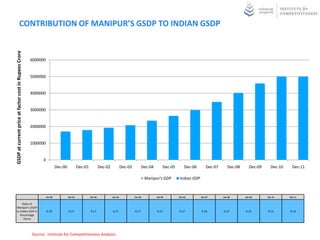
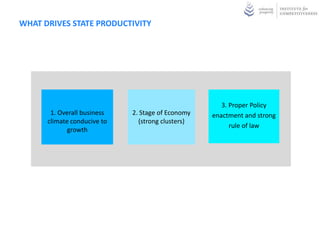
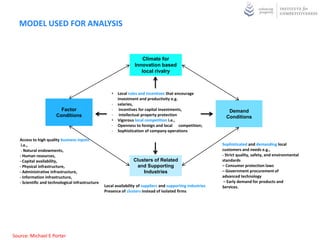
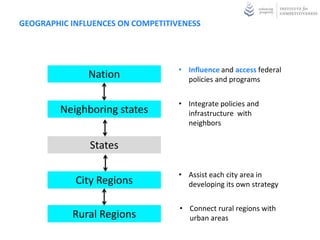
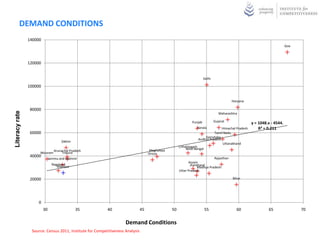
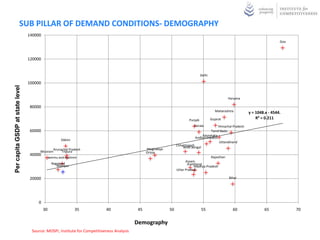
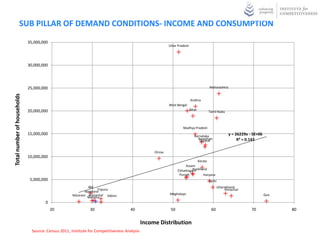
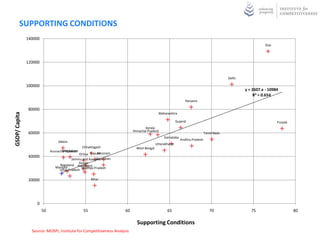
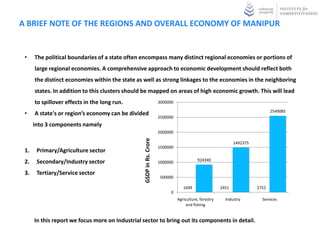
2. ECONOMIC CHALLENGE FOR CHIEF MINISTERS IN 2012
Achieving Fiscal
Stability
Enhancing State
Competitiveness
• Competitiveness is the only way to achieve sustainable job growth, improving
incomes and stable public finances
• Creating a clear economic strategy for the state that engages all stakeholders is
even more important in times of budget cutting and austerity
3. HIERARCHY OF MEASUREMENT OF STATE COMPETITIVENESS INDEX
4 Major
Pillars
12 Sub Indices
350* Indicators
* Approximate figure
4. STAGES OF THE ECONOMY
Innovation Driven Economies (Per capita GDP 900 to
City States (Per capita GDP>1300 USD) 1300 USD)
Transition Economies (Per capita GDP 800 to 900 USD)
Investment Driven Economies (Per capita GDP 500 to
800 USD)
Evolving / Changeover Economies (Per capita GDP 400
to 500 USD)
Factor Driven Economies(Per capita GDP < 400 USD)
5. STATES ACCORDING TO CATEGORIZATION
Microeconomic Competitiveness
Categorization
Ranks
City States (Per capita Incomes >1300 USD)
Delhi 1
Goa 2
Innovation Driven Economies (Per capita Incomes 900 to1300 USD)
Haryana 1
Maharashtra 2
Gujarat 3
Kerala 4
Transition Economies (Per capita Incomes 800 to 900 USD)
Punjab 1
Tamil Nadu 2
Himachal Pradesh 3
Investment Driven Economies (Per capita Incomes 500 to 800 USD)
Andhra Pradesh 1
Karnataka 2
Uttarakhand 3
West Bengal 4
Chhattisgarh 5
Sikkim 6
Mizoram 7
Meghalaya 8
Arunachal Pradesh 9
Tripura 10
Evolving/ Changeover Economies (Per capita Incomes 400 to 500 USD)
Rajasthan 1
Jharkhand 2
Orissa 3
Jammu and Kashmir 4
Factor Driven Economies(Per capita Incomes < 500 USD)
Bihar 1
Madhya Pradesh 2
Assam 3
Uttar Pradesh 4
Manipur 5
Nagaland 6
Source: Institute for Competitiveness Analysis
6. NEAR TERM STATE PROSPERITY PERFORMANCE
9
Gross Domestic Product per Capita real growth rate, 2008-2011
Haryana
Low but rising versus India Chhattisgarh
Highly Productive and Prosperity
Bihar Rising versus India
Maharashtra
8
Himachal Pradesh
Uttar Pradesh
Andhra Pradesh
Orissa
7 Karnataka Punjab
Sikkim
Uttarakhand
Arunachal Pradesh Kerala
Assam Gujarat
Rajasthan
Tripura
6
Points
Index
57.28
Average
All India
Tamil Nadu
West Bengal
Meghalaya
All India GSDP Delhi
Goa
/Capita rate
Jharkhand
(CAGR) of 6.27 %
Mizoram
5
Manipur
Madhya Jammu & Kashmir
Pradesh
All India Average
4
Nagaland of 47,998
Low and declining versus India Rupees/capita
High but declining versus India
3
0 20000 40000 60000 80000 100000 120000 140000
Gross Domestic Product per Capita, 2011
7. COMPETITIVENESS: UNDERLYING CONCEPTS
• Competitiveness is the productivity with which a state utilizes its
human, capital, and natural resources
• Productivity determines wages and the standard of living – Productivity
growth determines sustainable economic growth
• Productivity depends on how a state competes, not what industries it
competes in
• Innovation in products and processes is necessary to drive productivity
growth
• Only productive businesses can create wealth and jobs. States compete to
offer the most productive environment for business
• The public and private sectors play different but interrelated roles in creating
a productive economy
8. MANIPUR PERFORMANCE SNAPSHOT
Position Trend
Prosperity
Productivity
Labour Mobilization
State of Clusters
Type of Economy Investment Driven Top 33.33% of the
states
33.33%-66.67% of
the states
Construction
Leading Clusters Agriculture
Electricity and gas supply 66.67% to 100% of
the states
9. MANIPUR COMPETITIVENESS – OVERALL PERFORMANCE INDICATORS
Prosperity Clusters
Gross State Domestic Product per Capita, 2011 Rank: 3 Total Number of People employed in all Factory sector Rank: 5
• In Manipur Rs. 25,591 • In Manipur 3478
• In India Rs. 47,998 • In India 1,15,06,838
• State Difference to India -46.68%. • State Employment to total
India Employment (factory sector) 0.03%
Growth in Gross State Domestic Product per Capita, 2008-11 , (CAGR) Rank: 4
• In Manipur 4.66%
• In India 6.28%
Productivity Labour Mobilization
Population, 2011 Rank: 5
Gross State Domestic Product per labour force participant, 2011 Rank: 3 • In Manipur 27,21,756
• In Manipur Rs 65,466. • % of India 4.98%
• In India Rs 1,21,265
• State Difference to India -46.07% Population Growth, GAGR, 2001-2011 Rank: 1
• In Manipur 2.31%
Growth in Gross State Domestic Product Rank: 6 • In India 1.61%
per Labour force participant, 2001-11
• In Manipur 5.59% Employment, 2010 Rank: 5
• In India 8.44% • In Manipur 5,75,968
• % India .2025%
Average Private Wage in 2008-09, Rank:5
• In Manipur Rs 26,329 Employment growth, annual rate, 2000-2010 Rank: 1
• In India Rs 64,741 • In Manipur 2.84%
• State Difference to India -59.33.% • In India 2.05%
Private Wage Growth, CAGR, 2000-2009 Rank:1 Unemployment, 2010 (Per hundred People) Rank: 2
• In Manipur 8.68% • In Manipur 11.70
• In India 4.53% • In India 9.39
Change in Unemployment rate, 2000-2010 Rank: 2
• In Manipur 74.63%
• In India 41.37
10. UNDERSTANDING STATE ECONOMIC PERFORMANCE
Manipur
8000
7000
GSDP at current price at factor cost in Rupees Crore
6901
6523
6344
6000
5848
5403
5000
5066
4568
4000
3979
3506
3369
3000
3260
3112
2000
1000
0
Dec-00 Dec-01 Dec-02 Dec-03 Dec-04 Dec-05 Dec-06 Dec-07 Dec-08 Dec-09 Dec-10 Dec-11
Source : Institute for Competitiveness Analysis
11. CONTRIBUTION OF MANIPUR’S GSDP TO INDIAN GSDP
GSDP at current price at factor cost in Rupees Crore
6000000
5000000
4000000
3000000
2000000
1000000
0
Dec-00 Dec-01 Dec-02 Dec-03 Dec-04 Dec-05 Dec-06 Dec-07 Dec-08 Dec-09 Dec-10 Dec-11
Manipur's GDP Indian GDP
Dec-00 Dec-01 Dec-02 Dec-03 Dec-04 Dec-05 Dec-06 Dec-07 Dec-08 Dec-09 Dec-10 Dec-11
Ratio of
Manipur's GSDP
to Indian GDP in 0.19 0.17 0.17 0.17 0.17 0.17 0.17 0.16 0.15 0.14 0.13 0.14
Percentage
Terms
Source : Institute for Competitiveness Analysis
12. WHAT DRIVES STATE PRODUCTIVITY
3. Proper Policy
1. Overall business 2. Stage of Economy enactment and strong
climate conducive to (strong clusters)
rule of law
growth
13. MODEL USED FOR ANALYSIS
Climate for
Innovation based
local rivalry
• Local rules and incentives that encourage
investment and productivity e.g.
- salaries,
Factor - incentives for capital investments, Demand
Conditions - intellectual property protection
Conditions
• Vigorous local competition i.e.,
- Openness to foreign and local competition;
- Sophistication of company operations
Access to high quality business inputs
i.e., Sophisticated and demanding local
- Natural endowments, customers and needs e.g.,
- Human resources, - Strict quality, safety, and environmental
- Capital availability, Clusters of Related standards
- Physical infrastructure, and Supporting – Consumer protection laws
- Administrative infrastructure, Industries – Government procurement of
- Information infrastructure, advanced technology
- Scientific and technological infrastructure – Early demand for products and
Local availability of suppliers and supporting industries Services.
Presence of clusters instead of isolated firms
Source: Michael E Porter
14. IMPROVING PRODUCTIVITY IN BUSINESS ENVIRONMENT
Key Issues for States
• More power in terms of tax sharing with center
• Reduce costs of doing business
• Developing training programs which meet the specific needs of the state
industrial clusters
• Focus on infrastructure investments on the most leveraged areas for
productivity and economic growth
• Implementing policies to support small growth businesses
• Enhancing the state’s skill development and training institutions for the same
• Relentlessly improve of the public education system, the essential foundation
15. GEOGRAPHIC INFLUENCES ON COMPETITIVENESS
• Influence and access federal
Nation policies and programs
• Integrate policies and
Neighboring states infrastructure with
neighbors
States
• Assist each city area in
City Regions developing its own strategy
• Connect rural regions with
Rural Regions urban areas
16. CONTRIBUTION OF AGRICULTURE SECTOR TO GSDP
8000
GSDP at current price at factor cost in Rupees Crore
7000
6000
5000
4000
3000
2000
1000
0
Dec-00 Dec-01 Dec-02 Dec-03 Dec-04 Dec-05 Dec-06 Dec-07 Dec-08 Dec-09 Dec-10 Dec-11
Ratio of
Agricultural
GSDP in
Manipur to the
26.91 29.56 28.76 28.95 29.61 28.83 26.84 26.05 24.91 23.55 24.86 24.61
total GSDP in
Manipur in
Percentage
terms
Source : Institute for Competitiveness Analysis
17. CONTRIBUTION OF MANUFACTURING SECTOR TO GSDP
GSDP at current price at factor cost in Rupees Crore
8000
7000
6000
5000
4000
3000
2000
1000
0
Dec-00 Dec-01 Dec-02 Dec-03 Dec-04 Dec-05 Dec-06 Dec-07 Dec-08 Dec-09 Dec-10 Dec-11
Ratio of
Manufacturi
ng GSDP in
Manipur to
the total 6.11 6.95 6.24 6.44 6.28 6.10 6.01 6.21 6.19 6.16 6.11 6.09
GSDP in
Manipur in
Percentage
terms
Source : Institute for Competitiveness Analysis
18. CONTRIBUTION OF SERVICE SECTOR TO GSDP
8000
GSDP at current price at factor cost in Rupees Crore
7000
6000
5000
4000
3000
2000
1000
0
Dec-00 Dec-01 Dec-02 Dec-03 Dec-04 Dec-05 Dec-06 Dec-07 Dec-08 Dec-09 Dec-10 Dec-11
Ratio of
Services
GSDP in
Manipur to
the total 50.80 48.81 49.52 47.49 44.61 42.95 42.59 41.92 41.63 41.37 40.34 39.87
GSDP in
Manipur in
Percentage
terms
Source : Institute for Competitiveness Analysis
19. COMPOSITION OF MANIPUR’S ECONOMY
Agriculture, forestry
and fishing
Services 25%
40%
Industry
35%
Source : Institute for Competitiveness Analysis
20. COMPOSITION OF MANIPUR’S ECONOMY
3000000
2549085
2500000
GSDP in Rs. Crore
2000000
1492375
1500000
1000000 924340
500000
1699 2451 2752
0
Agriculture, forestry and fishing Industry Services
Indian contribution
Manipur’s contribution
Source : Institute for Competitiveness Analysis
21. COMPOSITION0.45 MANIPUR’S ECONOMY IN GREATER DEPTH
OF
0.4
Public administration and defence
0.35
Construction
0.3
Manipur /National GSDP share (Percent) ,2011
Fishing
0.25
Electricity, gas and water supply
0.2 Forestry and logging
Other services
0.15 Agricuture
0.1 Communication
Real states, ownership of dwellings and
business services
0.05 Trade, hotel and restaurant
Manufacturing Banking and insurance
Transport by other means
Storage
0 Railways
-5 0 5 10 15 20
-0.05
-0.1
Change in contribution of GSDP of Manipur to total Indian GSDP, CAGR (2000-2011)
Source : Institute for Competitiveness Analysis
22. STATE PRIVATE WAGE PERFORMANCE
160000
140000
Jharkhand Wage Growth
rate 4.53%
Average Wages in Rupees ,2009
120000
Uttaranchal
Orissa
100000 Maharashtra
Goa
Average Wage :
Rupees 64,741
80000 Chhattisgarh West Bengal Madhya Pradesh
Haryana Karnataka
Gujarat Meghalaya
Delhi Himachal Pradesh
Uttar Pradesh
60000 Andhra Pradesh
Punjub Tamil Nadu
Kerala Rajasthan
Jammu & Kashmir
Bihar Assam
40000
Manipur
Tripura Nagaland
20000 Low and declining versus India Low but rising versus India
0
0 2 4 6 8 10 12 14
Wage Growth (CAGR), 2001 to 2008
Source : Institute for Competitiveness Analysis, Data as of 2010
23. LABOUR PRODUCTIVITY
400000
GSDP at Current Prices per labour force participant, 2011
Goa
350000 High but declining versus India Highly productive and Productivity
rising versus India
300000
Points
Index
57.28
e
Averag
India
All
Delhi
All India Average of
250000 8.44%
Haryana
200000
All India Average of of Punjab Maharashtra
Kerala Gujarat
1,21,265 Rupees/Labour Himachal Pradesh
150000 force participant Tamil Nadu
Karnataka Andhra Pradesh
Sikkim
West Bengal Uttarakhand Chhattisgarh
Mizoram Nagaland
100000 MeghalayaTripura Pradesh
Arunachal Orissa
Rajasthan
Jammu & Kashmir Assam
Madhya Pradesh Jharkhand
Manipur
Uttar Pradesh
50000 Bihar
Low and declining versus India Low but rising versus India
0
5.00 6.00 7.00 8.00 9.00 10.00 11.00 12.00 13.00
GSDP /Labor force participant growth rate(CAGR)
Source : Institute for Competitiveness Analysis
24. LONG TERM JOB GROWTH
90000000
Uttar Pradesh
80000000
70000000
All India Average of
60000000
2.05%
Number of Jobs, 2011
50000000
Maharashtra
Bihar
40000000
West Bengal
Andhra Pradesh
All India average of
Madhya Pradesh
30000000 1,62,99,464 Jobs Tamil Nadu
Rajasthan
/State Karnataka
Gujarat
20000000 Orissa
Jharkhand
Kerala Assam
Punjab
Haryana
Chhattisgarh
10000000 Delhi
Uttarakhand Jammu & Kashmir
Himachal Pradesh
Nagaland Goa Tripura Mizoram Manipur
Arunachal Pradesh Meghalaya
0 Sikkim
0 0.5 1 1.5 2 2.5 3 3.5
Losing Jobs Job growth rate CAGR, 2001-2010 Gaining Jobs
Source : Institute for Competitiveness Analysis,
25. LONG TERM UNEMPLOYMENT RATE
30
Goa
jharkhand
25
s
Point
Index
57.28
ge
Avera
India
All
Below average Unemployment All India Average of -
20 2.12%
Rajasthan
Unemployment rate 2010
Bihar
Unemployment Rising
15
Unemployment rate
All India Average of Meghalaya
9.39% West Bengal kerala
Gujarat
Punjab MizoramOrissa
Uttar Pradesh
10
Haryana Nagaland
Manipur
Tripura Andhra Pradesh
Madhya Pradesh
Arunachal Pradesh Above Average
Himachal Pradesh Assam Unemployment
Sikkim Maharashtra
Jammu Tamil Nadu
5 Uttarakhand
Chhattisgarh
Karnataka Delhi
0
-25 -20 -15 -10 -5 0 5 10 15
Change in Employment rate 1999-2010
Source : Institute for Competitiveness Analysis, Data as of 2010
26. NEAR TERM UNEMPLOYMENT RATE
30
Goa
jharkhand
Points
Avera
57.28
Index
All India Average of -
India
25
6.55%
All
ge
20
Unemployment rate 2010
Rajasthan
Bihar
15
All India Average of Meghalaya
West Bengal
9.39% Punjab
Gujarat kerala
Orissa
Haryana 10
Uttar Pradesh
Manipur
Mizoram Nagaland Madhya Pradesh
Tripura Andhra Pradesh
Arunachal Pradesh
Sikkim Assam
Himachal Pradesh Maharashtra Tamil Nadu
Jammu Uttarakhand
5
Chhattisgarh
Karnataka
Delhi
0
-30 -25 -20 -15 -10 -5 0 5 10
Change in Employment rate 2008 to 2010
Source : Institute for Competitiveness Analysis, Data as of 2010
27. GROSS AREA SOWN VERSUS IRRIGATED AREA
100000
Madhya Pradesh
Maharashtra
Uttar Pradesh
Rajasthan
Tamil Nadu Andhra Pradesh
10000 Gujarat
West Bengal
Punjab Karnataka
Chhattisgarh BiharOrissaHaryana
Log of area sown in ‘000 hectares
Assam
Kerala
All India Average Jharkhand
1000
67,41,000 Uttarakhand
Jammu & Kashmir
hectares Himachal Pradesh
India
All
All India Average
Meghalaya Nagaland
Arunachal Pradesh Manipur 30,03,000 hectares
Goa
100 Sikkim
Mizoram
Delhi
10
1
1 10 100 1000 10000 100000
Log of Irrigated Area in ‘000 hectares
Source: MOA, Institute for Competitiveness Analysis, Data as of 2010
28. HEALTHCARE
Percentage of Total government Expenditure on Medical, Health
10
Delhi
9
8
7
and Sanitation
6 Goa
Jammu & Kashmir
Uttarakhand
All India Average
5 Manipur
Himachal Pradesh 4.02%
AssamKerala
Meghalaya West Bengal Tamil Nadu
Tripura
Nagaland Uttar Pradesh
Mizoram Rajasthan
4 Gujarat
Sikkim Chhattisgarh Karnataka
Jharkhand Haryana Andhra Pradesh
Madhya Pradesh Maharashtra
Orissa
Punjab Bihar
3
Arunachal Pradesh
India
All
2
All India Average 1633
Crores
1
0 1000 2000 3000 4000 5000 6000
Total Government Expenditure on Medical, Health and Sanitation in Crores
Source: Institute for Competitiveness Analysis
29. PERCENTAGE OF VILLAGES ELECTRIFIED
120
100 100.0
100.099.7100.098.2 98.2 99.9100.0 100.0 100.0
All India 100 96.9 96.4 96.9 97.3
94.4
Average of 88.3
85.8
88.3
84.96 % 80.8 80.6
80
69.2
64.4 62.6
61.3
59.3
60 56.8 57.2
40
31.1
20
0
Source: Institute for Competitiveness Analysis
30. TELEDENSITY
140000
Goa
120000
y = 429.3x + 12630
R² = 0.388
Delhi
100000
Haryana
80000
GSDP per Capita
Maharashtra
Gujarat Punjab
Kerala
Himachal Pradesh
60000 Tamil Nadu
Karnataka
Andhra Pradesh
Sikkim
Arunachal Pradesh Bengal
West
MeghalayaChhattisgarh
Mizoram
Tripura
Orissa Uttarakhand
40000
Jammu & Kashmir Rajasthan
Nagaland Jharkhand
Manipur
Madhya Pradesh
Uttar Pradesh
20000
0
50 70 90 110 130 150 170 190 210 230 250
Teledensity
Source: Ministry of telecom, Institute for Competitiveness Analysis
31. DEBT TO GDP RATIO
West Bengal 42.8 Prescribed limit according to the
Uttaranchal 41.1 growth and stability Pact of EU
Uttar Pradesh 43.5
Tripura 42.2
Tamil Nadu 25.5
Sikkim 80.6
Rajasthan 41.1
Punjab 35.2
Orissa 30.6
Nagaland 59.4
Mizoram 109.1
Meghalya 37.3
Manipur 77.4
Maharashtra 25.1
Madhya Pradesh 34.4
Kerala 34.3
Karnataka 24.3
Jharkhand 33.6
Jammu & Kashmir 70.1
Himachal 55.7
Haryana 19
Gujarat 32.1
Goa 35.5
Delhi 13.8 Prescribed limit according
Chattisgarh 15.2 to WTO for developing
Bihar 39.7 economies
Assam 28
Arunachal 115.9
Andhra 30.1
0 20 40 60 80 100 120
Source: Institute for Competitiveness Analysis, Data as of 2010
32. RURAL POPULATION VERSUS RURAL POPULATION GROWTH RATES
4.000
Meghalaya
Arunachal Pradesh Bihar
Mizoram Manipur Jammu & Kashmir Jharkhand Rajasthan
Chhattisgarh Madhya Pradesh Uttar Pradesh
2.000 Assam
Himachal Pradesh
Uttarakhand Orissa Maharashtra
Haryana Gujarat
Punjab KarnatakaBengal
West
Tamil Nadu
Tripura
Andhra Pradesh
0.000 Sikkim
10 100 1,000 10,000 100,000 1,000,000
Growth rate (CAGR 2001-2011)
Nagaland
Goa Thousands
-2.000
Kerala
-4.000
-6.000
Delhi
-8.000
-10.000
Population in Rural areas as per census (provisional Data) in Thousands
Source: Census 2011, Institute for Competitiveness Analysis
33. URBAN POPULATION VERSUS URBAN POPULATION GROWTH RATES
12
Sikkim
10
Growth rate (CAGR 2001-2011)
8
Kerala
Tripura
6
Nagaland
Haryana
4 Manipur
Uttarakhand
Chhattisgarh
Jammu & Kashmir Bihar Andhra Pradesh
Gujarat
Arunachal Pradesh Jharkhand
Goa
Meghalaya Karnataka
Assam Orissa Rajasthan Uttar Pradesh
Mizoram Delhi Madhya Pradesh Tamil Nadu
Punjab West Bengal
Maharashtra
2
Himachal Pradesh
0
0 10000 20000 30000 40000 50000 60000
Thousands
Population in Urban areas as per census (provisional Data) in Thousands
Source: Census 2011, Institute for Competitiveness Analysis
34. 100,000,000
120,000,000
140,000,000
160,000,000
20,000,000
40,000,000
60,000,000
80,000,000
0
151,726
455,962
561,977
529037
313,446
1069165
906,309
551414
573,741
1406861
822,132
1899624
595,036
2368971
960,981
2,710,051
688,704
6167805
3,091,169
7,025,583
3,414,106
Source: Census 2011, Institute for Competitiveness Analysis
9134820
16,333,916
419319
8,821,588
Urban Population in 2011
16531493
5,936,538
19603658
10,387,436
RURAL AND URBAN POPULATION IN INDIA
17,316,800
4,388,756
26780516
7,929,292
25,036,946
15,932,171
17455506
6,996,124
Rural Population in 2011
34,951,234
25,712,811
34670817
23,578,175
37552529
17,080,776
51,540,236
34,949,729
37,189,229
20,059,666
52537899
28,353,745
56311788
29,134,060
62,213,676
11,729,609
92075028
50,827,531
61545441
44,470,455
155,111,022
35. DEMOGRAPHIC PROFILE IN MANIPUR
80000
68998
67442
63553
70000
61677
60000
52618
51657
Population in Numbers
49278
45526
50000
39761
34499
40000
28139
30000
21779
16014
20000
11164
8099
5674
5125
10000
0
0-4 5-9 10-14 15-19 20-24 25-29 30-34 35-39 40-44 45-49 50-54 55-59 60-64 65-69 70-74 75-79 80+
years years years years years years years years years years years year years years years years years
Source: Institute for Competitiveness Analysis
36. RURAL URBAN AND TOTAL POPULATION
120
Delhi
Urban Population as a percentage of total Population
100 All India Average
India
67.02%
All
80
Goa
Tamil Nadu
Maharashtra
60 Kerala
Mizoram Gujarat
Karnataka
All India Average Punjab Pradesh
Andhra Bengal
West
Haryana
32.98% MadhyaUttar Pradesh
Pradesh
40 Rajasthan
Uttarakhand
Manipur
Jammu & Kashmir
Jharkhand
Nagaland
Chhattisgarh
Tripura
Sikkim
Orissa
Arunachal Pradesh Bihar
Meghalaya
Assam
20
Himachal Pradesh
0
-20 0 20 40 60 80 100 120
-20
Rural Population as a percentage of total Population
Source: Census 2011, Institute for Competitiveness Analysis
37. SEX RATIO VERSUS SEX RATIO GROWTH RATES
0.8
Delhi
0.7
0.6 All India Average 940
India
females/1000 males Mizoram
All
0.5
Nagaland
0.4 Arunachal Pradesh
Goa
CAGR growth rate 2001-11
All India Average Punjab
Kerela
0.3
0.169% CAGR Haryana
Assam
0.2 Sikkim Meghalaya
Tripura
Madhya Pradesh
WestAndhra Pradesh
Bengal
Uttar Pradesh Manipur
Himachal Pradesh
Rajasthan Tamil Nadu
Jharkhand
0.1 Maharashtra
Orissa
Karnataka
Chattisgarh
Uttarakhand
Gujarat
0
0 200 400 600 800 Bihar
1000 1200
-0.1
Jammu and Kashmir
-0.2
-0.3
Sex ratio
Source: Census 2011, Institute for Competitiveness Analysis