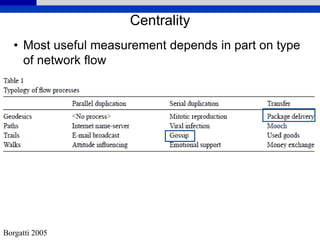
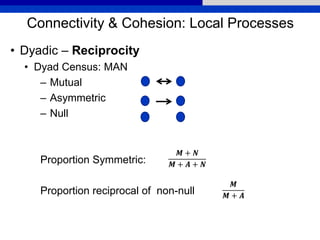
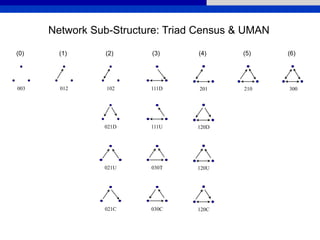
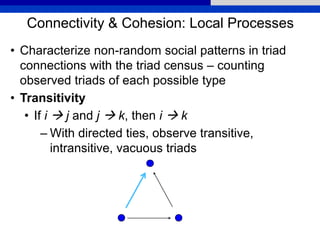
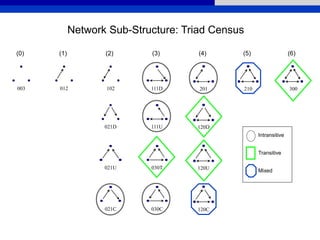
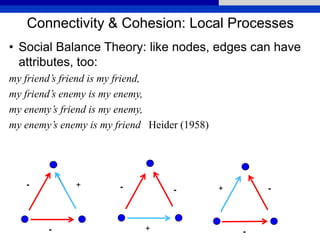
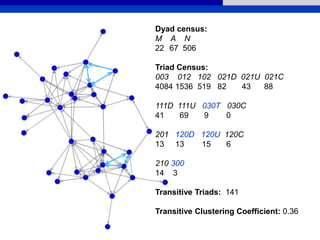
This document provides an overview of various measures for describing whole networks and individual nodes within networks. It discusses centrality measures like degree, closeness, betweenness, and power centrality. It also covers connectivity and cohesion measures like reciprocity, triad census, transitivity, clustering coefficient, and structural cohesion. The document uses examples from social networks to illustrate different measures and their implications for diffusion and information flow.


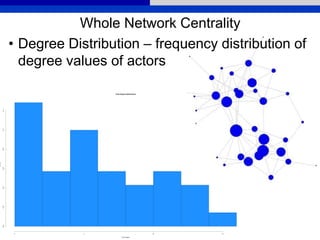
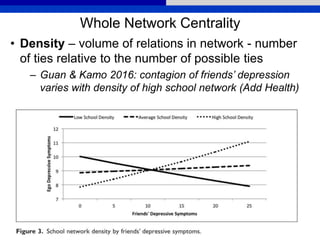
![Whole Network Centrality
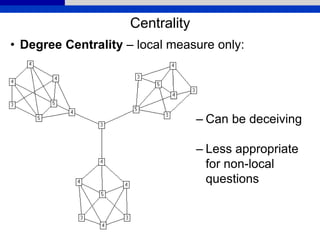
• Centralization – extent to which centrality is
concentrated in one/few actors; dispersion of
centrality in graph as a whole (Freeman
centralization)
)]2)(1[(
)()(1
*
gg
nCnC
C
g
i iDD
D](https://image.slidesharecdn.com/copelandsnhworkshop2018-180727184607/85/05-Whole-Network-Descriptive-Stats-41-320.jpg)


![谷歌留痕技术 [ 𝙩𝙤𝙥 𝟮𝟯𝟯. 𝙘 𝙤𝙢 ]](https://cdn.slidesharecdn.com/ss_thumbnails/top233-260130174328-3833018c-thumbnail.jpg?width=640&height=640&fit=bounds)


