Graphic Organizers.pdf

graphic organizer I. What’s a graphic organizer? A. They are a “picture” of information. 1. They use boxes, circles, arrows or other shapes to show how ideas are related. B. They organize facts, ideas or information in a logical way. C. They show how information is connected. II. Why should teachers use graphic organizers? A. To make it easier to understand information from a text or presentation. B. To make learners analyze, process and organize information. C. They can be used as a basis for re-telling a text or writing a composition or essay. D. They be use to connect learners’ background information with new information they learn in class. III. When can teachers use graphic organizers? A. As a preparation or practice activity. B. To help learners organize their ideas before writing. C. An in/complete organizer can help learners predict or prepare for a presentation or lecture. D. To explain a new grammar structure. E. To review or expand new vocabulary words. F. After a reading text or teacher presentation. G. To help learners plan a task and identify priorities. IV. What are some types of graphic organizers? A. Different graphic organizers represent different types of information: B. Venn diagrams 1. Show the differences and similarities between two or three things. C. A mind map or concept map 1. Organizes information into categories. 2. It shows main ideas and supporting details. 3. A mind map can represent many layers of information. D. A fishbone map 1. Shows causes of a problem and the details of each cause. E. A Frayer model 1. Learners must think about what is and isn’t connected with a concept. F. A cause and effect diagram 1. Represents steps in a process, from the first causes to final results. 2. Can also be used to show problems and solutions. G. Spider maps 1. Show main ideas or categories and one layer of details. H. A compare and contrast table 1. Compares two or more things in specific categories. I. A cluster 1. Often used when brainstorming. 2. It records the information connected with a topic, but doesn’t organize it. J. A timeline 1. Shows important events in a life, or steps in a project or process. 2. A timeline is often used to record historical events or biographies. K. A KWL chart 1. Learners record what they already know about the topic (K), and what they want to know about the topic (W). After reading or listening they record what they’ve learned about the topic (L). 2. Learners can add a column for information that contradicts what they had thought about the topic previously. 3. Learners may also add a column for how they learned the information (H) if they are completing the chart at the end of a chapter or unit. 4. Can be used before and after a reading text or presentation. 5. KWL charts are also good preparation for doing research on a topic. L. Trees 1. Divide information into categories and sub-categories and finally into supporting details. M. Semantic maps 1. Record new vocabulary connecte

Recommended
Recommended
More Related Content
What's hot
What's hot (20)
Similar to Graphic Organizers.pdf
Similar to Graphic Organizers.pdf (20)
More from Mr Bounab Samir
More from Mr Bounab Samir (20)
Recently uploaded
Recently uploaded (20)
Graphic Organizers.pdf
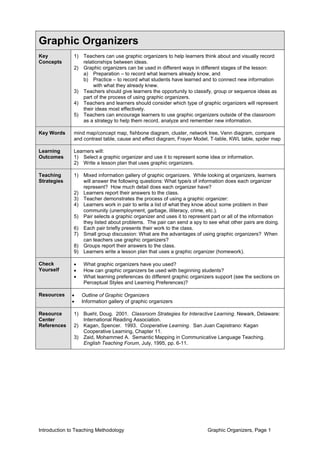
- 1. Introduction to Teaching Methodology Graphic Organizers, Page 1 Graphic Organizers Key Concepts 1) Teachers can use graphic organizers to help learners think about and visually record relationships between ideas. 2) Graphic organizers can be used in different ways in different stages of the lesson: a) Preparation – to record what learners already know, and b) Practice – to record what students have learned and to connect new information with what they already knew. 3) Teachers should give learners the opportunity to classify, group or sequence ideas as part of the process of using graphic organizers. 4) Teachers and learners should consider which type of graphic organizers will represent their ideas most effectively. 5) Teachers can encourage learners to use graphic organizers outside of the classroom as a strategy to help them record, analyze and remember new information. Key Words mind map/concept map, fishbone diagram, cluster, network tree, Venn diagram, compare and contrast table, cause and effect diagram, Frayer Model, T-table, KWL table, spider map Learning Outcomes Learners will: 1) Select a graphic organizer and use it to represent some idea or information. 2) Write a lesson plan that uses graphic organizers. Teaching Strategies 1) Mixed information gallery of graphic organizers. While looking at organizers, learners will answer the following questions: What type/s of information does each organizer represent? How much detail does each organizer have? 2) Learners report their answers to the class. 3) Teacher demonstrates the process of using a graphic organizer: 4) Learners work in pair to write a list of what they know about some problem in their community (unemployment, garbage, illiteracy, crime, etc.). 5) Pair selects a graphic organizer and uses it to represent part or all of the information they listed about problems. The pair can send a spy to see what other pairs are doing. 6) Each pair briefly presents their work to the class. 7) Small group discussion: What are the advantages of using graphic organizers? When can teachers use graphic organizers? 8) Groups report their answers to the class. 9) Learners write a lesson plan that uses a graphic organizer (homework). Check Yourself What graphic organizers have you used? How can graphic organizers be used with beginning students? What learning preferences do different graphic organizers support (see the sections on Perceptual Styles and Learning Preferences)? Resources Outline of Graphic Organizers Information gallery of graphic organizers Resource Center References 1) Buehl, Doug. 2001. Classroom Strategies for Interactive Learning. Newark, Delaware: International Reading Association. 2) Kagan, Spencer. 1993. Cooperative Learning. San Juan Capistrano: Kagan Cooperative Learning, Chapter 11. 3) Zaid, Mohammed A. Semantic Mapping in Communicative Language Teaching. English Teaching Forum, July, 1995, pp. 6-11.
- 2. Introduction to Teaching Methodology Graphic Organizers, Page 2 Outline of Graphic Organizers I. What’s a graphic organizer? A. They are a “picture” of information. 1. They use boxes, circles, arrows or other shapes to show how ideas are related. B. They organize facts, ideas or information in a logical way. C. They show how information is connected. II. Why should teachers use graphic organizers? A. To make it easier to understand information from a text or presentation. B. To make learners analyze, process and organize information. C. They can be used as a basis for re-telling a text or writing a composition or essay. D. They be use to connect learners’ background information with new information they learn in class. III. When can teachers use graphic organizers? A. As a preparation or practice activity. B. To help learners organize their ideas before writing. C. An in/complete organizer can help learners predict or prepare for a presentation or lecture. D. To explain a new grammar structure. E. To review or expand new vocabulary words. F. After a reading text or teacher presentation. G. To help learners plan a task and identify priorities. IV. What are some types of graphic organizers? A. Different graphic organizers represent different types of information: B. Venn diagrams 1. Show the differences and similarities between two or three things. C. A mind map or concept map 1. Organizes information into categories. 2. It shows main ideas and supporting details. 3. A mind map can represent many layers of information. D. A fishbone map 1. Shows causes of a problem and the details of each cause. E. A Frayer model 1. Learners must think about what is and isn’t connected with a concept. F. A cause and effect diagram 1. Represents steps in a process, from the first causes to final results. 2. Can also be used to show problems and solutions. G. Spider maps 1. Show main ideas or categories and one layer of details. H. A compare and contrast table 1. Compares two or more things in specific categories. I. A cluster 1. Often used when brainstorming. 2. It records the information connected with a topic, but doesn’t organize it. J. A timeline 1. Shows important events in a life, or steps in a project or process. 2. A timeline is often used to record historical events or biographies. K. A KWL chart 1. Learners record what they already know about the topic (K), and what they want to know about the topic (W). After reading or listening they record what they’ve learned about the topic (L). 2. Learners can add a column for information that contradicts what they had thought about the topic previously. 3. Learners may also add a column for how they learned the information (H) if they are completing the chart at the end of a chapter or unit. 4. Can be used before and after a reading text or presentation. 5. KWL charts are also good preparation for doing research on a topic. L. Trees 1. Divide information into categories and sub-categories and finally into supporting details. M. Semantic maps 1. Record new vocabulary connected with a theme. 2. A semantic map can organize types of words. N. A T-table 1. Compares two things in the form of a table.
- 3. Introduction to Teaching Methodology Graphic Organizers, Page 3 Both • Belong to cat family • Wash themselves with their tongues. • Have sharp claws and teeth. • Eat meat Lions • Are wild. • Have manes. • Live together in families. • Lionesses hunt for food. • Live in Africa, India Cats • Are domestic. • Usually don’t live with other cats. • Both males and females hunt for food (or eat what people give them). • Probably came from Egypt originally Venn Diagram T-Table The Left Hemisphere of the Brain The Right Hemisphere of the Brain science, math art, music, poetry logical, makes decisions based on facts intuitive, makes decisions based on feelings likes to look at the parts or steps of information likes to look at the whole idea or process controls the right side of the body – left brained people are right-handed controls the left side of the body – most, but not all, right brained people are left- handed reasoning and logic creativity and imagination good at spoken and written language good at seeing shapes and relationships between things good at putting things in order good at seeing the relationship between things. doesn’t identify or deal with emotions very well good at recognizing and understanding emotions KWL Chart What you know about lions? (before reading) What do you want to know about lions? (before reading) What have you learned about lions? (after reading) Lions live in Africa. Lions eat meat. Lions look like cats. Lions have big teeth. Lions have a lot of hair around their face. Did lions ever live in here? How much does a lion weigh? How long do lions live? Do lions eat people? How many babies do lions have?
- 4. Introduction to Teaching Methodology Graphic Organizers, Page 4 factories refrigerators air conditioning I n c r e a s e d C F C s ( c h l o r o f l u o r o c a r b o n s ) i n a t m o s p h e r e transportation I n c r e a s e d c a r b o n d i o x i d e ( C 0 2 ) i n a t m o s p h e r e factories fertilizers I n c r e a s e d n i t r o u s o x i d e ( N 2 O ) i n a t m o s p h e r e cows, sheep, pigs rice growing factories I n c r e a s e d m e t h a n e ( C H 4 ) I n a t m o s p h e r e burning forests Global Warming Fishbone Diagram Cause and Effect Diagram many cars traffic pollution + carbon monoxide (CO2) goes into atmosphere makes smog (smoke + fog) in cities and near cities contributes to global warming creates health problems for many people mixes with clouds can't see sun, moon, stars climate changes: hotter or colder makes acid rain food won’t grow where it did before ecosystems are negatively affected glaciers melt too quickly damages buildings and statues some areas become deserts animals die sea level rises and floods coastal areas
- 5. Introduction to Teaching Methodology Graphic Organizers, Page 5 Body Parts Age and Sex fur – animal hair claws – sharp “fingernails” fangs – sharp teeth in front of mouth mane – fur around male’s head lioness – female lion cub – baby lion savannah – a flat plain where only grass grows roar – the sound a lion makes pride – a group of lions living together prey – all the animals that lions or other animals eat Where and How they Live Lions Mind Map/Concept Map Semantic Map
- 6. Introduction to Teaching Methodology Graphic Organizers, Page 6 THOUSANDS OF ANIMALS BECOME EXTINCT EVERY YEAR Tree tiger more food use pesticides fertilizer more trees, metal, petroleum NATURAL CAUSES climate change disease HUMAN CAUSES Increasing population more resources needed more money hunt animals for money elephants more pollution rhinoceros chemicals get in water animals die plant food on animals’ habitat too hot or cold for animals animals lose habitat global warming cut trees, build mines animals die animals die kills plants and animals large animals eat
- 7. Introduction to Teaching Methodology Graphic Organizers, Page 7 Frayer Model Essential Characteristics Warm-blooded Feed milk to their babies Have hair on their bodies Well developed brain Have some of kind of “arms” and “legs” Parents take care of young Nonessential Characteristics Where they live What they eat How big they are What color they are Domestic or wild How long they live Examples People Monkey Bat Dolphin Kangaroo Whale Mice Giraffe Bear Dogs Non Examples Snakes Birds Fish Butterflies Turtles Penguins Plants Trees Shark Duck Cluster botany astronomy physics chemistry astronomy geology biology anatomy meteorology physiology ecology climatology Sciences sciences Mammals
- 8. Introduction to Teaching Methodology Graphic Organizers, Page 8 Spider Map long multi-use trunk Ivory tusks (really teeth) Elephants Big teeth Physical Appearance 3-4 m tall, 7000 kgs Thick sensitive skin G r o u p s p r o t e c t b a b i e s C o m m u n i c a t e L i v e i n g r o u p s o f 5 - 3 0 A d u l t f e m a l e s l e a d g r o u p A d u l t m a l e s l i v e a p a r t Social Structure S h o t t o p r o t e c t f o o d c r o p s K i l l e d f o r m e a t K i l l e d f o r i v o r y t u s k s H u m a n l i v e o n h a b i t a t P ro b le m s Africa, south of Sahara India and South Asia In prehistoric times lived everywhere but Antarctic and Australia R a n g e W alk 6.5 k/hour C an swim R un 40 k/hour C an’t jum p G raceful Movement
- 9. Introduction to Teaching Methodology Graphic Organizers, Page 9 Timeline/Albert Einstein Albert Einstein was born in Germany Age 3 Teaches himself Euclidean geometry. 1900-1902 Marries (later divorced, remarried) . 1905 Begins to work at the university. 1916 Wins Nobel Prize for Physics. 1933 Suggests creation of atomic bomb to Franklin Roosevelt. April 19, 1955 March 4, 1879 Began to talk. Age 12. Graduates from Polytechnic Institute. Works in government office. 1903 Doctorate from University of Zurich. Begins to write scientific papers. 1909 General Theory of Relativity published E = mc2 1921 Emigrates to the United States to avoid the Nazis. 1939 Dies. Compare and Contrast Table Mammals Birds Reptiles Examples? people, cats, dogs, dolphins, cows, sheep, bear, wolf, whales chicken, penguin, eagle, robin, turkey snakes, lizards, crocodiles, alligators, turtles Blood? warm-blooded warm-blooded cold-blooded Teeth? yes no sometimes Eat? meat, plants meat, plants meat, plants Live in? anyplace – from the Arctic to the Antarctic anyplace – from the Arctic to the Antarctic warm places (they depend on climate to stay warm) Body structure? arms, legs (dolphins and whales use their “arms” and “legs” for swimming) wings and legs (penguins use their “wings” for swimming) arms and legs (snakes have bones for arms and legs inside their body) Related to? gorillas, chimpanzees, orangutans reptiles, dinosaurs bird, dinosaurs Young? born as babies born as eggs born as eggs