Q1 2018 | Woodlands Office | Submarket Snapshot
•
1 like•40 views

The Woodlands' office submarket snapshot

Recommended
Recommended
More Related Content
What's hot
What's hot (20)
Similar to Q1 2018 | Woodlands Office | Submarket Snapshot
Similar to Q1 2018 | Woodlands Office | Submarket Snapshot (20)
More from Colliers International | Houston
More from Colliers International | Houston (20)
Recently uploaded
Recently uploaded (20)
Q1 2018 | Woodlands Office | Submarket Snapshot
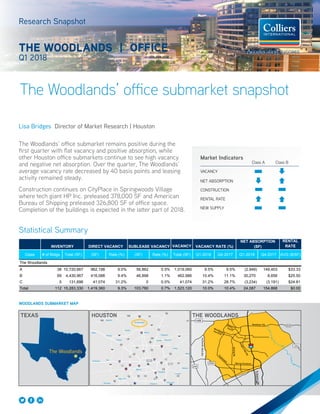
- 1. Market Indicators Class A Class B VACANCY NET ABSORPTION CONSTRUCTION RENTAL RATE NEW SUPPLY The Woodlands Galveston Bay 225Bellaire The Woodlands Humble Pasadena IAH EFD HOU Cypress Tomball Katy Brookshire Lake Houston La Porte 146 League City Kingwood Atascocita Spring Pearland 35 35 Richmond Waller Hockley 242 1488 1488 Conroe Magnolia Willis Lake Conroe Crosby CBD Ship Channel Clear Lake Baytown Mont Belvieu Dayton 149 149 Cleveland 105 105 105 321 330 Alvin Hitchcock Texas City Sugar Land The Woodlands’ office submarket snapshot Research Snapshot THE WOODLANDS | OFFICE Q1 2018 Statistical Summary 1488 2920 249 1314 242 Huffsmith-Kohrville WoodlandsParkway ResearchForest Needham Rd. Grogan’sMillRd. Spring Stuebner GoslingRd. Kuykendahl ToHoustonCBD WOODLANDS SUBMARKET MAP VACANCY RENTAL RATE Class # of Bldgs. Total (SF) (SF) Rate (%) (SF) Rate (%) Total (SF) Q1-2018 Q4-2017 Q1-2018 Q4-2017 AVG ($/SF) The Woodlands A 38 10,720,667 962,198 9.0% 56,862 0.5% 1,019,060 9.5% 9.5% (2,949) 149,403 $33.33 B 69 4,430,967 416,088 9.4% 46,898 1.1% 462,986 10.4% 11.1% 30,270 8,656 $25.50 C 5 131,696 41,074 31.2% 0 0.0% 41,074 31.2% 28.7% (3,234) (3,191) $24.81 Total 112 15,283,330 1,419,360 9.3% 103,760 0.7% 1,523,120 10.0% 10.4% 24,087 154,868 $0.00 INVENTORY DIRECT VACANCY SUBLEASE VACANCY VACANCY RATE (%) NET ABSORPTION (SF) The Woodlands’ office submarket remains positive during the first quarter with flat vacancy and positive absorption, while other Houston office submarkets continue to see high vacancy and negative net absorption. Over the quarter, The Woodlands’ average vacancy rate decreased by 40 basis points and leasing activity remained steady. Construction continues on CityPlace in Springwoods Village where tech giant HP Inc. preleased 378,000 SF and American Bureau of Shipping preleased 326,800 SF of office space. Completion of the buildings is expected in the latter part of 2018. Lisa Bridges Director of Market Research | Houston HOUSTONTEXAS THE WOODLANDS
- 2. 2 The Woodlands Research Snapshot | Q1 2018 | Office | Colliers International2 The average quoted rental rates are a mix of direct and sublet rates and are based on a blend of gross and NNN. The graphs below are only intended to show rental rate trends. Actual gross rates are higher than the average rate shown in the graph. 0.0 2.0 4.0 6.0 8.0 10.0 12.0 14.0 16.0 18.0 $18.00 $19.00 $20.00 $21.00 $22.00 $23.00 $24.00 $25.00 $26.00 $27.00 $28.00 Class B Rental Rate and Vacancy Percentage The Woodlands, TX Class B Rents Class B Vacancy *Vacancy percentage includes direct and sublease space. 0 50,000 100,000 150,000 200,000 250,000 300,000 350,000 Available Sublease Space - The Woodlands Class A Class B Available Sublease Space Q1 2018 Class A: 104,749 SF or 0.9% Class B: 86,184 SF or 1.9% 0.0 2.0 4.0 6.0 8.0 10.0 12.0 14.0 16.0 18.0 $25.00 $27.00 $29.00 $31.00 $33.00 $35.00 $37.00 $39.00 Class A Rental Rate and Vacancy Percentage The Woodlands, TX Class A Rents Class A Vacancy *Vacancy percentage includes direct and sublease space.
- 3. 3 North American Research & Forecast Report | Q4 2014 | Office Market Outlook | Colliers International Copyright © 2015 Colliers International. The information contained herein has been obtained from sources deemed reliable. While every reasonable effort has been made to ensure its accuracy, we cannot guarantee it. No responsibility is assumed for any inaccuracies. Readers are encouraged to consult their professional advisors prior to acting on any of the material contained in this report. Colliers International | Market 000 Address, Suite # 000 Address, Suite # +1 000 000 0000 colliers.com/<<market>> FOR MORE INFORMATION Lisa Bridges Director of Market Research | Houston +1 713 830 2125 lisa.bridges@colliers.com 3 North American Research & Forecast Report | Q4 2014 | Office Market Outlook | Colliers International Copyright © 2015 Colliers International. The information contained herein has been obtained from sources deemed reliable. While every reasonable effort has been made to ensure its accuracy, we cannot guarantee it. No responsibility is assumed for any inaccuracies. Readers are encouraged to consult their professional advisors prior to acting on any of the material contained in this report. Colliers International | Market 000 Address, Suite # 000 Address, Suite # +1 000 000 0000 colliers.com/<<market>> 3 North American Research & Forecast Report | Q4 2014 | Office Market Outlook | Colliers International Copyright © 2018 Colliers International. The information contained herein has been obtained from sources deemed reliable. While every reasonable effort has been made to ensure its accuracy, we cannot guarantee it. No responsibility is assumed for any inaccuracies. Readers are encouraged to consult their professional advisors prior to acting on any of the material contained in this report. Colliers International | The Woodlands 1790 Hughes Landing Blvd., Suite 250 The Woodlands, TX 77380 +1 713 830 4011 colliers.com/thewoodlands Absorption and New Supply Woodlands Class A Office Woodlands Class B Office -200,000 0 200,000 400,000 600,000 800,000 1,000,000 1,200,000 1,400,000 1,600,000 1,800,000 2,000,000 Net Absorption New Supply -150,000 -100,000 -50,000 0 50,000 100,000 150,000 200,000 Net Absorption New Supply