Q1 2022 Austin Industrial Report
•
0 likes•59 views

The first quarter in the Austin industrial market continued what were well-established trends at the end of 2021.

Recommended
Recommended
More Related Content
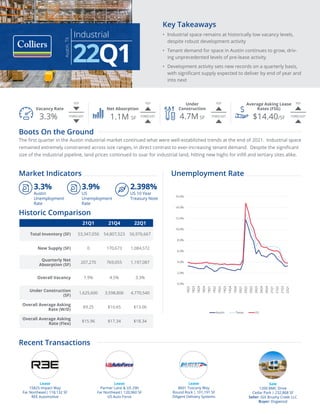
Similar to Q1 2022 Austin Industrial Report
Similar to Q1 2022 Austin Industrial Report (20)
More from Colliers International | Houston
More from Colliers International | Houston (20)
Recently uploaded
Recently uploaded (20)
Q1 2022 Austin Industrial Report
- 1. 21Q1 21Q4 22Q1 Total Inventory (SF) 53,347,050 54,807,523 56,976,667 New Supply (SF) 0 170,673 1,084,572 Quarterly Net Absorption (SF) 207,270 769,055 1,197,087 Overall Vacancy 7.9% 4.5% 3.3% Under Construction (SF) 1,625,600 3,598,806 4,770,540 Overall Average Asking Rate (W/D) $9.25 $10.65 $13.06 Overall Average Asking Rate (Flex) $15.96 $17.34 $18.34 Lease 15825 Impact Way Far Northeast| 118,132 SF REE Automotive Sale 1200 BMC Drive Cedar Park | 232,868 SF Seller: IGX Brushy Creek LLC Buyer: Dogwood Lease 8601 Tuscany Way Round Rock | 101,191 SF Diligent Delivery Systems YOY FORECAST YOY YOY FORECAST YOY FORECAST FORECAST Industrial Austin, TX 22Q1 Lease Parmer Lane & US 290 Far Northeast| 120,960 SF US Auto Force Boots On the Ground The first quarter in the Austin industrial market continued what were well-established trends at the end of 2021. Industrial space remained extremely constrained across size ranges, in direct contrast to ever-increasing tenant demand. Despite the significant size of the industrial pipeline, land prices continued to soar for industrial land, hitting new highs for infill and tertiary sites alike. Unemployment Rate Market Indicators Historic Comparison 3.3% Austin Unemployment Rate 2.398% US 10 Year Treasury Note 3.9% US Unemployment Rate Vacancy Rate 3.3% Net Absorption 1.1M SF Average Asking Lease Rates (FSG) $14.40/SF Under Construction 4.7M SF Key Takeaways • Industrial space remains at historically low vacancy levels, despite robust development activity • Tenant demand for space in Austin continues to grow, driv- ing unprecedented levels of pre-lease activity • Development activity sets new records on a quarterly basis, with significant supply expected to deliver by end of year and into next Recent Transactions 0.0% 2.0% 4.0% 6.0% 8.0% 10.0% 12.0% 14.0% 16.0% 18Q2 18Q3 18Q4 18Q4 19Q1 19Q2 19Q2 19Q3 19Q4 19Q4 20Q1 20Q2 20Q2 20Q3 20Q4 20Q4 21Q1 21Q2 21Q3 22Q1 Austin Texas US
- 2. Colliers | Austin | 22Q1 | Industrial Report Industrial Austin, TX 22Q1 Absorption, Supply & Demand 0.0% 4.0% 8.0% 12.0% (200,000) 0 200,000 400,000 600,000 800,000 1,000,000 1,200,000 1,400,000 Q1 2021 Q2 2021 Q3 2021 Q4 2021 Q1 2022 Net Absorption Completions Vacancy Rate Future Forecast Austin has long been an under served industrial market, and it appears that the continued growth of tenant demand coupled with exuberant developer appetite is ready to make a significant push towards right-sizing the market. We anticipate the existing imbalance of supply and demand will continue pushing rents higher until the slated deliveries towards the end of 2022 and into 2023 can significantly outpace pre-lease activity. Even then, with construction costs, inflation and interest rates all rising in lockstep with demand, we may see a tempering in the pace of rent growth, but the runway in Austin appears to get longer with every passing day. The Market, at a Glance It wasn’t long ago that areas like Georgetown and San Marcos were considered too pioneering for spec industrial development, which is surprising given the rapid pace of land acquisitions in these areas. As Austin land pricing pushes ever-higher (and its population ever-outward), the Williamson County and Hays County submarkets are poised to be the beneficiaries. Whereas at this time last year there were less than a handful of spec industrial projects underway in Georgetown and San Marcos, these cities now represent two of the fastest-growing areas in the Austin market. Georgetown in particular represents more than 10 million square feet of the industrial pipeline, which itself has grown to more than 35 million square feet. This incredible amount of development under construction and planned is in direct response to rapid population growth and significantly higher tenant demand than the market has ever seen, and neither trend appears to be slowing. Importantly, the market of tenants seeking more than 100,000 SF continues to offer healthy pre-lease activity for many of the projects under construction. Largely missing from this equation, however, are the tenants at or below 50,000 SF, who have long been the backbone of the Austin industrial market. These incumbent tenants find themselves outgrowing their existing spaces en masse, while still being too small to meaningfully compete for space in buildings under construction. Furthermore, with most of the construction happening outside of Austin proper – more than 50% of the development pipeline falls outside of Travis County – many companies are weighing the opportunity to grow against making significant geographic changes to their operations. Tenant demand remains very strong in the Austin market, across size ranges. Coupled with an ever-growing number of tenant requirements from out of market, the incumbent tenant base in Austin remains active and many groups continue to outgrow their existing spaces. As the second-generation market continues to hover at historically low vacancy levels, both incumbent tenants in Austin and the new requirements to the market continue to support healthy pre-leasing activities, unlike we’ve seen in years past. Despite the significant size of the development pipeline, we anticipate the healthy pre- lease activity and extensive list of tenants searching for space will continue to drive absorption to new quarterly records throughout 2022, and likely into 2023, absent of any macroeconomic factors (rising interest rates, continued supply chain constraints) that may adversely temper tenant demand.
- 3. Colliers | Austin | 22Q1 | Industrial Report Industrial Austin, TX 22Q1 0 1,000,000 2,000,000 3,000,000 4,000,000 5,000,000 6,000,000 Under Construction Planned Proposed Upcoming Projects 300 Vista Ridge Drive 206,000 SF | Kyle Hays Logistics Center 2 | Hillwood |Q2 2022 2700 Louis Henna Boulevard 176,534 SF | Round Rock 45 Crossing | Eastgroup Properties | Q2 2022 NE Corner of I30 & Pecan Street 340,200 SF | Pflugerville 130 Crossing | Iron Development | Q2 2022 900 FM 972 409,822 SF | Georgetown GTX Logistics Park Green Point Property Group | Q3 2022 Speculative Development Pipeline
- 4. Copyright © 2022 Colliers The information contained herein has been obtained from sources deemed reliable. While every reasonable effort has been made to ensure its accuracy, we cannot guarantee it. No responsibility is assumed for any inaccuracies. Readers are encouraged to consult their professional advisors prior to acting on any of the material contained in this report. Kaitlin Holm Marketing & Research Coordinator Austin +1 512 539 3021 kaitlin.holm@colliers.com David Bremer, SIOR Managing Director Austin +1 512 539 3014 david.bremer@colliers.com FOR MORE INFORMATION Travis Hicks, SIOR Senior Vice President Austin +1 512 539 3005 travis.hicks@colliers.com Chase Clancy Vice President Austin +1 512 539 3023 chase.clancy@colliers.com Submarket Existing Inventory (SF) Direct Vacancy (SF) Sublease Vacancy (SF) Overall Vacancy Rate Quarterly Net Absorption (SF) Weighted Average Asking Rate Market Total Warehouse/Distribution 41,329,539 1,013,023 112,704 2.7% 1,150,011 $13.06 Office Service/Flex 15,647,128 698,915 66,907 4.9% 47,076 $18.34 TOTAL 56,976,667 1,711,938 179,611 3.3% 1,197,087 $14.40 Flex/Office Service Central 426,663 9,851 0 2.3% 3,250 $19.68 Cedar Park 675,428 86,704 0 12.8% (20,000) $16.77 East 1,172,298 57,169 0 4.9% 0 $28.00 Far Northeast 338,788 0 0 0.0% 3,750 $16.00 Far Northwest 134,875 4,600 0 3.4% 1,516 $16.50 Georgetown 216,236 0 0 0.0% 0 – Hays County 400,392 3,565 0 0.9% 12,525 – North 3,437,696 202,370 12,245 6.2% 22,553 $18.24 Northeast 3,327,463 220,721 0 6.6% (87,906) $15.81 Northwest 1,646,625 0 20,511 1.2% 10,995 $18.72 Round Rock 341,056 0 18,492 5.4% (18,492) $11.13 South 347,802 22,973 0 6.6% 15,872 $24.89 Southeast 3,011,352 90,962 15,659 3.5% 79,784 $15.16 Southwest 170,454 0 0 0.0% 23,229 – TOTAL 15,647,128 698,915 66,907 4.9% 47,076 $18.34 Austin | Q1 2022 | Industrial | Market Statistics Warehouse/Distribution Central 668,931 122,620 0 18.3% 8,630 $16.54 Cedar Park 106,632 6,800 0 6.4% 0 $12.00 East 2,040,937 27,511 0 1.3% 34,368 $11.58 Far Northeast 6,944,911 54,460 0 0.8% 21,794 $11.12 Far Northwest 397,685 0 0 0.0% 0 $12.00 Georgetown 1,843,710 197,600 100,504 16.2% (1,600) $7.23 Hays County 5,018,357 1,500 0 0.0% 879,928 $6.79 North 8,239,505 196,293 7,200 2.5% (130,067) $10.23 Northeast 3,656,686 84,508 0 2.3% 33,391 $11.50 Northwest 1,079,275 16,788 0 1.6% 0 – Round Rock 2,019,665 18,060 0 0.9% 20,681 $14.38 South 849,471 57,592 0 6.8% (11,192) $20.54 Southeast 8,376,769 229,291 5,000 2.8% 294,078 $12.64 Southwest 87,005 0 0 0.0% 0 – TOTAL 41,329,539 1,013,023 112,704 2.7% 1,150,011 $13.06