Q1 2022 Austin Office Market Report
•
0 likes•56 views

According to the document: - Office activity has picked up significantly in the past quarter, with demand focused on newer Class A space in the CBD, South Central, and East areas of Austin. This has driven up rental rates in these core areas. - Sublease space has received significant attention, with many subleases being occupied or nearing lease documentation. This allows tenants to avoid long construction timelines and realize substantial cost savings versus building out their own space. - Overall vacancy remained at 19.3% as net absorption was negative, but delivery of new supply also slowed, suggesting continued strong demand. Rental rates across Austin increased slightly but remained flat in suburban areas.

Recommended
Recommended
More Related Content
Similar to Q1 2022 Austin Office Market Report
Similar to Q1 2022 Austin Office Market Report (20)
More from Colliers International | Houston
More from Colliers International | Houston (20)
Recently uploaded
Recently uploaded (20)
Q1 2022 Austin Office Market Report
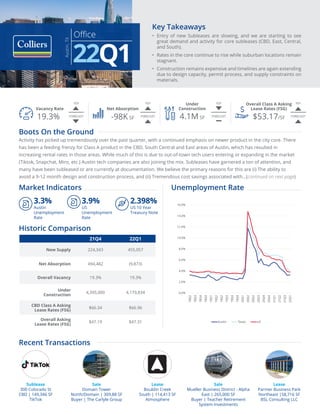
- 1. 21Q4 22Q1 New Supply 224,343 455,057 Net Absorption 494,482 (9,873) Overall Vacancy 19.3% 19.3% Under Construction 4,395,000 4,179,834 CBD Class A Asking Lease Rates (FSG) $66.34 $66.96 Overall Asking Lease Rates (FSG) $47.19 $47.31 Sublease 300 Colorado St CBD | 149,346 SF TikTok Sale Domain Tower North/Domain | 309,88 SF Buyer | The Carlyle Group Sale Mueller Business District - Alpha East | 265,000 SF Buyer | Teacher Retirement System Investments Lease Bouldin Creek South | 114,413 SF Atmosphere Lease Parmer Business Park Northeast |58,716 SF BSL Consulting LLC YOY FORECAST YOY YOY FORECAST YOY FORECAST FORECAST Office Austin, TX 22Q1 Boots On the Ground Activity has picked up tremendously over the past quarter, with a continued emphasis on newer product in the city core. There has been a feeding frenzy for Class A product in the CBD, South Central and East areas of Austin, which has resulted in increasing rental rates in those areas. While much of this is due to out-of-town tech users entering or expanding in the market (Tiktok, Snapchat, Miro, etc.) Austin tech companies are also joining the mix. Subleases have garnered a ton of attention, and many have been subleased or are currently at documentation. We believe the primary reasons for this are (i) The ability to avoid a 9-12 month design and construction process, and (ii) Tremendous cost savings associated with...(continued on next page) Unemployment Rate Market Indicators Historic Comparison 3.3% Austin Unemployment Rate 2.398% US 10 Year Treasury Note 3.9% US Unemployment Rate Vacancy Rate 19.3% Net Absorption -98K SF Overall Class A Asking Lease Rates (FSG) $53.17/SF Under Construction 4.1M SF Key Takeaways • Entry of new Subleases are slowing, and we are starting to see great demand and activity for core subleases (CBD, East, Central, and South). • Rates in the core continue to rise while suburban locations remain stagnant. • Construction remains expensive and timelines are again extending due to design capacity, permit process, and supply constraints on materials. Recent Transactions 0.0% 2.0% 4.0% 6.0% 8.0% 10.0% 12.0% 14.0% 16.0% 18Q2 18Q3 18Q4 18Q4 19Q1 19Q2 19Q2 19Q3 19Q4 19Q4 20Q1 20Q2 20Q2 20Q3 20Q4 20Q4 21Q1 21Q2 21Q3 22Q1 Austin Texas US
- 2. Colliers | Austin | 22Q1 | Office Report Office Austin, TX 22Q1 Sublease Environment 34% 6% 3% 5% 1% 3% 21% 1% 2% 0% 24% 0% CBD Central East North/Domain Northeast Far Northwest Northwest Round Rock South Southeast Southwest West Central 21Q1 21Q4 22Q1 CBD 791,981 745,866 601,019 Central 44,409 10,987 97,713 East 89,234 87,000 47,395 North/Domain 105,071 57,068 79,114 Northeast 119,636 74,130 23,048 Far Northwest 56,124 42,232 48,560 Northwest 516,968 376,622 369,006 Round Rock 17,271 14,475 14,475 South 35,909 21,599 28,301 Southeast 8,000 42,273 8,000 Southwest 354,202 314,520 421,162 West Central 21,048 0 2,903 TOTAL 2,159,853 1,786,772 1,740,696 Boots on the Ground continued The Market, at a Glance Austin remains one of the top performing markets in the country in just about every product type. Our updated “office deals in the market” list is extraordinarily robust. If half of those companies lease space, we’re in for a couple big-performing quarters. Industrial remains on fire, with most users having to take down space before its built. Capital markets transactions in general are improving but still not to a typical level. Forward selling (the concept of selling an approved project prior to breaking ground) is still active on industrial product, however pricing has moved down slightly due to increased cost of capital. Demand for leased product is still pushing very low cap rates, however. Future Forecast We’re tempted to copy and paste last quarter’s commentary, “It’s going to stay busy”. We believe demand is going to continue to increase. That may not be reflected in the immediate forthcoming vacancy rates due to new product being classified as delivered, however that’s to be expected. Average rates are likely to remain somewhat flat (core rates going up, but suburban markets remaining flat or in some instances, slightly decreasing). Sublease vacancy is likely to immediately trend down due to current “at sublease” deals, but then potentially go up as we are aware of multiple mid/large opportunities coming to the market in the 25K-80K RSF range. However, we’d consider the majority of these spaces as prime opportunities which will likely get subleased reasonably quickly. construction and furniture vs. traditional spaces. We believe this success will lead to more traditional landlords either white boxing or spec’ing out tired spaces for marketability. This activity has also been the catalyst for multiple new downtown projects breaking ground, ranging from 100K to over 700K RSF. Most of these buildings won’t deliver until 2024/2025 therefore conditions should remain somewhat favorable for Landlords in the short term. Many suburban markets remained depressed resulting in higher vacancy and lower effective rates, but activity is picking up. At some point many companies will be forced to consider product alternative to the core, due to pricing, parking or availability, which will likely be the catalyst for a resurgence of suburban markets.
- 3. Colliers | Austin | 22Q1 | Office Report Office Austin, TX 22Q1 10.0% 11.0% 12.0% 13.0% 14.0% 15.0% 16.0% 17.0% 18.0% 19.0% 20.0% $0.00 $10.00 $20.00 $30.00 $40.00 $50.00 $60.00 $70.00 Q4 2020 Q1 2021 Q2 2021 Q3 2021 Q4 2021 Q1 2022 CBD Citywide Total Vacancy Notable Q1 2022 Completions (1,000,000) (500,000) 0 500,000 1,000,000 1,500,000 2,000,000 Q1 2021 Q2 2021 Q3 2021 Q4 2021 Q1 2022 Deliveries Net Absorption RiverSouth 350,611 SF | South Stream Realty Partners, LP Domain Tower 2 332,200 SF | North/Domain Stonelake Capital Partners Return to Work As traffic accurately indicates, companies are beginning to reoccupy offices at a rapid pace. Austin occupancy levels began spiking in March and we’ve seen multiple reports stating that Austin leads the nation in employees returning to the office. Professional services lead the pack, however, tech is slowly beginning to join the trend. Approximately half of the subleases on the market are based on those companies determining that they will never fully reoccupy and prefer a flex model moving forward. We are also seeing many clients leasing space and finishing them out for flex work, which often includes more meeting and lounge space combined with less dense stationary seating. Direct Lease Rates Overall, rates continue to rise primarily bolstered by new Class A product delivering to the market. This is typical as new buildings range from asking rates of $36.00- $43.00 NNN in suburban submarkets while closer to $46.00-$50.00 NNN in the CBD and surrounding. The asking price delta is partially based on demand, however construction pricing has a definitive impact. Higher land prices combined with more expensive construction (i.e. below grade parking can run $40K per space to build) forces higher rates. Class B buildings, along with most suburban buildings (other than the Domain) have remained somewhat flat in terms of asking rates.
- 4. Colliers | Austin | 22Q1 | Office Report Office Austin, TX 22Q1 Upcoming Projects Citywide Construction 25% 75% East CBD Q2 2022 Expected Deliveries Uptown ATX - Block A Brandywine Realty Trust 374,739 SF | North/Domain Q3 2023 Delivery 2% Leased Centro - Northern Riverside Resources 165,337 SF | East Q2 2022 Delivery 0% Leased Victory Plaza Undisclosed 91,548 SF | Central Q3 2022 Delivery 0% Leased 1515 Undisclosed 71,632 SF |East Q4 2022 Delivery 0% Leased 0 500,000 1,000,000 1,500,000 2,000,000 2,500,000 3,000,000 3,500,000 4,000,000 4,500,000 5,000,000 Q2 2022 2022 2023 Leased Expected Deliveries
- 5. Copyright © 2022 Colliers The information contained herein has been obtained from sources deemed reliable. While every reasonable effort has been made to ensure its accuracy, we cannot guarantee it. No responsibility is assumed for any inaccuracies. Readers are encouraged to consult their professional advisors prior to acting on any of the material contained in this report. FOR MORE INFORMATION Kaitlin Holm Marketing & Research Coordinator Austin +1 512 539 3021 kaitlin.holm@colliers.com David Bremer, SIOR Managing Director Austin +1 512 539 3014 david.bremer@colliers.com Submarket Existing Inventory (SF) Direct Vacancy (SF) Sublease Vacancy (SF) Overall Vacancy Rate Quarterly Net Absorption (SF) Weighted Average Asking Rate Downtown CBD 13,535,540 1,847,470 601,019 18.1% 122,074 $62.91 TOTAL 13,535,540 1,847,470 601,019 18.1% 122,074 $62.91 Market Total CBD 13,535,540 1,847,470 601,019 18.1% 122,074 $62.91 Suburban 53,205,918 8,950,432 1,139,677 19.0% (131,947) $43.94 TOTAL 66,741,458 10,797,902 1,740,696 19.3% (9,873) $47.31 Suburban Central 2,724,629 479,863 97,713 21.2% 6,975 $48.91 East 3,643,084 1,003,279 47,395 28.8% 241,376 $57.61 North/Domain 7,712,526 934,941 79,114 13.1% (79,005) $41.14 Northeast 3,009,446 564,885 23,048 19.5% (14,397) $36.74 Far Northwest 3,743,465 289,806 48,560 9.0% (116,000) $40.91 Northwest 13,395,344 2,915,852 369,006 24.5% 31,367 $39.19 Round Rock 1,555,699 52,729 14,475 4.3% (111,600) $35.92 South 2,788,502 671,926 28,301 25.1% 151,051 $51.87 Southeast 3,320,175 445,903 8,000 13.7% (83,163) $35.16 Southwest 10,461,446 1,530,206 421,162 18.7% (173,151) $44.95 West Central 851,602 61,042 2,903 7.5% 14,600 $50.17 TOTAL 53,205,918 8,950,432 1,139,677 19.0% (131,947) $43.94 Austin | Q1 2022 | Office | Market Statistics