SlideShare a Scribd company logo
1 of 3
Research &
Forecast Report
AUSTIN | INDUSTRIAL
Q4 2020
It seems that we’re all ready to leave 2020 behind us. No year in recent memory has
so swiftly upended the mundane parts of our lives, leaving us to miss the boring parts
of “normal life” that we had once taken for granted.
Such monumental shifts in human behavior leveled incredible impacts on industrial
demand globally, while in Austin we are benefiting from an additional set of
extenuating factors that have drastically increased demand for industrial space.
E-Commerce and the Amazon Effect
With an accelerated shift in consumer purchasing to e-commerce platforms, we’ve
seen an explosion of demand from 3PLs and fulfillment companies looking to keep
up in 2020. This story would not be complete without mention of Amazon, whose
local share of industrial real estate continues to grow at a blistering pace. Closing
2019, Amazon boasted approximately 1.23M SF of space between San Marcos and
Georgetown. At the end of 2020, this has nearly quintupled to 6.08M SF of space
occupied or under construction and at least another 1M SF in construction planning.
These spaces include both spec leasing and build-to-suits like the 3.8M SF facility
currently under construction in Pflugerville. Most importantly, Amazon absorbed more
than 1M SF of shell space in the Austin market in 2020, which is an incredible sum
considering our total market-wide absorption was approximately 1.4M SF in 2019 and
1.8M SF in 2018.
Austin, the New Detroit
On top of the unique e-commerce demand we’ve seen this year, the announcement
of Tesla’s new Gigafactory, dubbed “Giga Texas,” in east Austin is already having
a profound impact on our market. The market is now awash with Tier 1 and Tier 2
suppliers all vying for Tesla-related contracts with extremely aggressive timelines. At
the end of 2020, however, few, if any have been awarded their contract and are able
to execute a lease. Not only are these requirements abundant in number, many of are
also strikingly large for the Austin market.
Further complicating the matter is that all of these come at a time when the market is extremely tight on big box availability. Many of these
suppliers need to be installing equipment no later than Q3 2021 to hit Tesla’s required milestones, though the current industrial pipeline only has
two new spec projects under construction with enough space that could hit these timelines. All of this has pushed developers to rapidly pursue
new developments to meet the need, despite many of the best-suited sites being subject to the city’s notoriously slow development process.
Small Boxes, Meet Big Tenants
In years past, and in many ways still today, the typical “bread-and-butter” Austin tenant was the plethora of 20,000-75,000 SF users that have
long populated Austin’s industrial space, but 2020 kicked off a rapid change that we expect to continue. While the bread-and-butter tenants largely
took a wait-and-see approach to COVID-19 in Q1 and Q2, we saw an immediate uptick in well-capitalized national groups descending on the area,
looking to take down the largest blocks of space the market had to offer. In fact, at one point in Q3, there were no second-generation blocks of
distribution space over 100,000 SF anywhere in the Austin market.
Boots On The Ground Commentary by Chase Clancy
Our “Boots on the ground” viewpoint is the voice of our experts, who have broken down the
market data and compared it to what they are seeing for themselves. This is their take on
what the numbers actually mean for the Austin industrial market.
1.13M SF
Q4 Net Absorption
1.45M SF
Under Construction
13.46M SF
Under Construction, Planned and Proposed
$10.70
Overall Average Asking Rate
7.3%
Overall Vacancy Rate
2.10M SF
Trailing 12 Month Net Absorption
455K SF
Q4 Deliveries
BY THE NUMBERS
Austin’s Industrial Market
AUSTIN | INDUSTRIAL | Q4 2020
While the market would previously see a handful of 100,000+ SF deals in a year, at the end of 2020 we have multiple 200,000-700,000 SF
requirements competing for space, with some companies kicking tires on 1M+ SF build to suits. Many, but not all of these supersized requirements
are tied to Tesla’s activities in the market, which we expect will continue to ignite demand for big boxes. Beyond the burgeoning automotive
manufacturing sector, however, there are other notably large requirements that will continue to place additional pressure on the supply of big
blocks of space.
The Great Land Grab of 2020
Staring down the barrel of fervent demand for at least the next few years, developers have sprung into action. At the end of 2020, there was
approximately 1.45M SF of spec industrial space under construction set to deliver in Q2-Q3 of 2021, with another 3.38M SF in the planning stages
set to deliver between Q4 2021 and Q3 2022. Behind that, many of these
projects have future phases totaling an additional 8.63M SF, while even more
developers hunt for land to plant their first – or next – flag in the Austin market.
The projects first set to deliver in 2021 are in Kyle to the south and Georgetown
to the north. In Kyle, the Plum Creek Industrial Center, developed by NorthPoint
Development, will provide 444,058 SF in its first phase which is set to deliver
in May of 2021. The project will be a best-in-class development showcasing the
next generation of building standards for the market, including 36’ clear heights
and heavy power in a 240’ deep rear-load design. NorthPoint Development
already has plans for the project’s second phase which promises to deliver an
additional 400,000-500,000 SF to the Hays County submarket.
To the north, NorthPark35 developed by Titan Development, represents the
northernmost reaches of spec development in the Austin market, and will serve
as a litmus test for the suitability of industrial product this far north. Titan has
already had success with pushing the goalposts of Austin’s market with the
development of the Innovation Business Park in Hutto, and they’ll have many
eyes watching their leasing velocity in Georgetown.
Behind these first deliveries in 2021, many of the spec projects currently in
the planning and site development phases are in the north and northeast
submarkets near the junction of Highway 290 and State Highway 130. Many
of these sites are a (15 minute) stone’s throw from Giga Texas, which will
continue to attract a supplier network that needs to be as close as possible.
That said, with nearly 6.4M SF of proposed product in this area, albeit in
multiple phases, the competition for tenants between Landlords promises to be
fierce.
Closing the Year
The 4th quarter caps off what will go down as one of the most interesting
and confounding years in decades. As the world crawls out of its bunkers
with COVID-19 vaccines in hand, Austin’s industrial market will surely
benefit from all of the aforementioned shots in the arm. Looking forward, we
anticipate continued, robust demand for industrial space, and continued, robust
development looking for its piece of the pie. Austin’s market seems to be on the precipice of “leveling up” from a smaller, local distribution and R&D
market to a true Tier 2 industrial market in Central Texas, and 2021 will undoubtedly set the tone.
This document has been prepared by Colliers International for advertising and general information only. Colliers International makes no guarantees, representations or warranties of any kind, expressed or implied, regarding the information including, b
Any interested party should undertake their own inquiries as to the accuracy of the information. Colliers International excludes unequivocally all inferred or implied terms, conditions and warranties arising out of this document and excludes all liabil
the copyrighted property of Colliers International and /or its licensor(s). © 2021. All rights reserved. Data source: ESRI, HERE, Garmin, FAO, NOAA, USGS, © OpenStreetMap. 1 inch represents 9.08 miles
This document has been prepared by Colliers International for advertising and general information only. Colliers International makes no guarantees, representations or warranties of an
Any interested party should undertake their own inquiries as to the accuracy of the information. Colliers International excludes unequivocally all inferred or implied terms, conditions
the copyrighted property of Colliers International and /or its licensor(s). © 2021. All rights reserved. Data source: ESRI, HERE, Garmin, FAO, NOAA, USGS, © OpenStreetMap. 1 inch represen
This document has been prepared by Colliers International for advertising and general information only. Collie
Any interested party should undertake their own inquiries as to the accuracy of the information. Colliers Intern
the copyrighted property of Colliers International and /or its licensor(s). © 2021. All rights reserved. Data source
Austin Economy Statistics
0%
3%
6%
9%
12%
15%
Austin US
750,000
1,000,000
1,250,000
1,500,000
AUSTIN UNEMPLOYMENT RATE VS. U.S. AUSTIN EMPLOYMENT
3 North American Research & Forecast Report | Q4 2014 | Office Market Outlook | Colliers International
Copyright © 2015 Colliers International.
The information contained herein has been obtained from sources deemed reliable. While
every reasonable effort has been made to ensure its accuracy, we cannot guarantee it. No
responsibility is assumed for any inaccuracies. Readers are encouraged to consult their
professional advisors prior to acting on any of the material contained in this report.
Colliers International | Market
000 Address, Suite #
+1 000 000 0000
colliers.com/<<market>>
3 North American Research & Forecast Report | Q4 2014 | Office Market Outlook | Colliers International
Copyright © 2021 Colliers International. The information contained herein has been obtained from sources deemed reliable. While every reasonable effort has been made to ensure its accuracy,
we cannot guarantee it. No responsibility is assumed for any inaccuracies. Readers are encouraged to consult their professional advisors prior to acting on any of the material contained in this
report.
RESEARCH CONTACT
John O’Sullivan
Research Associate | Austin
+1 512 539 3012
john.o’sullivan@colliers.com
BROKER CONTACTS
Travis Hicks
Vice President | Austin
+1 512 539 3005
travis.hicks@colliers.com
Chase Clancy
Associate Vice President | Austin
+1 512 539 3023
chase.clancy@colliers.com
AUSTIN | INDUSTRIAL | Q4 2020
Georgetown Far Northeast Southeast Hays County Northeast
NORTHEAST
1,612,477 SF
FAR NORTHEAST
1,522,149 SF
HAYS COUNTY
1,507,343 SF
SOUTHEAST
317,572 SF
GEORGETOWN
331,030 SF
18 MONTH PROJECTED DELIVERIES BY SUBMARKET
Speculative Development Pipeline (Multi-Phase)
Tuscany Logistics Center
Bldgs I, II & III
Available: Q3 2021
Submarket: Northeast
Size: 373,477 SF
NorthPark35
Bldgs I & II
Available: Q3 2021
Submarket: Georgetown
Size: 331,030 SF
Park 183
Bldgs III & V
Available: Q3 2021
Submarket: Southeast
Size: 317,572 SF
Plum Creek Industrial
Bldgs I & II
Available: Q2 2021
Submarket: Hays County
Size: 444,058 SF
SUBMARKET INVENTORY (SF)
DIRECT
VACANCY (SF)
SUBLEASE
VACANCY (SF)
OVERALL
VACANCY RATE
Q4 NET
ABSORPTION
(SF)
OVERALL
AVERAGE
ASKING
RATE(W/D)
OVERALL
AVERAGE
ASKING RATE
(FLEX)
Central 1,130,662 70,281 27,375 8.6% 13,143 $13.24 $13.90
East 3,847,237 284,236 27,412 8.1% 30,598 $9.97 –
Far Northeast 3,217,401 167,625 33,600 6.3% 92,790 $10.48 $17.07
Far Northwest 678,274 6,777 0 1.0% (31,921) $12.00 $14.26
Hays County 4,219,667 291,362 46,253 8.0% 66,825 $6.04 –
North 13,021,910 586,150 198,202 6.0% (2,889) $8.86 $13.18
Northeast 7,173,135 421,710 75,065 6.9% 228,537 $9.27 $11.77
Northwest 2,746,503 74,443 4,311 2.9% (45,360) $9.42 $16.62
Round Rock 2,843,027 474,895 7,161 17.0% 186,329 $9.36 $10.96
South 1,506,476 157,437 1,675 10.6% 19,779 $11.27 $33.00
Southeast 11,632,966 727,830 145,561 7.5% 562,197 $8.67 $14.98
Southwest 234,230 0 0 0.0% 7,500 $12.22 $17.52
OVERALL 52,251,488 3,262,746 566,615 7.3% 1,127,528 $8.90 $14.65
Market Summary

More Related Content

What's hot

Cushman toronto office leasing market report 2014
Cushman   toronto office leasing market report 2014Cushman   toronto office leasing market report 2014
Cushman toronto office leasing market report 2014Chris Fyvie
 
JLL Cleveland Industrial Outlook: Q3 2017
JLL Cleveland Industrial Outlook: Q3 2017JLL Cleveland Industrial Outlook: Q3 2017
JLL Cleveland Industrial Outlook: Q3 2017Andrew Batson
 
JLL Cleveland Industrial Outlook Q3 2017
JLL Cleveland Industrial Outlook Q3 2017JLL Cleveland Industrial Outlook Q3 2017
JLL Cleveland Industrial Outlook Q3 2017Andrew Batson
 
Toronto office market report q3 2014
Toronto office market report q3 2014Toronto office market report q3 2014
Toronto office market report q3 2014Chris Fyvie
 
Q3 2015 Industrial Brief
Q3 2015 Industrial BriefQ3 2015 Industrial Brief
Q3 2015 Industrial BriefRyan Searle
 
Q4 2011 Houston Industrial Market Report
Q4 2011 Houston Industrial Market ReportQ4 2011 Houston Industrial Market Report
Q4 2011 Houston Industrial Market ReportCoy Davidson
 
October 2015 baltimore employment update
October 2015 baltimore employment updateOctober 2015 baltimore employment update
October 2015 baltimore employment updatePatrick Latimer
 
Industrial Market Snapshot (3Q12)
Industrial Market Snapshot (3Q12)Industrial Market Snapshot (3Q12)
Industrial Market Snapshot (3Q12)jasonwtolliver
 
World: Laptop Pcs And Palm-Top Organizers - Market Report. Analysis and Forec...
World: Laptop Pcs And Palm-Top Organizers - Market Report. Analysis and Forec...World: Laptop Pcs And Palm-Top Organizers - Market Report. Analysis and Forec...
World: Laptop Pcs And Palm-Top Organizers - Market Report. Analysis and Forec...IndexBox Marketing
 
Atlanta Office Sector Report (Q2 2016)
Atlanta Office Sector Report (Q2 2016)Atlanta Office Sector Report (Q2 2016)
Atlanta Office Sector Report (Q2 2016)Savills Studley
 
Toronto office market report 2015 q2_v3
Toronto office market report 2015 q2_v3Toronto office market report 2015 q2_v3
Toronto office market report 2015 q2_v3Chris Fyvie
 
Industrial & distribution floorspace today
Industrial & distribution floorspace todayIndustrial & distribution floorspace today
Industrial & distribution floorspace todayColin Harrop
 
JLL Louisville Industrial Outlook - Q1 2018
JLL Louisville Industrial Outlook - Q1 2018 JLL Louisville Industrial Outlook - Q1 2018
JLL Louisville Industrial Outlook - Q1 2018 Alex Westcott
 

What's hot (19)

Q3 2020 | Fort Bend | Submarket Snapshot
Q3 2020 | Fort Bend | Submarket SnapshotQ3 2020 | Fort Bend | Submarket Snapshot
Q3 2020 | Fort Bend | Submarket Snapshot
 
Cushman toronto office leasing market report 2014
Cushman   toronto office leasing market report 2014Cushman   toronto office leasing market report 2014
Cushman toronto office leasing market report 2014
 
JLL Cleveland Industrial Outlook: Q3 2017
JLL Cleveland Industrial Outlook: Q3 2017JLL Cleveland Industrial Outlook: Q3 2017
JLL Cleveland Industrial Outlook: Q3 2017
 
JLL Cleveland Industrial Outlook Q3 2017
JLL Cleveland Industrial Outlook Q3 2017JLL Cleveland Industrial Outlook Q3 2017
JLL Cleveland Industrial Outlook Q3 2017
 
Toronto office market report q3 2014
Toronto office market report q3 2014Toronto office market report q3 2014
Toronto office market report q3 2014
 
Q3 2013 Houston Office Market Research Report
Q3 2013 Houston Office Market Research ReportQ3 2013 Houston Office Market Research Report
Q3 2013 Houston Office Market Research Report
 
Q3 2015 Industrial Brief
Q3 2015 Industrial BriefQ3 2015 Industrial Brief
Q3 2015 Industrial Brief
 
Q2 2020 | E Fort Bend Commercial Real Estate Trends
Q2 2020 | E Fort Bend Commercial Real Estate TrendsQ2 2020 | E Fort Bend Commercial Real Estate Trends
Q2 2020 | E Fort Bend Commercial Real Estate Trends
 
Q2 2018 Austin Office Research & Forecast Report
Q2 2018 Austin Office Research & Forecast ReportQ2 2018 Austin Office Research & Forecast Report
Q2 2018 Austin Office Research & Forecast Report
 
Q4 2011 Houston Industrial Market Report
Q4 2011 Houston Industrial Market ReportQ4 2011 Houston Industrial Market Report
Q4 2011 Houston Industrial Market Report
 
Q1 2018 | Houston Industrial | Research & Forecast Report
Q1 2018 | Houston Industrial | Research & Forecast ReportQ1 2018 | Houston Industrial | Research & Forecast Report
Q1 2018 | Houston Industrial | Research & Forecast Report
 
October 2015 baltimore employment update
October 2015 baltimore employment updateOctober 2015 baltimore employment update
October 2015 baltimore employment update
 
Industrial Market Snapshot (3Q12)
Industrial Market Snapshot (3Q12)Industrial Market Snapshot (3Q12)
Industrial Market Snapshot (3Q12)
 
World: Laptop Pcs And Palm-Top Organizers - Market Report. Analysis and Forec...
World: Laptop Pcs And Palm-Top Organizers - Market Report. Analysis and Forec...World: Laptop Pcs And Palm-Top Organizers - Market Report. Analysis and Forec...
World: Laptop Pcs And Palm-Top Organizers - Market Report. Analysis and Forec...
 
Detroit JLL Industrial Employment Update: July 2015
Detroit JLL Industrial Employment Update: July 2015Detroit JLL Industrial Employment Update: July 2015
Detroit JLL Industrial Employment Update: July 2015
 
Atlanta Office Sector Report (Q2 2016)
Atlanta Office Sector Report (Q2 2016)Atlanta Office Sector Report (Q2 2016)
Atlanta Office Sector Report (Q2 2016)
 
Toronto office market report 2015 q2_v3
Toronto office market report 2015 q2_v3Toronto office market report 2015 q2_v3
Toronto office market report 2015 q2_v3
 
Industrial & distribution floorspace today
Industrial & distribution floorspace todayIndustrial & distribution floorspace today
Industrial & distribution floorspace today
 
JLL Louisville Industrial Outlook - Q1 2018
JLL Louisville Industrial Outlook - Q1 2018 JLL Louisville Industrial Outlook - Q1 2018
JLL Louisville Industrial Outlook - Q1 2018
 

Similar to Colliers Q4 2020 Austin Industrial Report

Colliers St. Louis 1Q20 Industrial Market Snapshot
Colliers St. Louis 1Q20 Industrial Market SnapshotColliers St. Louis 1Q20 Industrial Market Snapshot
Colliers St. Louis 1Q20 Industrial Market SnapshotColliersSTL
 
FIBRA Prologis Evercore ISI Non-Deal Roadshow
FIBRA Prologis Evercore ISI Non-Deal RoadshowFIBRA Prologis Evercore ISI Non-Deal Roadshow
FIBRA Prologis Evercore ISI Non-Deal RoadshowKosta Karmaniolas, CFA
 
Ft global investment_outlook_202
Ft global investment_outlook_202Ft global investment_outlook_202
Ft global investment_outlook_202Gary Bhandarkar
 
Big Data’s Potential for the Real Estate Industry: 2021
Big Data’s Potential for the Real Estate Industry: 2021Big Data’s Potential for the Real Estate Industry: 2021
Big Data’s Potential for the Real Estate Industry: 2021PromptCloud
 
North america industrial forecast 2014 2017
North america industrial forecast 2014 2017North america industrial forecast 2014 2017
North america industrial forecast 2014 2017Guy Masse
 

Similar to Colliers Q4 2020 Austin Industrial Report (20)

Q1 2020 | Austin Office | Research & Forecast Report
Q1 2020 | Austin Office | Research & Forecast ReportQ1 2020 | Austin Office | Research & Forecast Report
Q1 2020 | Austin Office | Research & Forecast Report
 
Q3 2020 | Austin Office | Research & Forecast Report
Q3 2020 | Austin Office | Research & Forecast ReportQ3 2020 | Austin Office | Research & Forecast Report
Q3 2020 | Austin Office | Research & Forecast Report
 
Q4 2020 Austin Office Report
Q4 2020 Austin Office ReportQ4 2020 Austin Office Report
Q4 2020 Austin Office Report
 
Q3 2020 | Austin Industrial | Research & Forecast Report
Q3 2020 | Austin Industrial | Research & Forecast ReportQ3 2020 | Austin Industrial | Research & Forecast Report
Q3 2020 | Austin Industrial | Research & Forecast Report
 
Q2 2019 | Austin Office | Research & Forecast Report
Q2 2019 | Austin Office | Research & Forecast ReportQ2 2019 | Austin Office | Research & Forecast Report
Q2 2019 | Austin Office | Research & Forecast Report
 
Q3 2019 | Austin Office | Research & Forecast Report
Q3 2019 | Austin Office | Research & Forecast ReportQ3 2019 | Austin Office | Research & Forecast Report
Q3 2019 | Austin Office | Research & Forecast Report
 
Colliers St. Louis 1Q20 Industrial Market Snapshot
Colliers St. Louis 1Q20 Industrial Market SnapshotColliers St. Louis 1Q20 Industrial Market Snapshot
Colliers St. Louis 1Q20 Industrial Market Snapshot
 
Q4 2020 | Houston Office | Research & Forecast Report
Q4 2020 | Houston Office | Research & Forecast ReportQ4 2020 | Houston Office | Research & Forecast Report
Q4 2020 | Houston Office | Research & Forecast Report
 
Q1 2020 | Austin Industrial | Research & Forecast Report
Q1 2020 | Austin Industrial | Research & Forecast ReportQ1 2020 | Austin Industrial | Research & Forecast Report
Q1 2020 | Austin Industrial | Research & Forecast Report
 
FIBRA Prologis Evercore ISI Non-Deal Roadshow
FIBRA Prologis Evercore ISI Non-Deal RoadshowFIBRA Prologis Evercore ISI Non-Deal Roadshow
FIBRA Prologis Evercore ISI Non-Deal Roadshow
 
BTG Pactual Non-Deal Roadshow
BTG Pactual Non-Deal RoadshowBTG Pactual Non-Deal Roadshow
BTG Pactual Non-Deal Roadshow
 
Q4 2019 | Austin Office | Research & Forecast Report
Q4 2019 | Austin Office | Research & Forecast ReportQ4 2019 | Austin Office | Research & Forecast Report
Q4 2019 | Austin Office | Research & Forecast Report
 
Scotiabank ndrs q2 2020_23 july 2020
Scotiabank ndrs q2 2020_23 july 2020Scotiabank ndrs q2 2020_23 july 2020
Scotiabank ndrs q2 2020_23 july 2020
 
Ft global investment_outlook_202
Ft global investment_outlook_202Ft global investment_outlook_202
Ft global investment_outlook_202
 
Q3 2020 | Houston Office | Research & Forecast Report
Q3 2020 | Houston Office | Research & Forecast ReportQ3 2020 | Houston Office | Research & Forecast Report
Q3 2020 | Houston Office | Research & Forecast Report
 
HTW Month in-review-february-2015
HTW Month in-review-february-2015HTW Month in-review-february-2015
HTW Month in-review-february-2015
 
Q4 2019 | Houston Industrial | Research & Forecast Report
Q4 2019 | Houston Industrial  | Research & Forecast ReportQ4 2019 | Houston Industrial  | Research & Forecast Report
Q4 2019 | Houston Industrial | Research & Forecast Report
 
Big Data’s Potential for the Real Estate Industry: 2021
Big Data’s Potential for the Real Estate Industry: 2021Big Data’s Potential for the Real Estate Industry: 2021
Big Data’s Potential for the Real Estate Industry: 2021
 
Q1 2019 | Houston Industrial | Research & Forecast Report
Q1 2019 | Houston Industrial | Research & Forecast ReportQ1 2019 | Houston Industrial | Research & Forecast Report
Q1 2019 | Houston Industrial | Research & Forecast Report
 
North america industrial forecast 2014 2017
North america industrial forecast 2014 2017North america industrial forecast 2014 2017
North america industrial forecast 2014 2017
 

More from Colliers International | Houston

Q1 2021 | Austin Industrial | Research & Forecast Commericial Real Estate Report
Q1 2021 | Austin Industrial | Research & Forecast Commericial Real Estate ReportQ1 2021 | Austin Industrial | Research & Forecast Commericial Real Estate Report
Q1 2021 | Austin Industrial | Research & Forecast Commericial Real Estate ReportColliers International | Houston
 
2019 | Year-End Texas Seniors Housing & Care | Research & Forecast Report
2019 | Year-End Texas Seniors Housing & Care | Research & Forecast Report2019 | Year-End Texas Seniors Housing & Care | Research & Forecast Report
2019 | Year-End Texas Seniors Housing & Care | Research & Forecast ReportColliers International | Houston
 

More from Colliers International | Houston (15)

Q1 2022 Austin Industrial Report
Q1 2022 Austin Industrial ReportQ1 2022 Austin Industrial Report
Q1 2022 Austin Industrial Report
 
Q1 2022 Austin Office Market Report
Q1 2022 Austin Office Market ReportQ1 2022 Austin Office Market Report
Q1 2022 Austin Office Market Report
 
2021 Q3 Office Austin Report
2021 Q3 Office Austin Report2021 Q3 Office Austin Report
2021 Q3 Office Austin Report
 
Q2 2021 Austin Industrial Report
Q2 2021 Austin Industrial ReportQ2 2021 Austin Industrial Report
Q2 2021 Austin Industrial Report
 
Q2 2021 Austin Office Report
Q2 2021 Austin Office ReportQ2 2021 Austin Office Report
Q2 2021 Austin Office Report
 
Q1 2021 | Austin Industrial | Research & Forecast Commericial Real Estate Report
Q1 2021 | Austin Industrial | Research & Forecast Commericial Real Estate ReportQ1 2021 | Austin Industrial | Research & Forecast Commericial Real Estate Report
Q1 2021 | Austin Industrial | Research & Forecast Commericial Real Estate Report
 
Q1 2021 Austin Office Report
Q1 2021 Austin Office ReportQ1 2021 Austin Office Report
Q1 2021 Austin Office Report
 
Q3 2020 | The Woodlands Office | Research Snapshot
Q3 2020 | The Woodlands Office | Research SnapshotQ3 2020 | The Woodlands Office | Research Snapshot
Q3 2020 | The Woodlands Office | Research Snapshot
 
Q2 2020 | The Woodlands Office | Research Snapshot
Q2 2020 | The Woodlands Office | Research SnapshotQ2 2020 | The Woodlands Office | Research Snapshot
Q2 2020 | The Woodlands Office | Research Snapshot
 
Mid-Year 2020 | Houston Healthcare | Market Report
Mid-Year 2020 | Houston Healthcare | Market ReportMid-Year 2020 | Houston Healthcare | Market Report
Mid-Year 2020 | Houston Healthcare | Market Report
 
Q1 2020 | The Woodlands Office | Research Snapshot
Q1 2020 | The Woodlands Office | Research SnapshotQ1 2020 | The Woodlands Office | Research Snapshot
Q1 2020 | The Woodlands Office | Research Snapshot
 
Q1 2020 | Houston Retail | Research & Forecast Report
Q1 2020 | Houston Retail | Research & Forecast ReportQ1 2020 | Houston Retail | Research & Forecast Report
Q1 2020 | Houston Retail | Research & Forecast Report
 
2019 | Year-End Texas Seniors Housing & Care | Research & Forecast Report
2019 | Year-End Texas Seniors Housing & Care | Research & Forecast Report2019 | Year-End Texas Seniors Housing & Care | Research & Forecast Report
2019 | Year-End Texas Seniors Housing & Care | Research & Forecast Report
 
2019 | Year-End Houston Healthcare Market Report
2019 | Year-End Houston Healthcare Market Report2019 | Year-End Houston Healthcare Market Report
2019 | Year-End Houston Healthcare Market Report
 
Q3 2019 | Austin Industrial | Research & Forecast Report
Q3 2019 | Austin Industrial | Research & Forecast ReportQ3 2019 | Austin Industrial | Research & Forecast Report
Q3 2019 | Austin Industrial | Research & Forecast Report
 

Recently uploaded

Omaxe Dwarka In Delhi E Brochure Pdf
Omaxe Dwarka In Delhi E Brochure     PdfOmaxe Dwarka In Delhi E Brochure     Pdf
Omaxe Dwarka In Delhi E Brochure Pdfashiyadav24
 
Telibagh & Call Girls Lucknow - 450+ Call Girl Cash Payment 🎂 8923113531 🎪 Ne...
Telibagh & Call Girls Lucknow - 450+ Call Girl Cash Payment 🎂 8923113531 🎪 Ne...Telibagh & Call Girls Lucknow - 450+ Call Girl Cash Payment 🎂 8923113531 🎪 Ne...
Telibagh & Call Girls Lucknow - 450+ Call Girl Cash Payment 🎂 8923113531 🎪 Ne...gurkirankumar98700
 
FULL ENJOY 🔝 8264348440 🔝 Call Girls in DLF phase 3 | Gurgaon
FULL ENJOY 🔝 8264348440 🔝 Call Girls in DLF phase 3 | GurgaonFULL ENJOY 🔝 8264348440 🔝 Call Girls in DLF phase 3 | Gurgaon
FULL ENJOY 🔝 8264348440 🔝 Call Girls in DLF phase 3 | Gurgaonsoniya singh
 
Low Rate Call Girls in Triveni Complex Delhi Call 9990771857
Low Rate Call Girls in Triveni Complex Delhi Call 9990771857Low Rate Call Girls in Triveni Complex Delhi Call 9990771857
Low Rate Call Girls in Triveni Complex Delhi Call 9990771857delhimodel235
 
9990771857 Call Girls in Noida Sector 03 Noida (Call Girls) Delhi
9990771857 Call Girls in Noida Sector 03 Noida (Call Girls) Delhi9990771857 Call Girls in Noida Sector 03 Noida (Call Girls) Delhi
9990771857 Call Girls in Noida Sector 03 Noida (Call Girls) Delhidelhimodel235
 
Low Rate Call Girls in Tughlakabad Delhi Call 9990771857
Low Rate Call Girls in Tughlakabad Delhi Call 9990771857Low Rate Call Girls in Tughlakabad Delhi Call 9990771857
Low Rate Call Girls in Tughlakabad Delhi Call 9990771857delhimodel235
 
Building Dreams: Newman Leech's Visionary Approach to Real Estate Investment
Building Dreams: Newman Leech's Visionary Approach to Real Estate InvestmentBuilding Dreams: Newman Leech's Visionary Approach to Real Estate Investment
Building Dreams: Newman Leech's Visionary Approach to Real Estate InvestmentNewman George Leech
 
Purva Palm Hills Devanahalli, Bangalore E- Brochure.pdf
Purva Palm Hills Devanahalli, Bangalore E- Brochure.pdfPurva Palm Hills Devanahalli, Bangalore E- Brochure.pdf
Purva Palm Hills Devanahalli, Bangalore E- Brochure.pdffaheemali990101
 
call girls in ganesh nagar Delhi 8264348440 ✅ call girls ❤️
call girls in ganesh nagar Delhi 8264348440 ✅ call girls ❤️call girls in ganesh nagar Delhi 8264348440 ✅ call girls ❤️
call girls in ganesh nagar Delhi 8264348440 ✅ call girls ❤️soniya singh
 
9990771857 Call Girls in Noida Sector 06 Noida (Call Girls) Delhi
9990771857 Call Girls in Noida Sector 06 Noida (Call Girls) Delhi9990771857 Call Girls in Noida Sector 06 Noida (Call Girls) Delhi
9990771857 Call Girls in Noida Sector 06 Noida (Call Girls) Delhidelhimodel235
 
9990771857 Call Girls in Noida Sector 34 Noida (Call Girls) Delhi
9990771857 Call Girls in Noida Sector 34 Noida (Call Girls) Delhi9990771857 Call Girls in Noida Sector 34 Noida (Call Girls) Delhi
9990771857 Call Girls in Noida Sector 34 Noida (Call Girls) Delhidelhimodel235
 
The Omaxe State Dwarka Delhi-broucher.pdf.pdf
The Omaxe State Dwarka Delhi-broucher.pdf.pdfThe Omaxe State Dwarka Delhi-broucher.pdf.pdf
The Omaxe State Dwarka Delhi-broucher.pdf.pdfkratirudram
 
Call Girls in shastri nagar Delhi 8264348440 ✅ call girls ❤️
Call Girls in shastri nagar Delhi 8264348440 ✅ call girls ❤️Call Girls in shastri nagar Delhi 8264348440 ✅ call girls ❤️
Call Girls in shastri nagar Delhi 8264348440 ✅ call girls ❤️soniya singh
 
Call Girls in Pitampura Delhi 💯Call Us 🔝8264348440🔝
Call Girls in Pitampura Delhi 💯Call Us 🔝8264348440🔝Call Girls in Pitampura Delhi 💯Call Us 🔝8264348440🔝
Call Girls in Pitampura Delhi 💯Call Us 🔝8264348440🔝soniya singh
 
Call Girls in Khan Market 9654467111 ESCORTS SERVICE
Call Girls in Khan Market 9654467111 ESCORTS SERVICECall Girls in Khan Market 9654467111 ESCORTS SERVICE
Call Girls in Khan Market 9654467111 ESCORTS SERVICESapana Sha
 
Call Girls in Kashmiri Gate Delhi 💯Call Us 🔝8264348440🔝
Call Girls in Kashmiri Gate Delhi 💯Call Us 🔝8264348440🔝Call Girls in Kashmiri Gate Delhi 💯Call Us 🔝8264348440🔝
Call Girls in Kashmiri Gate Delhi 💯Call Us 🔝8264348440🔝soniya singh
 
Aparna Greenscapes Kompally Hyderabad E - Brochure.pdf
Aparna Greenscapes Kompally Hyderabad E - Brochure.pdfAparna Greenscapes Kompally Hyderabad E - Brochure.pdf
Aparna Greenscapes Kompally Hyderabad E - Brochure.pdffaheemali990101
 
How to Build Multifamily and Laneway Suites in Toronto!! (feat. Expert Archi...
How to Build Multifamily and Laneway Suites  in Toronto!! (feat. Expert Archi...How to Build Multifamily and Laneway Suites  in Toronto!! (feat. Expert Archi...
How to Build Multifamily and Laneway Suites in Toronto!! (feat. Expert Archi...Volition Properties
 
Rustomjee Cleon Bandra East, Mumbai - Brochure.pdf
Rustomjee Cleon Bandra East, Mumbai - Brochure.pdfRustomjee Cleon Bandra East, Mumbai - Brochure.pdf
Rustomjee Cleon Bandra East, Mumbai - Brochure.pdfmonikasharma630
 
Call Girls in Noida Sector 12 Noida 💯Call Us 🔝 9582086666 🔝 South Delhi Escor...
Call Girls in Noida Sector 12 Noida 💯Call Us 🔝 9582086666 🔝 South Delhi Escor...Call Girls in Noida Sector 12 Noida 💯Call Us 🔝 9582086666 🔝 South Delhi Escor...
Call Girls in Noida Sector 12 Noida 💯Call Us 🔝 9582086666 🔝 South Delhi Escor...delhimodel235
 

Recently uploaded (20)

Omaxe Dwarka In Delhi E Brochure Pdf
Omaxe Dwarka In Delhi E Brochure     PdfOmaxe Dwarka In Delhi E Brochure     Pdf
Omaxe Dwarka In Delhi E Brochure Pdf
 
Telibagh & Call Girls Lucknow - 450+ Call Girl Cash Payment 🎂 8923113531 🎪 Ne...
Telibagh & Call Girls Lucknow - 450+ Call Girl Cash Payment 🎂 8923113531 🎪 Ne...Telibagh & Call Girls Lucknow - 450+ Call Girl Cash Payment 🎂 8923113531 🎪 Ne...
Telibagh & Call Girls Lucknow - 450+ Call Girl Cash Payment 🎂 8923113531 🎪 Ne...
 
FULL ENJOY 🔝 8264348440 🔝 Call Girls in DLF phase 3 | Gurgaon
FULL ENJOY 🔝 8264348440 🔝 Call Girls in DLF phase 3 | GurgaonFULL ENJOY 🔝 8264348440 🔝 Call Girls in DLF phase 3 | Gurgaon
FULL ENJOY 🔝 8264348440 🔝 Call Girls in DLF phase 3 | Gurgaon
 
Low Rate Call Girls in Triveni Complex Delhi Call 9990771857
Low Rate Call Girls in Triveni Complex Delhi Call 9990771857Low Rate Call Girls in Triveni Complex Delhi Call 9990771857
Low Rate Call Girls in Triveni Complex Delhi Call 9990771857
 
9990771857 Call Girls in Noida Sector 03 Noida (Call Girls) Delhi
9990771857 Call Girls in Noida Sector 03 Noida (Call Girls) Delhi9990771857 Call Girls in Noida Sector 03 Noida (Call Girls) Delhi
9990771857 Call Girls in Noida Sector 03 Noida (Call Girls) Delhi
 
Low Rate Call Girls in Tughlakabad Delhi Call 9990771857
Low Rate Call Girls in Tughlakabad Delhi Call 9990771857Low Rate Call Girls in Tughlakabad Delhi Call 9990771857
Low Rate Call Girls in Tughlakabad Delhi Call 9990771857
 
Building Dreams: Newman Leech's Visionary Approach to Real Estate Investment
Building Dreams: Newman Leech's Visionary Approach to Real Estate InvestmentBuilding Dreams: Newman Leech's Visionary Approach to Real Estate Investment
Building Dreams: Newman Leech's Visionary Approach to Real Estate Investment
 
Purva Palm Hills Devanahalli, Bangalore E- Brochure.pdf
Purva Palm Hills Devanahalli, Bangalore E- Brochure.pdfPurva Palm Hills Devanahalli, Bangalore E- Brochure.pdf
Purva Palm Hills Devanahalli, Bangalore E- Brochure.pdf
 
call girls in ganesh nagar Delhi 8264348440 ✅ call girls ❤️
call girls in ganesh nagar Delhi 8264348440 ✅ call girls ❤️call girls in ganesh nagar Delhi 8264348440 ✅ call girls ❤️
call girls in ganesh nagar Delhi 8264348440 ✅ call girls ❤️
 
9990771857 Call Girls in Noida Sector 06 Noida (Call Girls) Delhi
9990771857 Call Girls in Noida Sector 06 Noida (Call Girls) Delhi9990771857 Call Girls in Noida Sector 06 Noida (Call Girls) Delhi
9990771857 Call Girls in Noida Sector 06 Noida (Call Girls) Delhi
 
9990771857 Call Girls in Noida Sector 34 Noida (Call Girls) Delhi
9990771857 Call Girls in Noida Sector 34 Noida (Call Girls) Delhi9990771857 Call Girls in Noida Sector 34 Noida (Call Girls) Delhi
9990771857 Call Girls in Noida Sector 34 Noida (Call Girls) Delhi
 
The Omaxe State Dwarka Delhi-broucher.pdf.pdf
The Omaxe State Dwarka Delhi-broucher.pdf.pdfThe Omaxe State Dwarka Delhi-broucher.pdf.pdf
The Omaxe State Dwarka Delhi-broucher.pdf.pdf
 
Call Girls in shastri nagar Delhi 8264348440 ✅ call girls ❤️
Call Girls in shastri nagar Delhi 8264348440 ✅ call girls ❤️Call Girls in shastri nagar Delhi 8264348440 ✅ call girls ❤️
Call Girls in shastri nagar Delhi 8264348440 ✅ call girls ❤️
 
Call Girls in Pitampura Delhi 💯Call Us 🔝8264348440🔝
Call Girls in Pitampura Delhi 💯Call Us 🔝8264348440🔝Call Girls in Pitampura Delhi 💯Call Us 🔝8264348440🔝
Call Girls in Pitampura Delhi 💯Call Us 🔝8264348440🔝
 
Call Girls in Khan Market 9654467111 ESCORTS SERVICE
Call Girls in Khan Market 9654467111 ESCORTS SERVICECall Girls in Khan Market 9654467111 ESCORTS SERVICE
Call Girls in Khan Market 9654467111 ESCORTS SERVICE
 
Call Girls in Kashmiri Gate Delhi 💯Call Us 🔝8264348440🔝
Call Girls in Kashmiri Gate Delhi 💯Call Us 🔝8264348440🔝Call Girls in Kashmiri Gate Delhi 💯Call Us 🔝8264348440🔝
Call Girls in Kashmiri Gate Delhi 💯Call Us 🔝8264348440🔝
 
Aparna Greenscapes Kompally Hyderabad E - Brochure.pdf
Aparna Greenscapes Kompally Hyderabad E - Brochure.pdfAparna Greenscapes Kompally Hyderabad E - Brochure.pdf
Aparna Greenscapes Kompally Hyderabad E - Brochure.pdf
 
How to Build Multifamily and Laneway Suites in Toronto!! (feat. Expert Archi...
How to Build Multifamily and Laneway Suites  in Toronto!! (feat. Expert Archi...How to Build Multifamily and Laneway Suites  in Toronto!! (feat. Expert Archi...
How to Build Multifamily and Laneway Suites in Toronto!! (feat. Expert Archi...
 
Rustomjee Cleon Bandra East, Mumbai - Brochure.pdf
Rustomjee Cleon Bandra East, Mumbai - Brochure.pdfRustomjee Cleon Bandra East, Mumbai - Brochure.pdf
Rustomjee Cleon Bandra East, Mumbai - Brochure.pdf
 
Call Girls in Noida Sector 12 Noida 💯Call Us 🔝 9582086666 🔝 South Delhi Escor...
Call Girls in Noida Sector 12 Noida 💯Call Us 🔝 9582086666 🔝 South Delhi Escor...Call Girls in Noida Sector 12 Noida 💯Call Us 🔝 9582086666 🔝 South Delhi Escor...
Call Girls in Noida Sector 12 Noida 💯Call Us 🔝 9582086666 🔝 South Delhi Escor...
 

Colliers Q4 2020 Austin Industrial Report

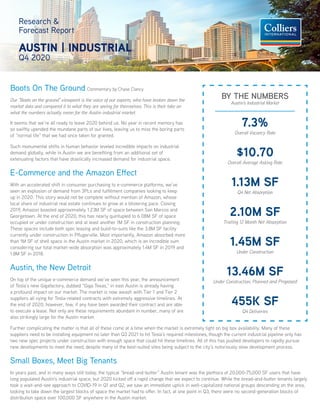
  • 1. Research & Forecast Report AUSTIN | INDUSTRIAL Q4 2020 It seems that we’re all ready to leave 2020 behind us. No year in recent memory has so swiftly upended the mundane parts of our lives, leaving us to miss the boring parts of “normal life” that we had once taken for granted. Such monumental shifts in human behavior leveled incredible impacts on industrial demand globally, while in Austin we are benefiting from an additional set of extenuating factors that have drastically increased demand for industrial space. E-Commerce and the Amazon Effect With an accelerated shift in consumer purchasing to e-commerce platforms, we’ve seen an explosion of demand from 3PLs and fulfillment companies looking to keep up in 2020. This story would not be complete without mention of Amazon, whose local share of industrial real estate continues to grow at a blistering pace. Closing 2019, Amazon boasted approximately 1.23M SF of space between San Marcos and Georgetown. At the end of 2020, this has nearly quintupled to 6.08M SF of space occupied or under construction and at least another 1M SF in construction planning. These spaces include both spec leasing and build-to-suits like the 3.8M SF facility currently under construction in Pflugerville. Most importantly, Amazon absorbed more than 1M SF of shell space in the Austin market in 2020, which is an incredible sum considering our total market-wide absorption was approximately 1.4M SF in 2019 and 1.8M SF in 2018. Austin, the New Detroit On top of the unique e-commerce demand we’ve seen this year, the announcement of Tesla’s new Gigafactory, dubbed “Giga Texas,” in east Austin is already having a profound impact on our market. The market is now awash with Tier 1 and Tier 2 suppliers all vying for Tesla-related contracts with extremely aggressive timelines. At the end of 2020, however, few, if any have been awarded their contract and are able to execute a lease. Not only are these requirements abundant in number, many of are also strikingly large for the Austin market. Further complicating the matter is that all of these come at a time when the market is extremely tight on big box availability. Many of these suppliers need to be installing equipment no later than Q3 2021 to hit Tesla’s required milestones, though the current industrial pipeline only has two new spec projects under construction with enough space that could hit these timelines. All of this has pushed developers to rapidly pursue new developments to meet the need, despite many of the best-suited sites being subject to the city’s notoriously slow development process. Small Boxes, Meet Big Tenants In years past, and in many ways still today, the typical “bread-and-butter” Austin tenant was the plethora of 20,000-75,000 SF users that have long populated Austin’s industrial space, but 2020 kicked off a rapid change that we expect to continue. While the bread-and-butter tenants largely took a wait-and-see approach to COVID-19 in Q1 and Q2, we saw an immediate uptick in well-capitalized national groups descending on the area, looking to take down the largest blocks of space the market had to offer. In fact, at one point in Q3, there were no second-generation blocks of distribution space over 100,000 SF anywhere in the Austin market. Boots On The Ground Commentary by Chase Clancy Our “Boots on the ground” viewpoint is the voice of our experts, who have broken down the market data and compared it to what they are seeing for themselves. This is their take on what the numbers actually mean for the Austin industrial market. 1.13M SF Q4 Net Absorption 1.45M SF Under Construction 13.46M SF Under Construction, Planned and Proposed $10.70 Overall Average Asking Rate 7.3% Overall Vacancy Rate 2.10M SF Trailing 12 Month Net Absorption 455K SF Q4 Deliveries BY THE NUMBERS Austin’s Industrial Market
  • 2. AUSTIN | INDUSTRIAL | Q4 2020 While the market would previously see a handful of 100,000+ SF deals in a year, at the end of 2020 we have multiple 200,000-700,000 SF requirements competing for space, with some companies kicking tires on 1M+ SF build to suits. Many, but not all of these supersized requirements are tied to Tesla’s activities in the market, which we expect will continue to ignite demand for big boxes. Beyond the burgeoning automotive manufacturing sector, however, there are other notably large requirements that will continue to place additional pressure on the supply of big blocks of space. The Great Land Grab of 2020 Staring down the barrel of fervent demand for at least the next few years, developers have sprung into action. At the end of 2020, there was approximately 1.45M SF of spec industrial space under construction set to deliver in Q2-Q3 of 2021, with another 3.38M SF in the planning stages set to deliver between Q4 2021 and Q3 2022. Behind that, many of these projects have future phases totaling an additional 8.63M SF, while even more developers hunt for land to plant their first – or next – flag in the Austin market. The projects first set to deliver in 2021 are in Kyle to the south and Georgetown to the north. In Kyle, the Plum Creek Industrial Center, developed by NorthPoint Development, will provide 444,058 SF in its first phase which is set to deliver in May of 2021. The project will be a best-in-class development showcasing the next generation of building standards for the market, including 36’ clear heights and heavy power in a 240’ deep rear-load design. NorthPoint Development already has plans for the project’s second phase which promises to deliver an additional 400,000-500,000 SF to the Hays County submarket. To the north, NorthPark35 developed by Titan Development, represents the northernmost reaches of spec development in the Austin market, and will serve as a litmus test for the suitability of industrial product this far north. Titan has already had success with pushing the goalposts of Austin’s market with the development of the Innovation Business Park in Hutto, and they’ll have many eyes watching their leasing velocity in Georgetown. Behind these first deliveries in 2021, many of the spec projects currently in the planning and site development phases are in the north and northeast submarkets near the junction of Highway 290 and State Highway 130. Many of these sites are a (15 minute) stone’s throw from Giga Texas, which will continue to attract a supplier network that needs to be as close as possible. That said, with nearly 6.4M SF of proposed product in this area, albeit in multiple phases, the competition for tenants between Landlords promises to be fierce. Closing the Year The 4th quarter caps off what will go down as one of the most interesting and confounding years in decades. As the world crawls out of its bunkers with COVID-19 vaccines in hand, Austin’s industrial market will surely benefit from all of the aforementioned shots in the arm. Looking forward, we anticipate continued, robust demand for industrial space, and continued, robust development looking for its piece of the pie. Austin’s market seems to be on the precipice of “leveling up” from a smaller, local distribution and R&D market to a true Tier 2 industrial market in Central Texas, and 2021 will undoubtedly set the tone. This document has been prepared by Colliers International for advertising and general information only. Colliers International makes no guarantees, representations or warranties of any kind, expressed or implied, regarding the information including, b Any interested party should undertake their own inquiries as to the accuracy of the information. Colliers International excludes unequivocally all inferred or implied terms, conditions and warranties arising out of this document and excludes all liabil the copyrighted property of Colliers International and /or its licensor(s). © 2021. All rights reserved. Data source: ESRI, HERE, Garmin, FAO, NOAA, USGS, © OpenStreetMap. 1 inch represents 9.08 miles This document has been prepared by Colliers International for advertising and general information only. Colliers International makes no guarantees, representations or warranties of an Any interested party should undertake their own inquiries as to the accuracy of the information. Colliers International excludes unequivocally all inferred or implied terms, conditions the copyrighted property of Colliers International and /or its licensor(s). © 2021. All rights reserved. Data source: ESRI, HERE, Garmin, FAO, NOAA, USGS, © OpenStreetMap. 1 inch represen This document has been prepared by Colliers International for advertising and general information only. Collie Any interested party should undertake their own inquiries as to the accuracy of the information. Colliers Intern the copyrighted property of Colliers International and /or its licensor(s). © 2021. All rights reserved. Data source Austin Economy Statistics 0% 3% 6% 9% 12% 15% Austin US 750,000 1,000,000 1,250,000 1,500,000 AUSTIN UNEMPLOYMENT RATE VS. U.S. AUSTIN EMPLOYMENT
  • 3. 3 North American Research & Forecast Report | Q4 2014 | Office Market Outlook | Colliers International Copyright © 2015 Colliers International. The information contained herein has been obtained from sources deemed reliable. While every reasonable effort has been made to ensure its accuracy, we cannot guarantee it. No responsibility is assumed for any inaccuracies. Readers are encouraged to consult their professional advisors prior to acting on any of the material contained in this report. Colliers International | Market 000 Address, Suite # 000 Address, Suite # +1 000 000 0000 colliers.com/<<market>> 3 North American Research & Forecast Report | Q4 2014 | Office Market Outlook | Colliers International Copyright © 2021 Colliers International. The information contained herein has been obtained from sources deemed reliable. While every reasonable effort has been made to ensure its accuracy, we cannot guarantee it. No responsibility is assumed for any inaccuracies. Readers are encouraged to consult their professional advisors prior to acting on any of the material contained in this report. RESEARCH CONTACT John O’Sullivan Research Associate | Austin +1 512 539 3012 john.o’sullivan@colliers.com BROKER CONTACTS Travis Hicks Vice President | Austin +1 512 539 3005 travis.hicks@colliers.com Chase Clancy Associate Vice President | Austin +1 512 539 3023 chase.clancy@colliers.com AUSTIN | INDUSTRIAL | Q4 2020 Georgetown Far Northeast Southeast Hays County Northeast NORTHEAST 1,612,477 SF FAR NORTHEAST 1,522,149 SF HAYS COUNTY 1,507,343 SF SOUTHEAST 317,572 SF GEORGETOWN 331,030 SF 18 MONTH PROJECTED DELIVERIES BY SUBMARKET Speculative Development Pipeline (Multi-Phase) Tuscany Logistics Center Bldgs I, II & III Available: Q3 2021 Submarket: Northeast Size: 373,477 SF NorthPark35 Bldgs I & II Available: Q3 2021 Submarket: Georgetown Size: 331,030 SF Park 183 Bldgs III & V Available: Q3 2021 Submarket: Southeast Size: 317,572 SF Plum Creek Industrial Bldgs I & II Available: Q2 2021 Submarket: Hays County Size: 444,058 SF SUBMARKET INVENTORY (SF) DIRECT VACANCY (SF) SUBLEASE VACANCY (SF) OVERALL VACANCY RATE Q4 NET ABSORPTION (SF) OVERALL AVERAGE ASKING RATE(W/D) OVERALL AVERAGE ASKING RATE (FLEX) Central 1,130,662 70,281 27,375 8.6% 13,143 $13.24 $13.90 East 3,847,237 284,236 27,412 8.1% 30,598 $9.97 – Far Northeast 3,217,401 167,625 33,600 6.3% 92,790 $10.48 $17.07 Far Northwest 678,274 6,777 0 1.0% (31,921) $12.00 $14.26 Hays County 4,219,667 291,362 46,253 8.0% 66,825 $6.04 – North 13,021,910 586,150 198,202 6.0% (2,889) $8.86 $13.18 Northeast 7,173,135 421,710 75,065 6.9% 228,537 $9.27 $11.77 Northwest 2,746,503 74,443 4,311 2.9% (45,360) $9.42 $16.62 Round Rock 2,843,027 474,895 7,161 17.0% 186,329 $9.36 $10.96 South 1,506,476 157,437 1,675 10.6% 19,779 $11.27 $33.00 Southeast 11,632,966 727,830 145,561 7.5% 562,197 $8.67 $14.98 Southwest 234,230 0 0 0.0% 7,500 $12.22 $17.52 OVERALL 52,251,488 3,262,746 566,615 7.3% 1,127,528 $8.90 $14.65 Market Summary