The Woodlands Office Market Snapshot Q2 2015
•
1 like•233 views

The Woodlands Office Market Snapshot Q2 2015

Recommended
More Related Content
What's hot
What's hot (19)
Viewers also liked
Viewers also liked (20)
Similar to The Woodlands Office Market Snapshot Q2 2015
Similar to The Woodlands Office Market Snapshot Q2 2015 (20)
More from Colliers International | Houston
More from Colliers International | Houston (20)
Recently uploaded
Recently uploaded (20)
The Woodlands Office Market Snapshot Q2 2015
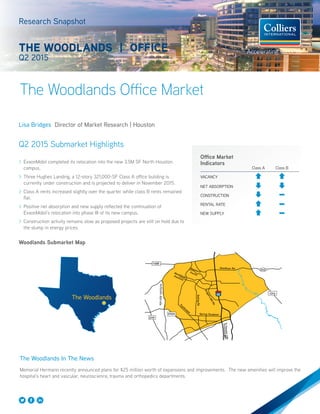
- 1. The Woodlands Office Market Research Snapshot THE WOODLANDS | OFFICE Q2 2015 Lisa Bridges Director of Market Research | Houston Q2 2015 Submarket Highlights >> ExxonMobil completed its relocation into the new 3.5M SF North Houston campus. >> Three Hughes Landing, a 12-story 321,000-SF Class A office building is currently under construction and is projected to deliver in November 2015. >> Class A rents increased slightly over the quarter while class B rents remained flat. >> Positive net absorption and new supply reflected the continuation of ExxonMobil’s relocation into phase III of its new campus. >> Construction activity remains slow as proposed projects are still on hold due to the slump in energy prices. Woodlands Submarket Map 1488 2920 249 1314 242 Huffsmith-Kohrville WoodlandsParkway ResearchForest Needham Rd. Grogan’sMillRd. Spring Stuebner GoslingRd. Kuykendahl ToHoustonCBD The Woodlands In The News Memorial Hermann recently announced plans for $25 million worth of expansions and improvements. The new amenities will improve the hospital’s heart and vascular, neuroscience, trauma and orthopedics departments. Office Market Indicators Class A Class B VACANCY NET ABSORPTION CONSTRUCTION RENTAL RATE NEW SUPPLY The Woodlands
- 2. 22 The Woodlands Research Snapshot | Q2 2015 | Office | Colliers International The Woodlands Summary Absorption and New Supply Woodlands Class A Office Woodlands Class B Office INVENTORY DIRECT VACANCY SUBLEASE VACANCY VACANCY VACANCY RATE (%) NET ABSORPTION (SF) RENTAL RATE CLASS # OF BLDGS. TOTAL (SF) (SF) RATE (%) (SF) RATE (%) TOTAL (SF) Q2-2015 Q1-2015 Q2-2015 Q1-2015 AVG ($/SF) THE WOODLANDS A 32 9,251,755 434,129 4.7% 49,403 0.5% 483,532 5.2% 5.0% 452,559 1,671,730 $35.60 B 70 4,426,517 442,448 10.0% 33,340 0.8% 475,788 10.7% 8.1% -115,935 762 $24.66 C 5 338,038 1,000 0.3% 0 0.0% 1,000 0.3% 0.3% 0 0 $19.80 Total 107 14,016,310 877,577 6.3% 82,743 0.6% 960,320 6.9% 5.9% 336,624 1,672,492 $30.28 -200,000 0 200,000 400,000 600,000 800,000 1,000,000 1,200,000 1,400,000 1,600,000 1,800,000 Net Absorption New Supply -150,000 -100,000 -50,000 0 50,000 100,000 150,000 200,000 Net Absorption New Supply
- 3. 3 The Woodlands Research Snapshot | Q2 2015 | Office | Colliers International3 The average quoted rental rates are a mix of direct and sublet rates and are based on a blend of gross and NNN. The graphs below are only intended to show rental rate trends. Actual gross rates are higher than the average rate shown in the graph. 4.00% 6.00% 8.00% 10.00% 12.00% 14.00% 16.00% 18.00% $18.00 $19.00 $20.00 $21.00 $22.00 $23.00 $24.00 $25.00 $26.00 $27.00 $28.00 Class B Rental Rate and Vacancy Percentage The Woodlands, TX Class B Rents Class B Vacancy *Vacancy percentage includes direct and sublease space. 0 50,000 100,000 150,000 200,000 250,000 Available Sublease Space - The Woodlands Class A Class B Available Sublease Space Q2 2015 Class A: 194,363 SF or 2.0% Class B: 117,331 SF or 2.5% 0.0% 2.0% 4.0% 6.0% 8.0% 10.0% 12.0% 14.0% 16.0% 18.0% $25.00 $27.00 $29.00 $31.00 $33.00 $35.00 $37.00 $39.00 Class A Rental Rate and Vacancy Percentage The Woodlands, TX Class A Rents Class A Vacancy *Vacancy percentage includes direct and sublease space.
- 4. Copyright © 2015 Colliers International. The information contained herein has been obtained from sources deemed reliable. While every reasonable effort has been made to ensure its accuracy, we cannot guarantee it. No responsibility is assumed for any inaccuracies. Readers are encouraged to consult their professional advisors prior to acting on any of the material contained in this report. About Colliers International Colliers International is a global leader in commercial real estate services, with more than 16,300 professionals operating out of 502 offices in 67 countries. A subsidiary of FirstService Corporation, Colliers International delivers a full range of services to real estate occupiers, owners and investors worldwide, including global corporate solutions, brokerage, property and asset management, hotel investment sales and consulting, valuation, consulting and appraisal services, mortgage banking and insightful research. Colliers International has been recognized and ranked by the International Association of Outsourcing Professionals’ Global Outsourcing 100 for 10 consecutive years, more than any other real estate services firm. colliers.com 502 offices in 67 countries on 6 continents United States: 140 Canada: 31 Latin America: 24 Asia Pacific: 199 EMEA: 108 $2.3 billion in annual revenue 1.7 billion square feet under management 16,300 professionals and staff MARKET CONTACT: Lisa Bridges Director of Market Research | Houston +1 713 830 2125 lisa.bridges@colliers.com Colliers International | The Woodlands Two Hughes Landing 1790 Hughes Landing Blvd. The Woodlands, TX | USA +1 713 830 4011