Download as PDF, PPTX


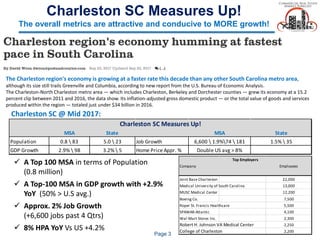
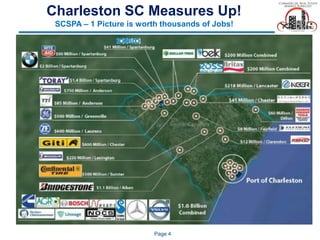


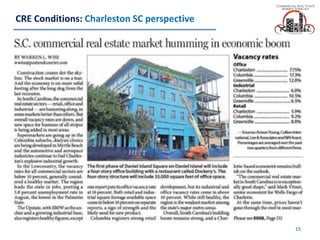


The economic outlook for Charleston, SC is positive. - The Charleston metro area has experienced faster GDP and job growth than other South Carolina cities in the past decade. - Major employers in the region include Joint Base Charleston, MUSC, Boeing, and hospitals, contributing to steady job growth. - Real estate fundamentals are strong, with housing and industrial real estate performing well due to low inventory and demand from supply chain shifts.


