SlideShare a Scribd company logo
1 of 5
20Q1 20Q4 21Q1
New Supply
(in Thousands of SF)
1,336.33 83.78 893.74
Net Absorption
(in Thousands of SF)
(35.45) (555.29) (628.92)
Overall Vacancy 13.0% 17.1% 17.8%
Under
Construction
(in Thousands of SF)
5,319.76 5,916.10 5,830.25
CBD Class A Asking
Lease Rates (NNN)
$62.51 $61.02 $63.71
Overall Asking
Lease Rates (NNN)
$35.93 $44.74 $45.60
Sale
Frontera Crossing
North/Domain | 164K SF
Lease
The Grove II
West Central | 47K SF
TX Municipal Retirement System
Lease
Penn Field
South | 44K SF
F45 Training
Sale
Foundry I
East | 76K SF
Lease
Indeed Tower
CBD | 50K SF
Vinson & Elkins
YOY
FORECAST
YOY
YOY
FORECAST
YOY
FORECAST
FORECAST
Office
Austin,
TX
21Q1
Boots On the Ground
As the US economy recovers from the COVID-19 pandemic, the Austin market is beginning to show signs of life. Our team
continues to see heavy demand for both industrial and investment products, however, rebounding office activity remains the
highlight of the quarter. Over the past 60 days, office property tours have increased three-fold, long postponed leases have been
inked and discussions with C-Suite executives considering a move to the city have swelled. Additionally, many Austin companies
will likely start reoccupying their offices this summer/fall, a clear indication that the market is correcting more quickly than
initially expected.
Unemployment Rate
Market Indicators
Historic Comparison
5.3%
Austin
Unemployment
Rate
1.55%
US 10 Year
Treasury Note
6.0%
US
Unemployment
Rate
Vacancy Rate
17.8%
Net Absorption
-629K SF
Overall Class A Asking
Lease Rates (FSG)
$49.88/SF
Under
Construction
5.8M SF
Key Takeaways
•	 Citywide leasing activity return to normalcy: more transactions
completed during Q1 2021 vs. the last 12 months
•	 300 Colorado delivers – 100% pre-leased by Parsley Energy,
however, entirety of building available for sublease
•	 COVID vaccine coupled with Proposition B “Homeless Camping
Ban” likely to impact market favorably
Recent Transactions
0.0%
2.0%
4.0%
6.0%
8.0%
10.0%
12.0%
14.0%
16.0%
Jan
2018
Mar
2018
May
2018
Jul
2018
Sep
2018
Nov
2018
Jan
2019
Mar
2019
May
2019
Jul
2019
Sep
2019
Nov
2019
Jan
2020
Mar
2020
May
2020
Jul
2020
Sep
2020
Nov
2020
Jan
2021
Mar
2021
Austin Texas US
Colliers | Austin | 21Q1 | Office Report
Office
Austin,
TX
21Q1
Sublease Environment
26%
2%
12%
4%
4%
5%
27%
1%
19%
CBD
Central & West Central
East
North / Domain
Northeast
Far Northwest
Northwest
South
Southwest
20Q1 20Q4 21Q1
CBD 139,946 662,096 791,981
Central & West Central 35,517 63,979 70,457
East 58,805 222,983 381,831
Domain 8,753 103,007 106,960
Northeast 165,160 119,636 119,636
Far Northwest 88,861 96,124 162,377
Northwest 311,828 657,467 846,869
South – 38,714 35,909
Southwest 189,722 358,329 571,151
The Market, at a Glance
As Austin began to wake up from the winter slumber and employees began to peek behind the curtains of their home office,
Winter Storm Uri swept through Texas in mid-February and put a freeze on leasing and sales activity for almost two weeks as
millions of Texans battled through the aftermath of unfamiliar weather. As evident by the Bluebonnets blooming though, Texas
remained resilient and pushed through to a warmer (and vaccinated) environment, where Austin continues to remain toward
the top of the list for institutional investments, office expansions and headquarter relocations.
More than 10 companies announced the opening of an office or headquarters relocation in Austin in Q1 of 2021, with a dozen
other investment and development firms acquiring a real estate asset in the greater Austin area. F45 Training and Tishman
Speyer are two notable new tenants and investors in Austin. The Australian-based fitness franchise F45 signed a 44,000 SF,
8-year lease in South Austin’s Penn Field offices, and New York-based Tishman Speyer made their first Austin purchase with the
acquisition of the Foundry I, a 76,000 SF office project on the Eastside. In addition to Austin’s new residents, some of our local
and established groups stretched out for some elbowroom as well. Vinson & Elkins made a pivotal move and leased 50,000 SF
in the Indeed Tower downtown, breaking away from their previous suburban location, and Texas Municipal Retirement System
signed a 47,000 SF lease at The Grove, an Endeavor project in Central Austin. While Q1 saw more completed transactions than
any other quarter in the past year, overall numbers are still lagging behind this activity with negative absorption rates and
an increasing supply of sublease space, though most of our sublease space this quarter can be attributed to Parsley Energy
(369,000 SF, 300 Colorado) and Spiceworks (49,000 SF, 3600 San Clemente).
Future Forecast
Developers and buyers continue to be bullish on Austin, and it is hard to disagree otherwise. Even with the option to work
from home likely to be a standard offering by employers moving forward, the bigger focus in Austin is not when employees are
headed back into the office, but rather who is moving here next. The Austin Chamber of Commerce is tracking a record number
of active prospects for incentive-worthy relocations and the residential real estate market is experiencing a supply-and-demand
issue, to say the least. Those are two good indicators that Austin still has some growing to do, which means pricing is likely to do
the same.
Colliers | Austin | 21Q1 | Office Report
Office
Austin,
TX
21Q1
0.0%
2.0%
4.0%
6.0%
8.0%
10.0%
12.0%
14.0%
16.0%
18.0%
20.0%
$0.00
$10.00
$20.00
$30.00
$40.00
$50.00
$60.00
$70.00 Q4
2019
Q1
2020
Q2
2020
Q3
2020
Q4
2020
Q1
2021
CBD Citywide Vacancy Rate
Notable Completions
Jan ‘21
Jan ‘21 Apr ‘21
Apr ‘21
(1,500,000)
(1,000,000)
(500,000)
0
500,000
1,000,000
1,500,000
Q4 2019 Q1 2020 Q2 2020 Q3 2020 Q4 2020 Q1 2021
Deliveries Net Absorption
Bouldin Creek
167,130 SF | South
Unico Properties
Austin Continuum
254,806 SF | North
Southwest Value Partners
ShadySide
64,674 SF | East
Saxum Real Estate
Seven Oaks West
130,152 SF | Southwest
Miller Global Properties
Eastlake at Tillery
172,423 SF | East
Cypress Real Estate Advisors
300 Colorado
353,938 SF | CBD
Cousins Properties
(1,500,000)
(1,000,000)
(500,000)
0
500,000
1,000,000
1,500,000
Q4 2019 Q1 2020 Q2 2020 Q3 2020 Q4 2020 Q1 2021
Deliveries Net Absorption
Supply & Absorption
Pandemic challenges forced many to shutter their doors
during the past year, and several brand-name institutions
(Google, Indeed, Facebook, etc.) found themselves
potentially over-committed on projects not yet under
construction. As a result. sublease space of +3.0M SF
flooded into the market, causing consecutive quarters of
negative absorption (Q1 2020 absorption of -630K SF).
With the introduction of a COVID vaccine, however, Austin
can expect a rebound in leasing activity and an upwards
trend in absorption levels, which should help relieve the
pressure from future development projects (+5.8M SF
under construction). Furthermore, Tesla’s Gigafactory
served as a de facto “Vote of Confidence”, spurring
additional commercial interest in the city.
Direct Lease Rates
A citywide asking rate of $45.60/SF comes in a slight step
above Q4 2020’s rate of $44.74/SF, largely due to rising
OpEx expenses. Although rental rates have remained
steady Quarter over quarter, Landlords aren’t hesitant to
use flexible concession packages and reduced lease-terms
in order to secure tenants. An influx of newly constructed
space with significant availability (as of Q1 2021), projects
under construction are ±40% leased) will pressure building
owners even further, however, a revitalization of leasing
activity should allow rates to remain steady during the
remainder of 2021.
Colliers | Austin | 21Q1 | Office Report
Office
Austin,
TX
21Q1
Upcoming Projects
Citywide Construction
52%
35%
5%
5%
3%
CBD
East
Far Northwest
Southwest
Central
0
500,000
1,000,000
1,500,000
2,000,000
2,500,000
3,000,000
3,500,000
4,000,000
Q2
2021
Q3
2021
Q4
2021
2022
2023
Leased Under Construction
405 Colorado
CBD
18% Leased
2Q '21
206,946
Indeed Tower
CBD
61% Leased
2Q '21
669,130
Austin Energy HQ
East
TBD
2Q '21
275,000
Domain Tower 2
North
TBD
3Q '21
330,000
405 Colorado
CBD
18% Leased
2Q '21
206,946
Indeed Tower
CBD
61% Leased
2Q '21
669,130
Austin Energy HQ
East
TBD
2Q '21
275,000
Domain Tower 2
North
TBD
3Q '21
330,000
RiverSouth
South
TBD
3Q '21
350,661
Indeed Tower
CBD
61% Leased
2Q '21
669,130
Austin Energy HQ
East
TBD
2Q '21
275,000
Domain Tower 2
North
TBD
3Q '21
330,000
RiverSouth
South
TBD
3Q '21
350,661
Block 185
CBD
100%
2022
796,525
Indeed Tower
CBD
61% Leased
2Q '21
669,130
Austin Energy HQ
East
TBD
2Q '21
275,000
Domain Tower 2
North
TBD
3Q '21
330,000
RiverSouth
South
TBD
3Q '21
350,661
Block 185
CBD
100%
2022
796,525
Austin Energy HQ
East
TBD
2Q '21
275,000
Domain Tower 2
North
TBD
3Q '21
330,000
RiverSouth
South
TBD
3Q '21
350,661
Block 185
CBD
100%
2022
796,525
Domain Tower 2
North
TBD
3Q '21
330,000
RiverSouth
South
TBD
3Q '21
350,661
Block 185
CBD
100%
2022
796,525
405 Colorado St.
Brandywine Realty
Trust
206,946 SF | CBD
Q2 2021 Delivery
14% Leased
Domain Tower 2
Stonelake Capital
Partners
330,000 SF | North
Q3 2021 Delivery
1% Leased
RiverSouth
Stream Realty
Partners
350,661 SF | South
Q3 2021 Delivery
22% Leased
Block 185
Trammel Crow
Company
796,525 SF | CBD
2023 Delivery
100% Leased
Austin Energy HQ
Catellus
Development Corp
275,000 SF | East
Q2 2021 Delivery
100% Leased
Indeed Tower
Trammell Crow
Company
669,130 SF | CBD
Q2 2021 Delivery
76% Leased
Q2 2021 Expected Deliveries
Copyright © 2021 Colliers
The information contained herein has been obtained from sources
deemed reliable. While every reasonable effort has been made to
ensure its accuracy, we cannot guarantee it. No responsibility is
assumed for any inaccuracies. Readers are encouraged to consult
their professional advisors prior to acting on any of the material
contained in this report.
FOR MORE INFORMATION
John O’Sullivan
Research Associate
Austin
+1 512 539 3012
john.o’sullivan@colliers.com
David Bremer
Managing Director
Austin
+1 512 539 3014
david.bremer@colliers.com
Submarket Existing Inventory (SF) Direct Vacancy (SF) Sublease Vacancy (SF) Overall Vacancy Rate
Quarterly Net
Absorption (SF)
Weighted Average
Asking Rate
Downtown
CBD 11,924,009 1,178,408 791,981 16.5% 65,505 $61.22
TOTAL 11,924,009 1,178,408 791,981 16.5% 65,505 $61.22
Market Total
CBD 11,924,009 1,178,408 791,981 16.5% 65,505 $61.22
Suburban 45,776,585 5,984,110 2,340,461 18.2% (694,425) $41.32
TOTAL 57,700,594 7,162,518 3,132,442 17.8% (628,920) $45.60
Suburban
Central & West Central 2,973,144 339,313 70,457 13.8% 34,312 $47.22
East 1,852,922 512,473 381,831 48.3% 15,568 $56.01
North / Domain 4,364,772 582,802 106,960 15.8% (98,679) $39.56
Northeast 2,649,981 573,504 119,636 26.2% (96,630) $36.52
Far Northwest 4,264,803 536,436 162,377 16.4% (61,936) $40.02
Northwest 12,903,660 1,544,639 846,869 18.5% (334,935) $38.02
Round Rock 1,439,707 145,510 37,271 12.7% (6,184) $34.18
South 1,769,268 474,287 35,909 28.8% 17,253 $51.40
Southeast 2,177,582 258,619 8,000 12.2% (6,531) $34.89
Southwest 11,380,746 1,016,527 571,151 14.0% (156,663) $43.96
TOTAL 45,776,585 5,984,110 2,340,461 18.2% (694,425) $41.32
Austin | Q1 2021 | Office | Market Statistics

More Related Content

What's hot

JLL Louisville Industrial Outlook - Q4 2019
JLL Louisville Industrial Outlook - Q4 2019JLL Louisville Industrial Outlook - Q4 2019
JLL Louisville Industrial Outlook - Q4 2019Alex Westcott
 
JLL Cleveland Industrial Outlook: Q4 2017
JLL Cleveland Industrial Outlook: Q4 2017JLL Cleveland Industrial Outlook: Q4 2017
JLL Cleveland Industrial Outlook: Q4 2017Andrew Batson
 
Q1 2017 Austin Industrial Research & Forecast Report
Q1 2017 Austin Industrial Research & Forecast Report Q1 2017 Austin Industrial Research & Forecast Report
Q1 2017 Austin Industrial Research & Forecast Report Kaitlin Holm
 
Jll cincinnati office outlook q1 2017
Jll cincinnati office outlook   q1 2017Jll cincinnati office outlook   q1 2017
Jll cincinnati office outlook q1 2017Abby Armbruster
 
JLL Pittsburgh Office Insight & Statistics - Q3 2021
JLL Pittsburgh Office Insight & Statistics - Q3 2021JLL Pittsburgh Office Insight & Statistics - Q3 2021
JLL Pittsburgh Office Insight & Statistics - Q3 2021Tobiah Bilski
 
JLL Pittsburgh Industrial Insight & Statistics - Q2 2021
JLL Pittsburgh Industrial Insight & Statistics - Q2 2021JLL Pittsburgh Industrial Insight & Statistics - Q2 2021
JLL Pittsburgh Industrial Insight & Statistics - Q2 2021Tobiah Bilski
 
Q4 2015 Austin Office Market Research & Forecast Report
Q4 2015 Austin Office Market Research & Forecast ReportQ4 2015 Austin Office Market Research & Forecast Report
Q4 2015 Austin Office Market Research & Forecast ReportLisa Bridges
 
JLL Cleveland Industrial Outlook: Q3 2018
JLL Cleveland Industrial Outlook: Q3 2018JLL Cleveland Industrial Outlook: Q3 2018
JLL Cleveland Industrial Outlook: Q3 2018Andrew Batson
 
JLL Pittsburgh Industrial Insight & Statistics - Q3 2021
JLL Pittsburgh Industrial Insight & Statistics - Q3 2021JLL Pittsburgh Industrial Insight & Statistics - Q3 2021
JLL Pittsburgh Industrial Insight & Statistics - Q3 2021Tobiah Bilski
 
JLL Pittsburgh Office Outlook - Q4 2015
JLL Pittsburgh Office Outlook - Q4 2015JLL Pittsburgh Office Outlook - Q4 2015
JLL Pittsburgh Office Outlook - Q4 2015Andrew Batson
 
Austin’s industrial market closes 2018 with new buildings and high absorption
Austin’s industrial market closes 2018 with new buildings and high absorptionAustin’s industrial market closes 2018 with new buildings and high absorption
Austin’s industrial market closes 2018 with new buildings and high absorptionColliers International | Houston
 
JLL Cleveland Industrial Outlook: Q4 2016
JLL Cleveland Industrial Outlook: Q4 2016JLL Cleveland Industrial Outlook: Q4 2016
JLL Cleveland Industrial Outlook: Q4 2016Andrew Batson
 
JLL Pittsburgh Industrial Insight & Statistics - Q3 2017
JLL Pittsburgh Industrial Insight & Statistics - Q3 2017JLL Pittsburgh Industrial Insight & Statistics - Q3 2017
JLL Pittsburgh Industrial Insight & Statistics - Q3 2017Tobiah Bilski
 

What's hot (19)

JLL Louisville Industrial Outlook - Q4 2019
JLL Louisville Industrial Outlook - Q4 2019JLL Louisville Industrial Outlook - Q4 2019
JLL Louisville Industrial Outlook - Q4 2019
 
JLL Cleveland Industrial Outlook: Q4 2017
JLL Cleveland Industrial Outlook: Q4 2017JLL Cleveland Industrial Outlook: Q4 2017
JLL Cleveland Industrial Outlook: Q4 2017
 
Q2 2021 Austin Industrial Report
Q2 2021 Austin Industrial ReportQ2 2021 Austin Industrial Report
Q2 2021 Austin Industrial Report
 
Q1 2017 Austin Industrial Research & Forecast Report
Q1 2017 Austin Industrial Research & Forecast Report Q1 2017 Austin Industrial Research & Forecast Report
Q1 2017 Austin Industrial Research & Forecast Report
 
Jll cincinnati office outlook q1 2017
Jll cincinnati office outlook   q1 2017Jll cincinnati office outlook   q1 2017
Jll cincinnati office outlook q1 2017
 
JLL Pittsburgh Office Insight & Statistics - Q3 2021
JLL Pittsburgh Office Insight & Statistics - Q3 2021JLL Pittsburgh Office Insight & Statistics - Q3 2021
JLL Pittsburgh Office Insight & Statistics - Q3 2021
 
JLL Pittsburgh Industrial Insight & Statistics - Q2 2021
JLL Pittsburgh Industrial Insight & Statistics - Q2 2021JLL Pittsburgh Industrial Insight & Statistics - Q2 2021
JLL Pittsburgh Industrial Insight & Statistics - Q2 2021
 
Q2 2017 Austin Industrial Research & Forecast Report
Q2 2017 Austin Industrial Research & Forecast Report Q2 2017 Austin Industrial Research & Forecast Report
Q2 2017 Austin Industrial Research & Forecast Report
 
Q4 2015 Austin Office Market Research & Forecast Report
Q4 2015 Austin Office Market Research & Forecast ReportQ4 2015 Austin Office Market Research & Forecast Report
Q4 2015 Austin Office Market Research & Forecast Report
 
Q4 2015 Austin Office Market Research & Forecast Report
Q4 2015 Austin Office Market Research & Forecast ReportQ4 2015 Austin Office Market Research & Forecast Report
Q4 2015 Austin Office Market Research & Forecast Report
 
JLL Cleveland Industrial Outlook: Q3 2018
JLL Cleveland Industrial Outlook: Q3 2018JLL Cleveland Industrial Outlook: Q3 2018
JLL Cleveland Industrial Outlook: Q3 2018
 
JLL Pittsburgh Industrial Insight & Statistics - Q3 2021
JLL Pittsburgh Industrial Insight & Statistics - Q3 2021JLL Pittsburgh Industrial Insight & Statistics - Q3 2021
JLL Pittsburgh Industrial Insight & Statistics - Q3 2021
 
Q1 2018 austin_industrial_market_research_report
Q1 2018 austin_industrial_market_research_reportQ1 2018 austin_industrial_market_research_report
Q1 2018 austin_industrial_market_research_report
 
JLL Pittsburgh Office Outlook - Q4 2015
JLL Pittsburgh Office Outlook - Q4 2015JLL Pittsburgh Office Outlook - Q4 2015
JLL Pittsburgh Office Outlook - Q4 2015
 
Austin’s industrial market closes 2018 with new buildings and high absorption
Austin’s industrial market closes 2018 with new buildings and high absorptionAustin’s industrial market closes 2018 with new buildings and high absorption
Austin’s industrial market closes 2018 with new buildings and high absorption
 
Q4 2019 | Austin Office | Research & Forecast Report
Q4 2019 | Austin Office | Research & Forecast ReportQ4 2019 | Austin Office | Research & Forecast Report
Q4 2019 | Austin Office | Research & Forecast Report
 
Q3 2020 | Austin Industrial | Research & Forecast Report
Q3 2020 | Austin Industrial | Research & Forecast ReportQ3 2020 | Austin Industrial | Research & Forecast Report
Q3 2020 | Austin Industrial | Research & Forecast Report
 
JLL Cleveland Industrial Outlook: Q4 2016
JLL Cleveland Industrial Outlook: Q4 2016JLL Cleveland Industrial Outlook: Q4 2016
JLL Cleveland Industrial Outlook: Q4 2016
 
JLL Pittsburgh Industrial Insight & Statistics - Q3 2017
JLL Pittsburgh Industrial Insight & Statistics - Q3 2017JLL Pittsburgh Industrial Insight & Statistics - Q3 2017
JLL Pittsburgh Industrial Insight & Statistics - Q3 2017
 

Similar to Q1 2021 Austin Office Report

Q1 2021 | Austin Industrial | Research & Forecast Commericial Real Estate Report
Q1 2021 | Austin Industrial | Research & Forecast Commericial Real Estate ReportQ1 2021 | Austin Industrial | Research & Forecast Commericial Real Estate Report
Q1 2021 | Austin Industrial | Research & Forecast Commericial Real Estate ReportColliers International | Houston
 
JLL Cincinnati Office Outlook Q4 2020
JLL Cincinnati Office Outlook Q4 2020JLL Cincinnati Office Outlook Q4 2020
JLL Cincinnati Office Outlook Q4 2020Abby Armbruster
 
JLL Cincinnati Office Insight & Statistics - Q3 2016
JLL Cincinnati Office Insight & Statistics - Q3 2016JLL Cincinnati Office Insight & Statistics - Q3 2016
JLL Cincinnati Office Insight & Statistics - Q3 2016Ross Bratcher
 
JLL Cincinnati Office Insight & Statistics - Q2 2016
JLL Cincinnati Office Insight & Statistics - Q2 2016JLL Cincinnati Office Insight & Statistics - Q2 2016
JLL Cincinnati Office Insight & Statistics - Q2 2016Ross Bratcher
 
Savillsresearch briefing-brisbane-cbd-office-q2-2019
Savillsresearch briefing-brisbane-cbd-office-q2-2019Savillsresearch briefing-brisbane-cbd-office-q2-2019
Savillsresearch briefing-brisbane-cbd-office-q2-2019Tracy Tam
 
Jll cincinnati office outlook q2 2017
Jll cincinnati office outlook   q2 2017Jll cincinnati office outlook   q2 2017
Jll cincinnati office outlook q2 2017Abby Armbruster
 
JLL Cincinnati Office Outlook Q2 2020
JLL Cincinnati Office Outlook Q2 2020JLL Cincinnati Office Outlook Q2 2020
JLL Cincinnati Office Outlook Q2 2020Abby Armbruster
 
JLL Cleveland Office Outlook: Q1 2018
JLL Cleveland Office Outlook: Q1 2018JLL Cleveland Office Outlook: Q1 2018
JLL Cleveland Office Outlook: Q1 2018Andrew Batson
 
JLL Cleveland Office Outlook: Q1 2018
JLL Cleveland Office Outlook: Q1 2018JLL Cleveland Office Outlook: Q1 2018
JLL Cleveland Office Outlook: Q1 2018Andrew Batson
 
JLL Cleveland Industrial Outlook: Q4 2020
JLL Cleveland Industrial Outlook: Q4 2020JLL Cleveland Industrial Outlook: Q4 2020
JLL Cleveland Industrial Outlook: Q4 2020Andrew Batson
 
Pittsburgh Office Insight & Stats Q1 2022
Pittsburgh Office Insight & Stats Q1 2022Pittsburgh Office Insight & Stats Q1 2022
Pittsburgh Office Insight & Stats Q1 2022Tobiah Bilski
 
JLL Cleveland Industrial Outlook: Q4 2018
JLL Cleveland Industrial Outlook: Q4 2018JLL Cleveland Industrial Outlook: Q4 2018
JLL Cleveland Industrial Outlook: Q4 2018Andrew Batson
 
Q4 2014 san_francisco_office
Q4 2014 san_francisco_officeQ4 2014 san_francisco_office
Q4 2014 san_francisco_officeCoy Davidson
 
Q4 2014 San Francisco Office Report
Q4 2014 San Francisco Office ReportQ4 2014 San Francisco Office Report
Q4 2014 San Francisco Office ReportCoy Davidson
 
JLL Cleveland Industrial Outlook: Q4 2018
JLL Cleveland Industrial Outlook: Q4 2018JLL Cleveland Industrial Outlook: Q4 2018
JLL Cleveland Industrial Outlook: Q4 2018Andrew Batson
 

Similar to Q1 2021 Austin Office Report (20)

Q1 2021 | Austin Industrial | Research & Forecast Commericial Real Estate Report
Q1 2021 | Austin Industrial | Research & Forecast Commericial Real Estate ReportQ1 2021 | Austin Industrial | Research & Forecast Commericial Real Estate Report
Q1 2021 | Austin Industrial | Research & Forecast Commericial Real Estate Report
 
JLL Cincinnati Office Outlook Q4 2020
JLL Cincinnati Office Outlook Q4 2020JLL Cincinnati Office Outlook Q4 2020
JLL Cincinnati Office Outlook Q4 2020
 
JLL Cincinnati Office Insight & Statistics - Q3 2016
JLL Cincinnati Office Insight & Statistics - Q3 2016JLL Cincinnati Office Insight & Statistics - Q3 2016
JLL Cincinnati Office Insight & Statistics - Q3 2016
 
Q1 2022 Austin Office Market Report
Q1 2022 Austin Office Market ReportQ1 2022 Austin Office Market Report
Q1 2022 Austin Office Market Report
 
JLL Cincinnati Office Insight & Statistics - Q2 2016
JLL Cincinnati Office Insight & Statistics - Q2 2016JLL Cincinnati Office Insight & Statistics - Q2 2016
JLL Cincinnati Office Insight & Statistics - Q2 2016
 
Q4 2020 Austin Office Report
Q4 2020 Austin Office ReportQ4 2020 Austin Office Report
Q4 2020 Austin Office Report
 
Savillsresearch briefing-brisbane-cbd-office-q2-2019
Savillsresearch briefing-brisbane-cbd-office-q2-2019Savillsresearch briefing-brisbane-cbd-office-q2-2019
Savillsresearch briefing-brisbane-cbd-office-q2-2019
 
Jll cincinnati office outlook q2 2017
Jll cincinnati office outlook   q2 2017Jll cincinnati office outlook   q2 2017
Jll cincinnati office outlook q2 2017
 
Q1 2022 Austin Industrial Report
Q1 2022 Austin Industrial ReportQ1 2022 Austin Industrial Report
Q1 2022 Austin Industrial Report
 
JLL Cincinnati Office Outlook Q2 2020
JLL Cincinnati Office Outlook Q2 2020JLL Cincinnati Office Outlook Q2 2020
JLL Cincinnati Office Outlook Q2 2020
 
JLL Cleveland Office Outlook: Q1 2018
JLL Cleveland Office Outlook: Q1 2018JLL Cleveland Office Outlook: Q1 2018
JLL Cleveland Office Outlook: Q1 2018
 
JLL Cleveland Office Outlook: Q1 2018
JLL Cleveland Office Outlook: Q1 2018JLL Cleveland Office Outlook: Q1 2018
JLL Cleveland Office Outlook: Q1 2018
 
Q1 2020 | Austin Office | Research & Forecast Report
Q1 2020 | Austin Office | Research & Forecast ReportQ1 2020 | Austin Office | Research & Forecast Report
Q1 2020 | Austin Office | Research & Forecast Report
 
JLL Cleveland Industrial Outlook: Q4 2020
JLL Cleveland Industrial Outlook: Q4 2020JLL Cleveland Industrial Outlook: Q4 2020
JLL Cleveland Industrial Outlook: Q4 2020
 
Q2 2017 | Austin Office | Research & Forecast Report
Q2 2017 | Austin Office | Research & Forecast ReportQ2 2017 | Austin Office | Research & Forecast Report
Q2 2017 | Austin Office | Research & Forecast Report
 
Pittsburgh Office Insight & Stats Q1 2022
Pittsburgh Office Insight & Stats Q1 2022Pittsburgh Office Insight & Stats Q1 2022
Pittsburgh Office Insight & Stats Q1 2022
 
JLL Cleveland Industrial Outlook: Q4 2018
JLL Cleveland Industrial Outlook: Q4 2018JLL Cleveland Industrial Outlook: Q4 2018
JLL Cleveland Industrial Outlook: Q4 2018
 
Q4 2014 san_francisco_office
Q4 2014 san_francisco_officeQ4 2014 san_francisco_office
Q4 2014 san_francisco_office
 
Q4 2014 San Francisco Office Report
Q4 2014 San Francisco Office ReportQ4 2014 San Francisco Office Report
Q4 2014 San Francisco Office Report
 
JLL Cleveland Industrial Outlook: Q4 2018
JLL Cleveland Industrial Outlook: Q4 2018JLL Cleveland Industrial Outlook: Q4 2018
JLL Cleveland Industrial Outlook: Q4 2018
 

More from Colliers International | Houston

2019 | Year-End Texas Seniors Housing & Care | Research & Forecast Report
2019 | Year-End Texas Seniors Housing & Care | Research & Forecast Report2019 | Year-End Texas Seniors Housing & Care | Research & Forecast Report
2019 | Year-End Texas Seniors Housing & Care | Research & Forecast ReportColliers International | Houston
 

More from Colliers International | Houston (19)

Colliers Q4 2020 Austin Industrial Report
Colliers Q4 2020 Austin Industrial ReportColliers Q4 2020 Austin Industrial Report
Colliers Q4 2020 Austin Industrial Report
 
Q4 2020 | Houston Office | Research & Forecast Report
Q4 2020 | Houston Office | Research & Forecast ReportQ4 2020 | Houston Office | Research & Forecast Report
Q4 2020 | Houston Office | Research & Forecast Report
 
Q3 2020 | The Woodlands Office | Research Snapshot
Q3 2020 | The Woodlands Office | Research SnapshotQ3 2020 | The Woodlands Office | Research Snapshot
Q3 2020 | The Woodlands Office | Research Snapshot
 
Q3 2020 | Fort Bend | Submarket Snapshot
Q3 2020 | Fort Bend | Submarket SnapshotQ3 2020 | Fort Bend | Submarket Snapshot
Q3 2020 | Fort Bend | Submarket Snapshot
 
Q3 2020 | Austin Office | Research & Forecast Report
Q3 2020 | Austin Office | Research & Forecast ReportQ3 2020 | Austin Office | Research & Forecast Report
Q3 2020 | Austin Office | Research & Forecast Report
 
Q3 2020 | Houston Office | Research & Forecast Report
Q3 2020 | Houston Office | Research & Forecast ReportQ3 2020 | Houston Office | Research & Forecast Report
Q3 2020 | Houston Office | Research & Forecast Report
 
Q2 2020 | The Woodlands Office | Research Snapshot
Q2 2020 | The Woodlands Office | Research SnapshotQ2 2020 | The Woodlands Office | Research Snapshot
Q2 2020 | The Woodlands Office | Research Snapshot
 
Q2 2020 | E Fort Bend Commercial Real Estate Trends
Q2 2020 | E Fort Bend Commercial Real Estate TrendsQ2 2020 | E Fort Bend Commercial Real Estate Trends
Q2 2020 | E Fort Bend Commercial Real Estate Trends
 
Mid-Year 2020 | Houston Healthcare | Market Report
Mid-Year 2020 | Houston Healthcare | Market ReportMid-Year 2020 | Houston Healthcare | Market Report
Mid-Year 2020 | Houston Healthcare | Market Report
 
Q2 2020 | Austin Office | Research & Forecast Report
Q2 2020 | Austin Office | Research & Forecast ReportQ2 2020 | Austin Office | Research & Forecast Report
Q2 2020 | Austin Office | Research & Forecast Report
 
Q1 2020 | The Woodlands Office | Research Snapshot
Q1 2020 | The Woodlands Office | Research SnapshotQ1 2020 | The Woodlands Office | Research Snapshot
Q1 2020 | The Woodlands Office | Research Snapshot
 
Q1 2020 | Fort Bend Submarket Snapshot
Q1 2020 | Fort Bend Submarket SnapshotQ1 2020 | Fort Bend Submarket Snapshot
Q1 2020 | Fort Bend Submarket Snapshot
 
Q1 2020 | Houston Retail | Research & Forecast Report
Q1 2020 | Houston Retail | Research & Forecast ReportQ1 2020 | Houston Retail | Research & Forecast Report
Q1 2020 | Houston Retail | Research & Forecast Report
 
Q1 2020 | Houston Industrial Market Report
Q1 2020 | Houston Industrial Market ReportQ1 2020 | Houston Industrial Market Report
Q1 2020 | Houston Industrial Market Report
 
2019 | Year-End Texas Seniors Housing & Care | Research & Forecast Report
2019 | Year-End Texas Seniors Housing & Care | Research & Forecast Report2019 | Year-End Texas Seniors Housing & Care | Research & Forecast Report
2019 | Year-End Texas Seniors Housing & Care | Research & Forecast Report
 
Q4 2019 | E Fort Bend Commercial Real Estate Trends
Q4 2019 | E Fort Bend Commercial Real Estate TrendsQ4 2019 | E Fort Bend Commercial Real Estate Trends
Q4 2019 | E Fort Bend Commercial Real Estate Trends
 
2019 | Year-End Houston Healthcare Market Report
2019 | Year-End Houston Healthcare Market Report2019 | Year-End Houston Healthcare Market Report
2019 | Year-End Houston Healthcare Market Report
 
Q4 2019 | Houston Industrial | Research & Forecast Report
Q4 2019 | Houston Industrial  | Research & Forecast ReportQ4 2019 | Houston Industrial  | Research & Forecast Report
Q4 2019 | Houston Industrial | Research & Forecast Report
 
Q3 2019 | Austin Industrial | Research & Forecast Report
Q3 2019 | Austin Industrial | Research & Forecast ReportQ3 2019 | Austin Industrial | Research & Forecast Report
Q3 2019 | Austin Industrial | Research & Forecast Report
 

Recently uploaded

Low Rate Call Girls in Akshardham Delhi Call 9990771857
Low Rate Call Girls in Akshardham   Delhi Call 9990771857Low Rate Call Girls in Akshardham   Delhi Call 9990771857
Low Rate Call Girls in Akshardham Delhi Call 9990771857delhimodel235
 
The Omaxe State Dwarka Delhi-broucher.pdf.pdf
The Omaxe State Dwarka Delhi-broucher.pdf.pdfThe Omaxe State Dwarka Delhi-broucher.pdf.pdf
The Omaxe State Dwarka Delhi-broucher.pdf.pdfkratirudram
 
Low Rate Call Girls in Triveni Complex Delhi Call 9990771857
Low Rate Call Girls in Triveni Complex Delhi Call 9990771857Low Rate Call Girls in Triveni Complex Delhi Call 9990771857
Low Rate Call Girls in Triveni Complex Delhi Call 9990771857delhimodel235
 
Call Girls In Hari Nagar Dadb Block {8447779280}Hari Nagar {West Delhi Escort...
Call Girls In Hari Nagar Dadb Block {8447779280}Hari Nagar {West Delhi Escort...Call Girls In Hari Nagar Dadb Block {8447779280}Hari Nagar {West Delhi Escort...
Call Girls In Hari Nagar Dadb Block {8447779280}Hari Nagar {West Delhi Escort...asmaqueen5
 
Call Girls in Nehru Place Delhi 💯Call Us 🔝8264348440🔝
Call Girls in Nehru Place Delhi 💯Call Us 🔝8264348440🔝Call Girls in Nehru Place Delhi 💯Call Us 🔝8264348440🔝
Call Girls in Nehru Place Delhi 💯Call Us 🔝8264348440🔝soniya singh
 
Aparna Greenscapes Kompally Hyderabad E - Brochure.pdf
Aparna Greenscapes Kompally Hyderabad E - Brochure.pdfAparna Greenscapes Kompally Hyderabad E - Brochure.pdf
Aparna Greenscapes Kompally Hyderabad E - Brochure.pdffaheemali990101
 
Call Girls in Kashmiri Gate Delhi 💯Call Us 🔝8264348440🔝
Call Girls in Kashmiri Gate Delhi 💯Call Us 🔝8264348440🔝Call Girls in Kashmiri Gate Delhi 💯Call Us 🔝8264348440🔝
Call Girls in Kashmiri Gate Delhi 💯Call Us 🔝8264348440🔝soniya singh
 
9990771857 Call Girls in Noida Sector 10 Noida (Call Girls) Delhi
9990771857 Call Girls in Noida Sector 10 Noida (Call Girls) Delhi9990771857 Call Girls in Noida Sector 10 Noida (Call Girls) Delhi
9990771857 Call Girls in Noida Sector 10 Noida (Call Girls) Delhidelhimodel235
 
Rustomjee The Panorama At Pali Hill, Bandra West, Mumbai - Brochure.pdf
Rustomjee The Panorama At Pali Hill, Bandra West, Mumbai - Brochure.pdfRustomjee The Panorama At Pali Hill, Bandra West, Mumbai - Brochure.pdf
Rustomjee The Panorama At Pali Hill, Bandra West, Mumbai - Brochure.pdfmonikasharma630
 
Call Girls in Sarai Kale Khan Delhi 💯Call Us 🔝8264348440🔝
Call Girls in Sarai Kale Khan Delhi 💯Call Us 🔝8264348440🔝Call Girls in Sarai Kale Khan Delhi 💯Call Us 🔝8264348440🔝
Call Girls in Sarai Kale Khan Delhi 💯Call Us 🔝8264348440🔝soniya singh
 
Call Girls in Inderpuri Delhi 💯Call Us 🔝8264348440🔝
Call Girls in Inderpuri Delhi 💯Call Us 🔝8264348440🔝Call Girls in Inderpuri Delhi 💯Call Us 🔝8264348440🔝
Call Girls in Inderpuri Delhi 💯Call Us 🔝8264348440🔝soniya singh
 
9990771857 Call Girls in Noida Sector 06 Noida (Call Girls) Delhi
9990771857 Call Girls in Noida Sector 06 Noida (Call Girls) Delhi9990771857 Call Girls in Noida Sector 06 Noida (Call Girls) Delhi
9990771857 Call Girls in Noida Sector 06 Noida (Call Girls) Delhidelhimodel235
 
Low Rate Call Girls in Trilokpuri Delhi Call 9990771857
Low Rate Call Girls in Trilokpuri Delhi Call 9990771857Low Rate Call Girls in Trilokpuri Delhi Call 9990771857
Low Rate Call Girls in Trilokpuri Delhi Call 9990771857delhimodel235
 
Call Girls In Vasant Vihar Delhi 💯Call Us 🔝8264348440🔝
Call Girls In Vasant Vihar Delhi 💯Call Us 🔝8264348440🔝Call Girls In Vasant Vihar Delhi 💯Call Us 🔝8264348440🔝
Call Girls In Vasant Vihar Delhi 💯Call Us 🔝8264348440🔝soniya singh
 
9990771857 Call Girls in Noida Sector 1 Noida (Call Girls) Delhi
9990771857 Call Girls in Noida Sector 1 Noida (Call Girls) Delhi9990771857 Call Girls in Noida Sector 1 Noida (Call Girls) Delhi
9990771857 Call Girls in Noida Sector 1 Noida (Call Girls) Delhidelhimodel235
 
Call Girls in Janakpuri ↫8447779280↫Short 1500 Night 6000-Escorts Service In ...
Call Girls in Janakpuri ↫8447779280↫Short 1500 Night 6000-Escorts Service In ...Call Girls in Janakpuri ↫8447779280↫Short 1500 Night 6000-Escorts Service In ...
Call Girls in Janakpuri ↫8447779280↫Short 1500 Night 6000-Escorts Service In ...asmaqueen5
 
83770-87607 ۞Call Girls In Near The Park Hotel (Cp) Delhi
83770-87607 ۞Call Girls In Near The Park Hotel (Cp) Delhi83770-87607 ۞Call Girls In Near The Park Hotel (Cp) Delhi
83770-87607 ۞Call Girls In Near The Park Hotel (Cp) Delhidollysharma2066
 
How to Build Multifamily and Laneway Suites in Toronto!! (feat. Expert Archi...
How to Build Multifamily and Laneway Suites  in Toronto!! (feat. Expert Archi...How to Build Multifamily and Laneway Suites  in Toronto!! (feat. Expert Archi...
How to Build Multifamily and Laneway Suites in Toronto!! (feat. Expert Archi...Volition Properties
 
Call Girls Janta Market {Delhi//8447779280)) ₹↬Short 2000 Full Night 5500 ↫Es...
Call Girls Janta Market {Delhi//8447779280)) ₹↬Short 2000 Full Night 5500 ↫Es...Call Girls Janta Market {Delhi//8447779280)) ₹↬Short 2000 Full Night 5500 ↫Es...
Call Girls Janta Market {Delhi//8447779280)) ₹↬Short 2000 Full Night 5500 ↫Es...asmaqueen5
 

Recently uploaded (20)

Low Rate Call Girls in Akshardham Delhi Call 9990771857
Low Rate Call Girls in Akshardham   Delhi Call 9990771857Low Rate Call Girls in Akshardham   Delhi Call 9990771857
Low Rate Call Girls in Akshardham Delhi Call 9990771857
 
The Omaxe State Dwarka Delhi-broucher.pdf.pdf
The Omaxe State Dwarka Delhi-broucher.pdf.pdfThe Omaxe State Dwarka Delhi-broucher.pdf.pdf
The Omaxe State Dwarka Delhi-broucher.pdf.pdf
 
Low Rate Call Girls in Triveni Complex Delhi Call 9990771857
Low Rate Call Girls in Triveni Complex Delhi Call 9990771857Low Rate Call Girls in Triveni Complex Delhi Call 9990771857
Low Rate Call Girls in Triveni Complex Delhi Call 9990771857
 
Call Girls In Hari Nagar Dadb Block {8447779280}Hari Nagar {West Delhi Escort...
Call Girls In Hari Nagar Dadb Block {8447779280}Hari Nagar {West Delhi Escort...Call Girls In Hari Nagar Dadb Block {8447779280}Hari Nagar {West Delhi Escort...
Call Girls In Hari Nagar Dadb Block {8447779280}Hari Nagar {West Delhi Escort...
 
Call Girls in Nehru Place Delhi 💯Call Us 🔝8264348440🔝
Call Girls in Nehru Place Delhi 💯Call Us 🔝8264348440🔝Call Girls in Nehru Place Delhi 💯Call Us 🔝8264348440🔝
Call Girls in Nehru Place Delhi 💯Call Us 🔝8264348440🔝
 
Low Rate Call Girls in Triveni Complex Delhi Call 9873940964
Low Rate Call Girls in Triveni Complex Delhi Call 9873940964Low Rate Call Girls in Triveni Complex Delhi Call 9873940964
Low Rate Call Girls in Triveni Complex Delhi Call 9873940964
 
Aparna Greenscapes Kompally Hyderabad E - Brochure.pdf
Aparna Greenscapes Kompally Hyderabad E - Brochure.pdfAparna Greenscapes Kompally Hyderabad E - Brochure.pdf
Aparna Greenscapes Kompally Hyderabad E - Brochure.pdf
 
Call Girls in Kashmiri Gate Delhi 💯Call Us 🔝8264348440🔝
Call Girls in Kashmiri Gate Delhi 💯Call Us 🔝8264348440🔝Call Girls in Kashmiri Gate Delhi 💯Call Us 🔝8264348440🔝
Call Girls in Kashmiri Gate Delhi 💯Call Us 🔝8264348440🔝
 
9990771857 Call Girls in Noida Sector 10 Noida (Call Girls) Delhi
9990771857 Call Girls in Noida Sector 10 Noida (Call Girls) Delhi9990771857 Call Girls in Noida Sector 10 Noida (Call Girls) Delhi
9990771857 Call Girls in Noida Sector 10 Noida (Call Girls) Delhi
 
Rustomjee The Panorama At Pali Hill, Bandra West, Mumbai - Brochure.pdf
Rustomjee The Panorama At Pali Hill, Bandra West, Mumbai - Brochure.pdfRustomjee The Panorama At Pali Hill, Bandra West, Mumbai - Brochure.pdf
Rustomjee The Panorama At Pali Hill, Bandra West, Mumbai - Brochure.pdf
 
Call Girls in Sarai Kale Khan Delhi 💯Call Us 🔝8264348440🔝
Call Girls in Sarai Kale Khan Delhi 💯Call Us 🔝8264348440🔝Call Girls in Sarai Kale Khan Delhi 💯Call Us 🔝8264348440🔝
Call Girls in Sarai Kale Khan Delhi 💯Call Us 🔝8264348440🔝
 
Call Girls in Inderpuri Delhi 💯Call Us 🔝8264348440🔝
Call Girls in Inderpuri Delhi 💯Call Us 🔝8264348440🔝Call Girls in Inderpuri Delhi 💯Call Us 🔝8264348440🔝
Call Girls in Inderpuri Delhi 💯Call Us 🔝8264348440🔝
 
9990771857 Call Girls in Noida Sector 06 Noida (Call Girls) Delhi
9990771857 Call Girls in Noida Sector 06 Noida (Call Girls) Delhi9990771857 Call Girls in Noida Sector 06 Noida (Call Girls) Delhi
9990771857 Call Girls in Noida Sector 06 Noida (Call Girls) Delhi
 
Low Rate Call Girls in Trilokpuri Delhi Call 9990771857
Low Rate Call Girls in Trilokpuri Delhi Call 9990771857Low Rate Call Girls in Trilokpuri Delhi Call 9990771857
Low Rate Call Girls in Trilokpuri Delhi Call 9990771857
 
Call Girls In Vasant Vihar Delhi 💯Call Us 🔝8264348440🔝
Call Girls In Vasant Vihar Delhi 💯Call Us 🔝8264348440🔝Call Girls In Vasant Vihar Delhi 💯Call Us 🔝8264348440🔝
Call Girls In Vasant Vihar Delhi 💯Call Us 🔝8264348440🔝
 
9990771857 Call Girls in Noida Sector 1 Noida (Call Girls) Delhi
9990771857 Call Girls in Noida Sector 1 Noida (Call Girls) Delhi9990771857 Call Girls in Noida Sector 1 Noida (Call Girls) Delhi
9990771857 Call Girls in Noida Sector 1 Noida (Call Girls) Delhi
 
Call Girls in Janakpuri ↫8447779280↫Short 1500 Night 6000-Escorts Service In ...
Call Girls in Janakpuri ↫8447779280↫Short 1500 Night 6000-Escorts Service In ...Call Girls in Janakpuri ↫8447779280↫Short 1500 Night 6000-Escorts Service In ...
Call Girls in Janakpuri ↫8447779280↫Short 1500 Night 6000-Escorts Service In ...
 
83770-87607 ۞Call Girls In Near The Park Hotel (Cp) Delhi
83770-87607 ۞Call Girls In Near The Park Hotel (Cp) Delhi83770-87607 ۞Call Girls In Near The Park Hotel (Cp) Delhi
83770-87607 ۞Call Girls In Near The Park Hotel (Cp) Delhi
 
How to Build Multifamily and Laneway Suites in Toronto!! (feat. Expert Archi...
How to Build Multifamily and Laneway Suites  in Toronto!! (feat. Expert Archi...How to Build Multifamily and Laneway Suites  in Toronto!! (feat. Expert Archi...
How to Build Multifamily and Laneway Suites in Toronto!! (feat. Expert Archi...
 
Call Girls Janta Market {Delhi//8447779280)) ₹↬Short 2000 Full Night 5500 ↫Es...
Call Girls Janta Market {Delhi//8447779280)) ₹↬Short 2000 Full Night 5500 ↫Es...Call Girls Janta Market {Delhi//8447779280)) ₹↬Short 2000 Full Night 5500 ↫Es...
Call Girls Janta Market {Delhi//8447779280)) ₹↬Short 2000 Full Night 5500 ↫Es...
 

Q1 2021 Austin Office Report

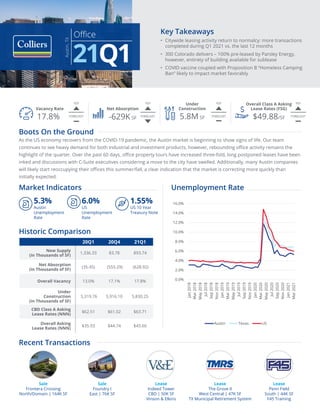
  • 1. 20Q1 20Q4 21Q1 New Supply (in Thousands of SF) 1,336.33 83.78 893.74 Net Absorption (in Thousands of SF) (35.45) (555.29) (628.92) Overall Vacancy 13.0% 17.1% 17.8% Under Construction (in Thousands of SF) 5,319.76 5,916.10 5,830.25 CBD Class A Asking Lease Rates (NNN) $62.51 $61.02 $63.71 Overall Asking Lease Rates (NNN) $35.93 $44.74 $45.60 Sale Frontera Crossing North/Domain | 164K SF Lease The Grove II West Central | 47K SF TX Municipal Retirement System Lease Penn Field South | 44K SF F45 Training Sale Foundry I East | 76K SF Lease Indeed Tower CBD | 50K SF Vinson & Elkins YOY FORECAST YOY YOY FORECAST YOY FORECAST FORECAST Office Austin, TX 21Q1 Boots On the Ground As the US economy recovers from the COVID-19 pandemic, the Austin market is beginning to show signs of life. Our team continues to see heavy demand for both industrial and investment products, however, rebounding office activity remains the highlight of the quarter. Over the past 60 days, office property tours have increased three-fold, long postponed leases have been inked and discussions with C-Suite executives considering a move to the city have swelled. Additionally, many Austin companies will likely start reoccupying their offices this summer/fall, a clear indication that the market is correcting more quickly than initially expected. Unemployment Rate Market Indicators Historic Comparison 5.3% Austin Unemployment Rate 1.55% US 10 Year Treasury Note 6.0% US Unemployment Rate Vacancy Rate 17.8% Net Absorption -629K SF Overall Class A Asking Lease Rates (FSG) $49.88/SF Under Construction 5.8M SF Key Takeaways • Citywide leasing activity return to normalcy: more transactions completed during Q1 2021 vs. the last 12 months • 300 Colorado delivers – 100% pre-leased by Parsley Energy, however, entirety of building available for sublease • COVID vaccine coupled with Proposition B “Homeless Camping Ban” likely to impact market favorably Recent Transactions 0.0% 2.0% 4.0% 6.0% 8.0% 10.0% 12.0% 14.0% 16.0% Jan 2018 Mar 2018 May 2018 Jul 2018 Sep 2018 Nov 2018 Jan 2019 Mar 2019 May 2019 Jul 2019 Sep 2019 Nov 2019 Jan 2020 Mar 2020 May 2020 Jul 2020 Sep 2020 Nov 2020 Jan 2021 Mar 2021 Austin Texas US
  • 2. Colliers | Austin | 21Q1 | Office Report Office Austin, TX 21Q1 Sublease Environment 26% 2% 12% 4% 4% 5% 27% 1% 19% CBD Central & West Central East North / Domain Northeast Far Northwest Northwest South Southwest 20Q1 20Q4 21Q1 CBD 139,946 662,096 791,981 Central & West Central 35,517 63,979 70,457 East 58,805 222,983 381,831 Domain 8,753 103,007 106,960 Northeast 165,160 119,636 119,636 Far Northwest 88,861 96,124 162,377 Northwest 311,828 657,467 846,869 South – 38,714 35,909 Southwest 189,722 358,329 571,151 The Market, at a Glance As Austin began to wake up from the winter slumber and employees began to peek behind the curtains of their home office, Winter Storm Uri swept through Texas in mid-February and put a freeze on leasing and sales activity for almost two weeks as millions of Texans battled through the aftermath of unfamiliar weather. As evident by the Bluebonnets blooming though, Texas remained resilient and pushed through to a warmer (and vaccinated) environment, where Austin continues to remain toward the top of the list for institutional investments, office expansions and headquarter relocations. More than 10 companies announced the opening of an office or headquarters relocation in Austin in Q1 of 2021, with a dozen other investment and development firms acquiring a real estate asset in the greater Austin area. F45 Training and Tishman Speyer are two notable new tenants and investors in Austin. The Australian-based fitness franchise F45 signed a 44,000 SF, 8-year lease in South Austin’s Penn Field offices, and New York-based Tishman Speyer made their first Austin purchase with the acquisition of the Foundry I, a 76,000 SF office project on the Eastside. In addition to Austin’s new residents, some of our local and established groups stretched out for some elbowroom as well. Vinson & Elkins made a pivotal move and leased 50,000 SF in the Indeed Tower downtown, breaking away from their previous suburban location, and Texas Municipal Retirement System signed a 47,000 SF lease at The Grove, an Endeavor project in Central Austin. While Q1 saw more completed transactions than any other quarter in the past year, overall numbers are still lagging behind this activity with negative absorption rates and an increasing supply of sublease space, though most of our sublease space this quarter can be attributed to Parsley Energy (369,000 SF, 300 Colorado) and Spiceworks (49,000 SF, 3600 San Clemente). Future Forecast Developers and buyers continue to be bullish on Austin, and it is hard to disagree otherwise. Even with the option to work from home likely to be a standard offering by employers moving forward, the bigger focus in Austin is not when employees are headed back into the office, but rather who is moving here next. The Austin Chamber of Commerce is tracking a record number of active prospects for incentive-worthy relocations and the residential real estate market is experiencing a supply-and-demand issue, to say the least. Those are two good indicators that Austin still has some growing to do, which means pricing is likely to do the same.
  • 3. Colliers | Austin | 21Q1 | Office Report Office Austin, TX 21Q1 0.0% 2.0% 4.0% 6.0% 8.0% 10.0% 12.0% 14.0% 16.0% 18.0% 20.0% $0.00 $10.00 $20.00 $30.00 $40.00 $50.00 $60.00 $70.00 Q4 2019 Q1 2020 Q2 2020 Q3 2020 Q4 2020 Q1 2021 CBD Citywide Vacancy Rate Notable Completions Jan ‘21 Jan ‘21 Apr ‘21 Apr ‘21 (1,500,000) (1,000,000) (500,000) 0 500,000 1,000,000 1,500,000 Q4 2019 Q1 2020 Q2 2020 Q3 2020 Q4 2020 Q1 2021 Deliveries Net Absorption Bouldin Creek 167,130 SF | South Unico Properties Austin Continuum 254,806 SF | North Southwest Value Partners ShadySide 64,674 SF | East Saxum Real Estate Seven Oaks West 130,152 SF | Southwest Miller Global Properties Eastlake at Tillery 172,423 SF | East Cypress Real Estate Advisors 300 Colorado 353,938 SF | CBD Cousins Properties (1,500,000) (1,000,000) (500,000) 0 500,000 1,000,000 1,500,000 Q4 2019 Q1 2020 Q2 2020 Q3 2020 Q4 2020 Q1 2021 Deliveries Net Absorption Supply & Absorption Pandemic challenges forced many to shutter their doors during the past year, and several brand-name institutions (Google, Indeed, Facebook, etc.) found themselves potentially over-committed on projects not yet under construction. As a result. sublease space of +3.0M SF flooded into the market, causing consecutive quarters of negative absorption (Q1 2020 absorption of -630K SF). With the introduction of a COVID vaccine, however, Austin can expect a rebound in leasing activity and an upwards trend in absorption levels, which should help relieve the pressure from future development projects (+5.8M SF under construction). Furthermore, Tesla’s Gigafactory served as a de facto “Vote of Confidence”, spurring additional commercial interest in the city. Direct Lease Rates A citywide asking rate of $45.60/SF comes in a slight step above Q4 2020’s rate of $44.74/SF, largely due to rising OpEx expenses. Although rental rates have remained steady Quarter over quarter, Landlords aren’t hesitant to use flexible concession packages and reduced lease-terms in order to secure tenants. An influx of newly constructed space with significant availability (as of Q1 2021), projects under construction are ±40% leased) will pressure building owners even further, however, a revitalization of leasing activity should allow rates to remain steady during the remainder of 2021.
  • 4. Colliers | Austin | 21Q1 | Office Report Office Austin, TX 21Q1 Upcoming Projects Citywide Construction 52% 35% 5% 5% 3% CBD East Far Northwest Southwest Central 0 500,000 1,000,000 1,500,000 2,000,000 2,500,000 3,000,000 3,500,000 4,000,000 Q2 2021 Q3 2021 Q4 2021 2022 2023 Leased Under Construction 405 Colorado CBD 18% Leased 2Q '21 206,946 Indeed Tower CBD 61% Leased 2Q '21 669,130 Austin Energy HQ East TBD 2Q '21 275,000 Domain Tower 2 North TBD 3Q '21 330,000 405 Colorado CBD 18% Leased 2Q '21 206,946 Indeed Tower CBD 61% Leased 2Q '21 669,130 Austin Energy HQ East TBD 2Q '21 275,000 Domain Tower 2 North TBD 3Q '21 330,000 RiverSouth South TBD 3Q '21 350,661 Indeed Tower CBD 61% Leased 2Q '21 669,130 Austin Energy HQ East TBD 2Q '21 275,000 Domain Tower 2 North TBD 3Q '21 330,000 RiverSouth South TBD 3Q '21 350,661 Block 185 CBD 100% 2022 796,525 Indeed Tower CBD 61% Leased 2Q '21 669,130 Austin Energy HQ East TBD 2Q '21 275,000 Domain Tower 2 North TBD 3Q '21 330,000 RiverSouth South TBD 3Q '21 350,661 Block 185 CBD 100% 2022 796,525 Austin Energy HQ East TBD 2Q '21 275,000 Domain Tower 2 North TBD 3Q '21 330,000 RiverSouth South TBD 3Q '21 350,661 Block 185 CBD 100% 2022 796,525 Domain Tower 2 North TBD 3Q '21 330,000 RiverSouth South TBD 3Q '21 350,661 Block 185 CBD 100% 2022 796,525 405 Colorado St. Brandywine Realty Trust 206,946 SF | CBD Q2 2021 Delivery 14% Leased Domain Tower 2 Stonelake Capital Partners 330,000 SF | North Q3 2021 Delivery 1% Leased RiverSouth Stream Realty Partners 350,661 SF | South Q3 2021 Delivery 22% Leased Block 185 Trammel Crow Company 796,525 SF | CBD 2023 Delivery 100% Leased Austin Energy HQ Catellus Development Corp 275,000 SF | East Q2 2021 Delivery 100% Leased Indeed Tower Trammell Crow Company 669,130 SF | CBD Q2 2021 Delivery 76% Leased Q2 2021 Expected Deliveries
  • 5. Copyright © 2021 Colliers The information contained herein has been obtained from sources deemed reliable. While every reasonable effort has been made to ensure its accuracy, we cannot guarantee it. No responsibility is assumed for any inaccuracies. Readers are encouraged to consult their professional advisors prior to acting on any of the material contained in this report. FOR MORE INFORMATION John O’Sullivan Research Associate Austin +1 512 539 3012 john.o’sullivan@colliers.com David Bremer Managing Director Austin +1 512 539 3014 david.bremer@colliers.com Submarket Existing Inventory (SF) Direct Vacancy (SF) Sublease Vacancy (SF) Overall Vacancy Rate Quarterly Net Absorption (SF) Weighted Average Asking Rate Downtown CBD 11,924,009 1,178,408 791,981 16.5% 65,505 $61.22 TOTAL 11,924,009 1,178,408 791,981 16.5% 65,505 $61.22 Market Total CBD 11,924,009 1,178,408 791,981 16.5% 65,505 $61.22 Suburban 45,776,585 5,984,110 2,340,461 18.2% (694,425) $41.32 TOTAL 57,700,594 7,162,518 3,132,442 17.8% (628,920) $45.60 Suburban Central & West Central 2,973,144 339,313 70,457 13.8% 34,312 $47.22 East 1,852,922 512,473 381,831 48.3% 15,568 $56.01 North / Domain 4,364,772 582,802 106,960 15.8% (98,679) $39.56 Northeast 2,649,981 573,504 119,636 26.2% (96,630) $36.52 Far Northwest 4,264,803 536,436 162,377 16.4% (61,936) $40.02 Northwest 12,903,660 1,544,639 846,869 18.5% (334,935) $38.02 Round Rock 1,439,707 145,510 37,271 12.7% (6,184) $34.18 South 1,769,268 474,287 35,909 28.8% 17,253 $51.40 Southeast 2,177,582 258,619 8,000 12.2% (6,531) $34.89 Southwest 11,380,746 1,016,527 571,151 14.0% (156,663) $43.96 TOTAL 45,776,585 5,984,110 2,340,461 18.2% (694,425) $41.32 Austin | Q1 2021 | Office | Market Statistics